


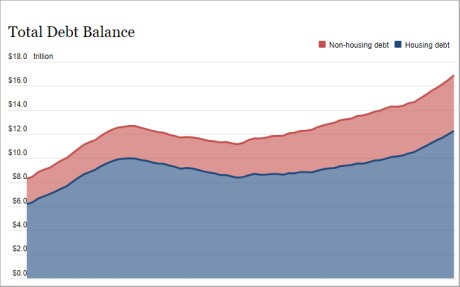
Total debt balances grew by $394 billion in the fourth quarter of 2022, the largest nominal quarterly increase in twenty years, according to the latest Quarterly Report on Household Debt and Credit from the New York Fed’s Center for Microeconomic Data. Mortgage balances, the largest form of household debt, drove the increase with a gain of $254 billion, while credit card balances saw a $61 billion increase—the largest observed in the history of our data, which goes back to 1999. All told, the increase in credit card balances between December of 2021 and December of 2022 was $130 billion, also the largest annual growth in balances. Delinquency transitions in the fourth quarter ticked up as well, for credit cards, auto loans, and mortgages. These are increases in delinquency transition rates that appear relatively small, perhaps a return to pre-pandemic norms, but our closer look here reveals some worsening of delinquency rates among certain groups. In this analysis as well as in the Quarterly Report we use our Consumer Credit Panel (CCP), which is based on anonymized credit reports from Equifax.
The transition rates into early and serious delinquency, which are featured as pages 13 and 14 of our Quarterly Report on Household Debt and Credit, are balance weighted—the calculation for the 90+ transition rate, specifically, is the balance that moved from current or less than 90 days past due into 90+ days past due since the previous quarter. The charts show a fairly large increases in auto loan and credit delinquency transition rates over the past four quarters from the unusually low levels reached earlier in the year and now are approaching pre-pandemic levels.
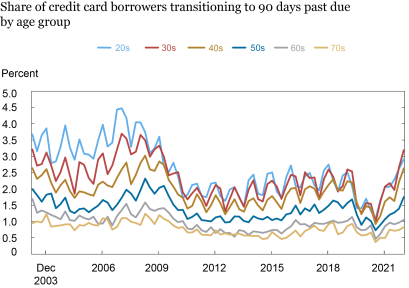
In the following two charts, we instead change the focus from balances to borrowers, by measuring the percentage of borrowers that transition into late delinquency during the quarter. [NB: the numerator is the number of borrowers who became 90+ days past due, and the denominator is the number of borrowers who were less than 90 days past due in the previous quarter]. Here, we see a slightly different picture—credit card borrowers are missing their payments and transitioning to 90+ day delinquency at a rate higher than they had before the pandemic. (These rates are higher than the balance-weighted ones shown in the Quarterly Report because low-balance borrowers are generally more likely to become delinquent.) The chart disaggregates these rates by age, and we see that this is particularly true for younger borrowers who have surpassed their pre-pandemic rates, while for older borrowers, the rates are rising but have not yet reached their pre-pandemic levels.
Delinquency Rate for Credit Card Borrowers Surpasses Pre-Pandemic Norms
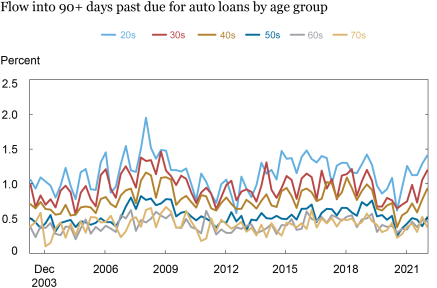
The next chart shows the same calculation, but for auto loans. We see that there’s a similar trend, although auto loan performance at the person level remains slightly healthier than it had just before the pandemic for most age groups, but younger borrowers are struggling relatively more.
Younger Borrowers Are Missing Auto Loan Payments
Although the overall share of debt that is delinquent remains below pre-pandemic levels, the relatively high transition rates into delinquency suggest a rapid return to pre-pandemic delinquency rates for credit card and auto loan borrowers.
Contributing Factors
There are many potential factors behind these worsening delinquency rates, although the relative impact of each on the financial distress of households is somewhat uncertain.
One contributing factor may be rising interest rates. As interest rates rise, so does the cost of borrowing, and higher interest rates result in higher minimum monthly payments for credit card balances. On the other hand, most auto loans are fixed rate loans, so only auto loans taken out more recently faced these higher rates. This difference between credit card debt (variable rates) and auto loans (fixed rate) is consistent with the pattern of delinquencies rising faster for credit cards than for auto loans and may be evidence of higher interest rates driving some of the increase in delinquency.
Another possibility is a worsening in underwriting standards—perhaps it has been easier for those with lower credit scores to borrow, and this is starting to show up in the debt performance. However, a look into our CCP data suggests this is unlikely. Auto loan underwriting standards appear to have been relatively steady during the pandemic, with the median score of newly originated loans staying roughly constant—and relatively high—during the past few years. For credit cards, we do see a small increase in the number of subprime cards that had been opened in the past few years, but these cards are typically associated with very low limits. In the individual-level measurements as shown above, small delinquent balances would be weighted equally to large ones. So, while underwriting may have played some part in the worsening delinquency rate for credit cards, it is likely a minor one, and unlikely to be an issue for auto loans. One potential caveat to this argument would be a decreased accuracy of credit scores as a measure of a consumer’s true credit worthiness, as temporary financial relief during the pandemic boosted credit scores, for example by making most delinquent federal student loan borrowers current on their loans (See, “Three Key Facts from the Center for Microeconomic Data’s 2022 Student Loan Update.”)
Another potential factor is inflation, since the pace of inflation sped up sharply through 2021 and 2022, reaching a fourty-year high last summer. A big factor underlying the initial increase in inflation rates was car prices, and this is directly exhibited in our data—at the end of 2019, the average new auto loan was for about $17,000, but that amount grew rapidly through the pandemic, peaking at nearly $24,000 in the fourth quarter of 2022. Americans have been facing higher prices everywhere though—including on purchases they may be putting on their credit cards—at the grocery store, at the gas pump, and for many other types of goods. It is possible that increasing prices—and correspondingly, debt service payments—are cutting into borrowers’ balance sheets and making it more difficult for them to make ends meet, particularly as real disposable income fell in 2022.
Another contributing factor is simply the reversion to the pre-pandemic delinquency rates as various pandemic support policies to the household sector have expired, suggesting that the lower delinquency rates in the pandemic period were transient and they are now returning to the “more normal” state. This leaves us with a critical question though—will these delinquency rates continue to rise, or will they flatten out now?
Surpassing the pre-pandemic delinquency rates isn’t worrisome per se, because the pandemic recession ended what had been a historically long economic expansion. But the fact that more borrowers are missing their payments, particularly when economic conditions appear strong overall, is somewhat of a puzzle. This is particularly concerning for younger borrowers who are disproportionately likely to hold federal student loans that are still in administrative forbearance. Some of these borrowers are struggling to pay their credit card and auto loans even though payments on their student loans are not currently required. Once payments on those loans resume later this year under current plans, millions of younger borrowers will add another monthly payment to their debt obligations, potentially driving these delinquency rates even higher.
Conclusion
As borrower-level delinquency rates approach or surpass pre-COVID norms, many look to the historical culprit: the labor market. However, employment and income gaps are not likely triggers for this recent trend. The Bureau of Labor Statistics reported that there were just under 6 million unemployed in the fourth quarter of 2022, roughly unchanged from the previous quarter and near a fifty-year low (even as the population and labor force have grown). Meanwhile, there were 18.3 million borrowers behind on a credit card at the end of 2022 compared to 15.8 million at the end of 2019. Instead, the evidence suggests that higher prices and higher interest rates are the more likely culprits driving delinquencies. While person-level delinquencies are high, we do not anticipate widespread stress for lender portfolios as balance weighted delinquencies remain at or below pre-pandemic levels. But, on a person-level, this financial distress is real, and the delinquent marks will impact their access to credit for years to come.

Andrew F. Haughwout is director of Household and Public Policy Research in the Federal Reserve Bank of New York’s Research and Statistics Group.

Donghoon Lee is an economic research advisor in Consumer Behavior Studies in the Federal Reserve Bank of New York’s Research and Statistics Group.

Daniel Mangrum is a research economist in Household and Public Policy Research in the Federal Reserve Bank of New York’s Research and Statistics Group.

Joelle Scally is a senior data strategist in the Federal Reserve Bank of New York’s Research and Statistics Group.

Wilbert van der Klaauw is an economic research advisor on Household and Public Policy Research in the Federal Reserve Bank of New York’s Research and Statistics Group.
How to cite this post:
Andrew Haughwout, Donghoon Lee, Daniel Mangrum, Joelle Scally, and Wilbert van der Klaauw, “Younger Borrowers Are Struggling with Credit Card and Auto Loan Payments,” Federal Reserve Bank of New York Liberty Street Economics, February 16, 2023, https://libertystreeteconomics.newyorkfed.org/2023/02/younger-borrowers-are-struggling-with-credit-card-and-auto-loan-payments/
BibTeX: View |

Disclaimer
The views expressed in this post are those of the author(s) and do not necessarily reflect the position of the Federal Reserve Bank of New York or the Federal Reserve System. Any errors or omissions are the responsibility of the author(s).
 RSS Feed
 Follow Liberty Street Economics
Thank you for mentioning that the majority of vehicle loans had fixed rates, meaning that only loans for cars that were taken out more recently have these higher rates. My mother claims that she needs to purchase a vehicle for her professional demands. I’ll advise her to obtain auto loan services.
To David Moore: We suspect you’re talking about what are known as Buy Now, Pay Later loans, which is a rapidly growing consumer debt product. They are not (yet) routinely reported to the credit bureaus, so we aren’t able to clearly identify them in our data. To the extent that they are reported, they would be included in the ‘other’ type of debt shown in our report.
I have noticed a recent explosion in the number of vendors offering and often encouraging payment plans. I get offers for items that cost under $100. I have also read that many young people routinely buy things using these payment plans. Is this sort of direct credit provided by non-financial entities included in the various data series that you collect?
Pay cash as you go, and you will never owe ! As my wife says it’s affordable if you can afford it.