


Editor’s Note: The data file linked at the bottom of this post, which summarizes who holds student loans along with characteristics of these balances, has been updated through the fourth quarter of 2022. The text of the blog post has been updated to reflect the latest data. (September 22, 2023)

Today, researchers from the Center for Microeconomic Data released the 2022 Student Loan Update, which contains statistics summarizing who holds student loans along with characteristics of these balances. To compute these statistics, we use the New York Fed Consumer Credit Panel (CCP), a nationally representative 5 percent sample of all U.S. adults with an Equifax credit report. For this update, we focus on individuals with a student loan on their credit report. The update is linked here and shared in the student debt section of the Center for Microeconomic Data’s website. In this post, we highlight three facts from the current student loan landscape.
Fact 1: More borrowers are facing growing balances
On pages 4 and 5 of the 2022 Student Loan Update, we classify student loan borrowers into four mutually exclusive categories, according to the evolution of their balances from the balance a year prior:
- Those who are current on their account and their balance is smaller,
- Those who are current on their account, but their balance is either the same or higher,
- Those with a student loan that is ninety or more days past due, and
- Those with a loan in default.
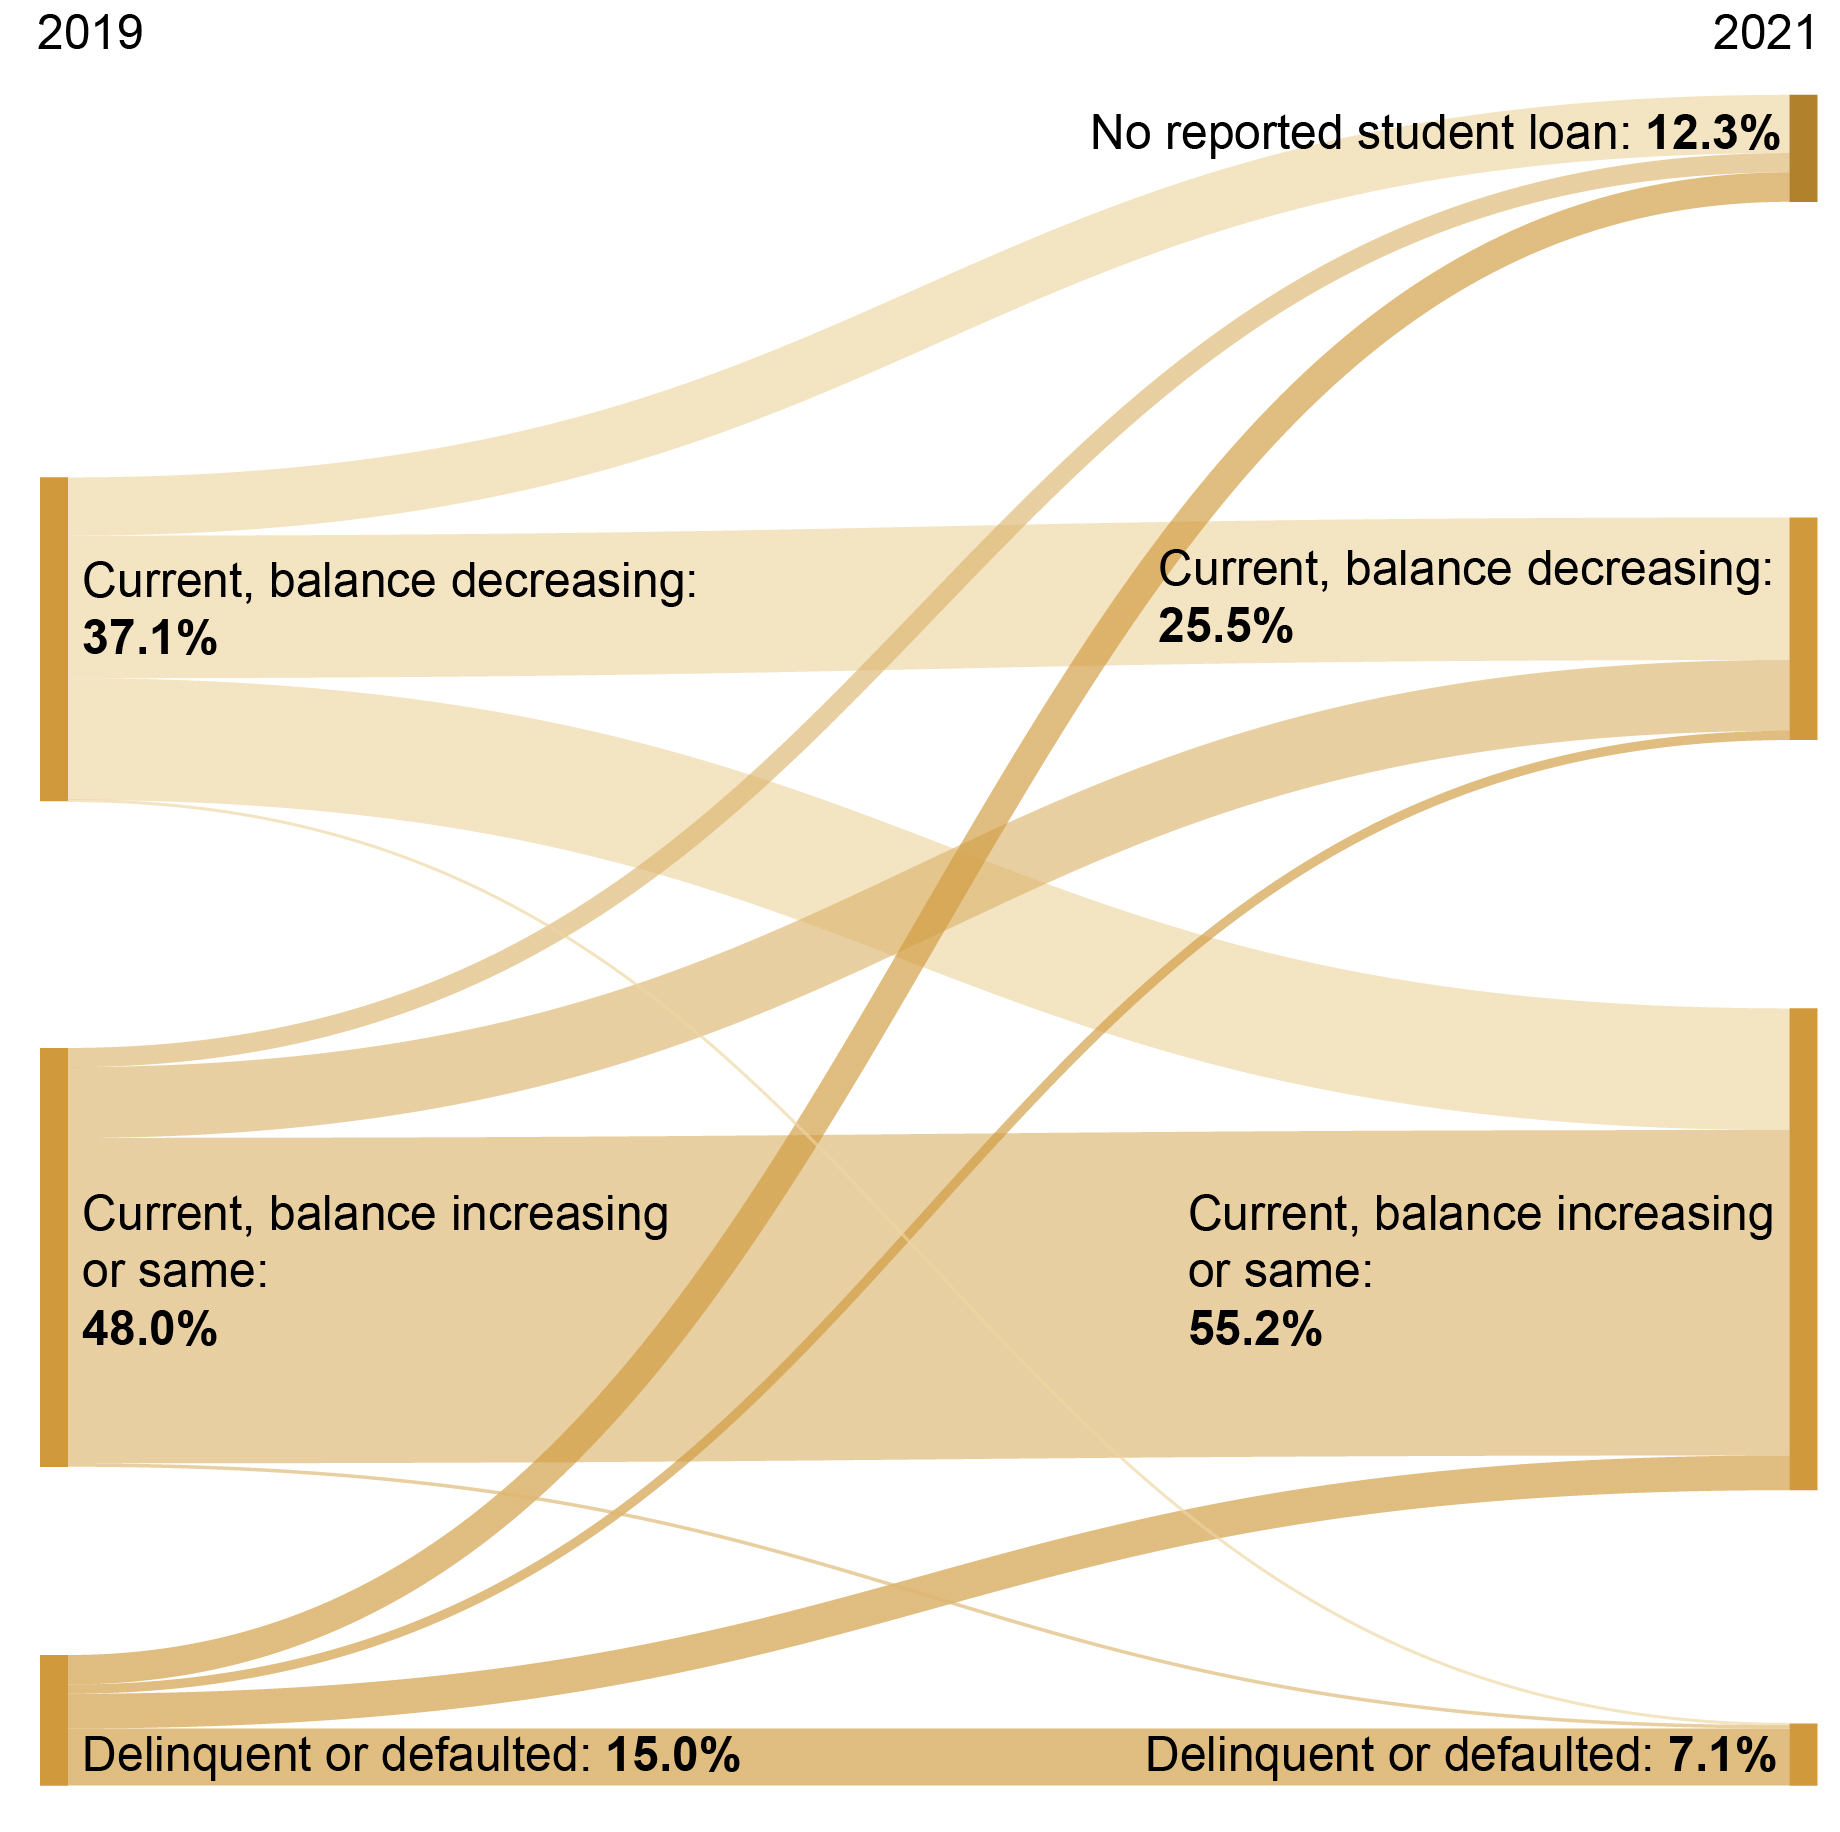
Over the past decade (but prior to the COVID-19 pandemic), the share of borrowers in each of these categories was relatively stable—around 37 percent of borrowers had declining balances, around 47 percent of borrowers had either flat or increasing balances, and around 15 percent of borrowers were in delinquency or default. However, average balances have not been similar across these categories. In 2019, the average balance of those with a declining balance was smaller ($22,342) than those with an increasing balance ($44,993).
The federal response to the pandemic for federal student loan borrowers upended these proportions. The share of borrowers with flat or growing balances increased from 48 percent at the end of 2019 to 66 percent at the end of 2021. Meanwhile, the share of borrowers with a delinquent or defaulted loan was halved from 15 percent to 7.5 percent as federal borrowers were not required to make payments and most delinquent borrowers were automatically marked current.
To better understand individual borrower behavior, we present a flow chart below that shows the share of borrowers who moved across categories between the end of 2019 and the end of 2021. For simplicity, we restrict attention to borrowers who had a student loan on their credit report at the end of 2019. The share of borrowers with a declining balance reduced from 37.1 percent to 25.5 percent, fueled by a large transition to the flat or increasing category following the pandemic forbearance. However, 10.3 percent of borrowers moved from the flat or increasing category to the decreasing or no reported loan category (this category includes those whose loans were paid in full, forgiven, or charged off). This shift is likely due to borrowers taking advantage of the payment freeze and interest waiver to reduce balances during the pandemic. Additionally, many borrowers who were delinquent or defaulted were able to move to current. For delinquent borrowers eligible for pandemic forbearance, this status change was achieved automatically. Meanwhile, many defaulted borrowers were able to rehabilitate their loans during the pandemic forbearance without having to make monthly payments. On net, the size of the “same or higher” pool of borrowers increased by over 7 percentage points, or roughly 3.2 million borrowers, over the course of the pandemic. Additionally, 12.3 percent of borrowers (5.4 million) who had a student loan at the end of 2019 no longer had a student loan on record at the end of 2021.
More the Half of Student Loan Borrowers’ Balances Are Not Declining
Fact 2: Credit scores for student loan borrowers increased dramatically during the pandemic
Page 6 of the 2022 Student Loan Update shows the total number of borrowers by credit score groups (see also the chart below). Credit scores here are Equifax Risk Scores, which are comparable to FICO credit scores. Borrowers are separated into groups by credit score: below 620, from 620-659, from 660-719, from 720-759, or over 760. Pre-pandemic years saw small declines in the share of borrowers with scores below 620, from 40 percent in 2011 to 36 percent in 2019. Meanwhile, those in the two highest credit score groups increased from 25 percent of student loan borrowers to 29 percent over that period. After the pandemic, subprime borrowers (those with scores below 620) dropped 8 percentage points to 28 percent of the total in 2021, while the share of borrowers with scores of 660-719 increased 2.5 percentage points to 24.6 percent and the share of super-prime borrowers (those with scores of 720+) increased by 5 percentage points to 34 percent. The share of balances held by super-prime borrowers increased over the pandemic from 27.1 percent ($236 billion) of student loan debt in 2011 to 32.1 percent ($482 billion) in 2019, and then to 38.7 percent ($609 billion) by 2021. Meanwhile, the share of balances held by subprime borrowers fell from 35.6 percent ($536 billion) of student loan debt in 2019 to 26.0 percent ($409 billion) in 2021.
Student Loan Borrowers Reached Highest Overall Creditworthiness in 2021
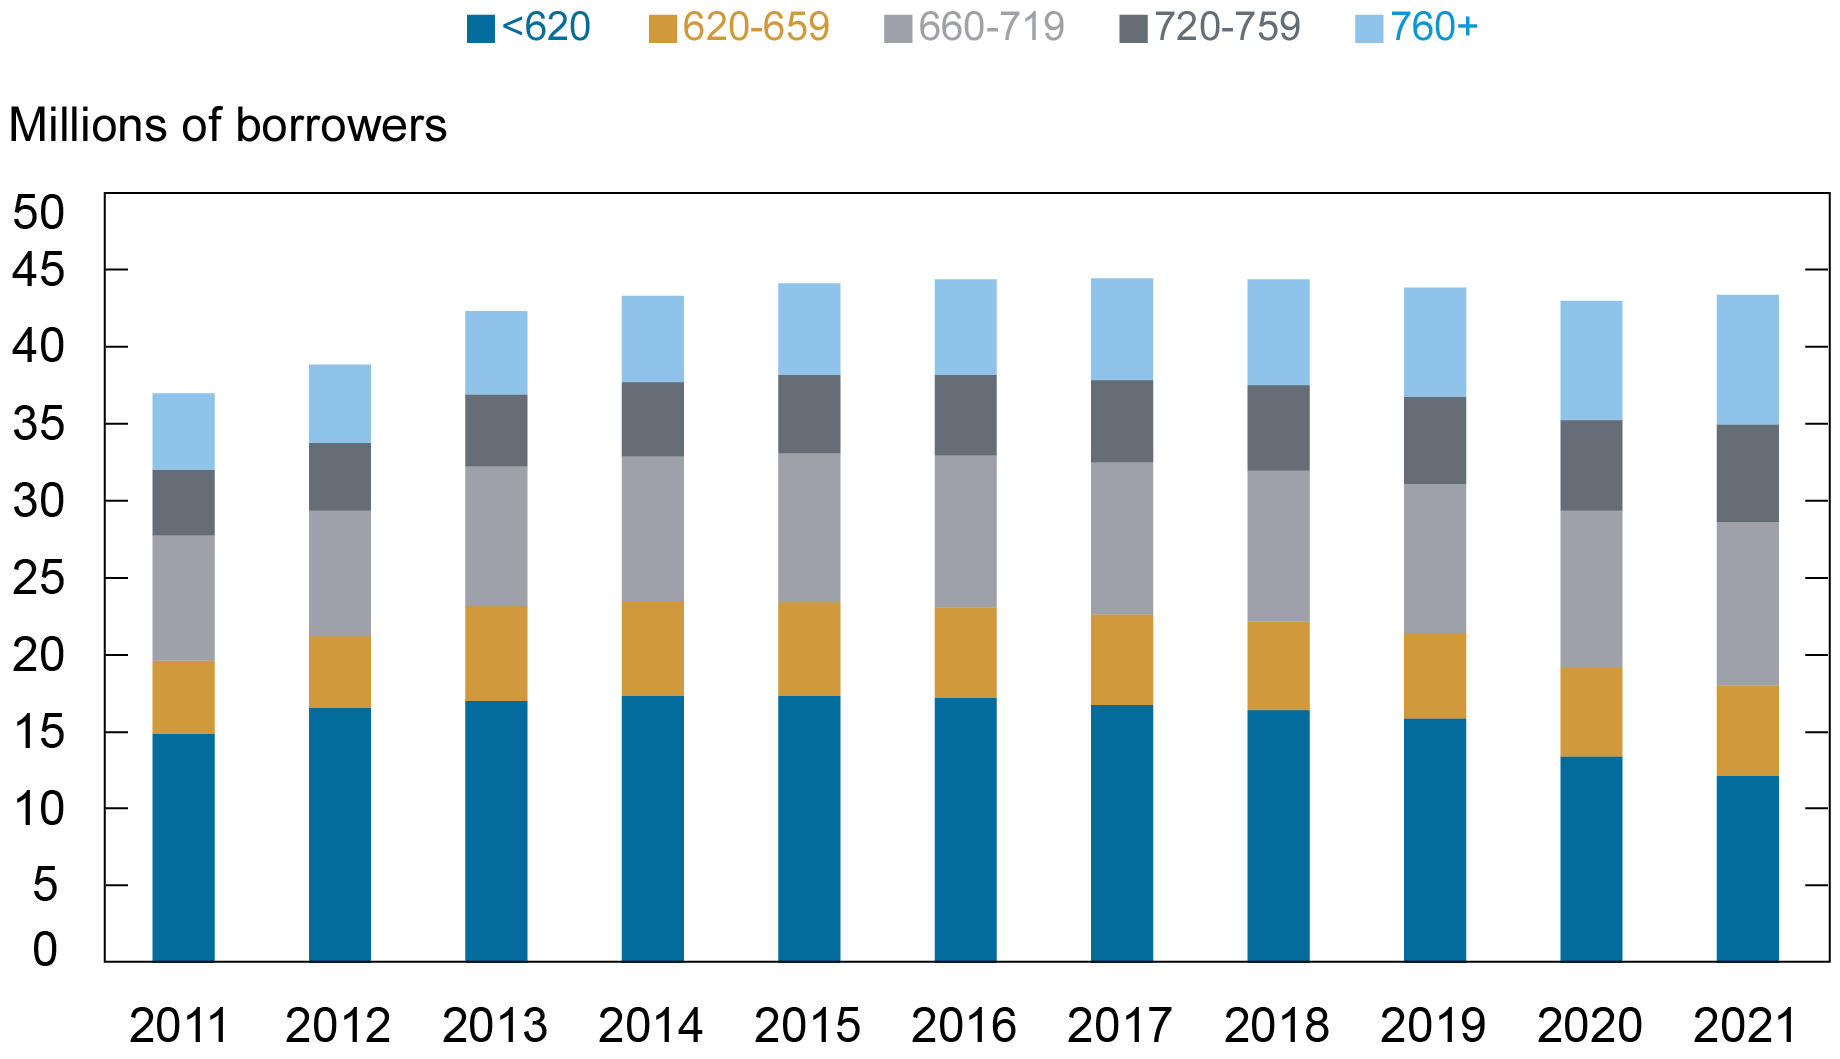
Note: Credit scores here are Equifax Risk Scores, which are comparable to FICO credit scores.
The chart below shows credit score migrations of borrowers with a recorded balance and risk score in both 2019:Q4 and 2021:Q4. For simplicity, we reduce the number of credit score groups to three: subprime borrowers (with credit scores below 620), borrowers with credit scores from 620-719, and super-prime borrowers (with scores over 720). During the pandemic, there were significant flows to higher credit score groups. For example, by the end of 2021, 29.7 percent of formerly subprime borrowers moved to the 620-719 group (with a median risk score increase of 82 points), and 29.4 percent in the middle risk score group moved to the highest group (with a median risk score increase of 54 points). In total, 79.1 percent (30 million) borrowers saw increases to their credit scores during the pandemic, and 21.9 percent (8 million) increased their scores enough to migrate to a higher credit score group as defined here. This shifting of the credit score distribution is greater than for a similar period before the pandemic. Between 2017 and 2019, 71.9 percent (27 million) increased their credit scores, and 16.1 percent (6 million) increased their scores enough to migrate to a higher group. For some, the improvement in risk score stemmed from overall better financial footing; for example, credit card utilization, which influences the score, declined for student loan borrowers from 64.6 percent in 2019 to 58.5 percent in 2021. Student loan borrowers who were delinquent prior to the pandemic saw the largest increases in risk scores when their balances were marked current at the start of the pandemic. The median change among these borrowers was a greater than 100-point increase.
Nearly 80 Percent of Student Loan Borrowers Had Higher Credit Scores by the End of 2021
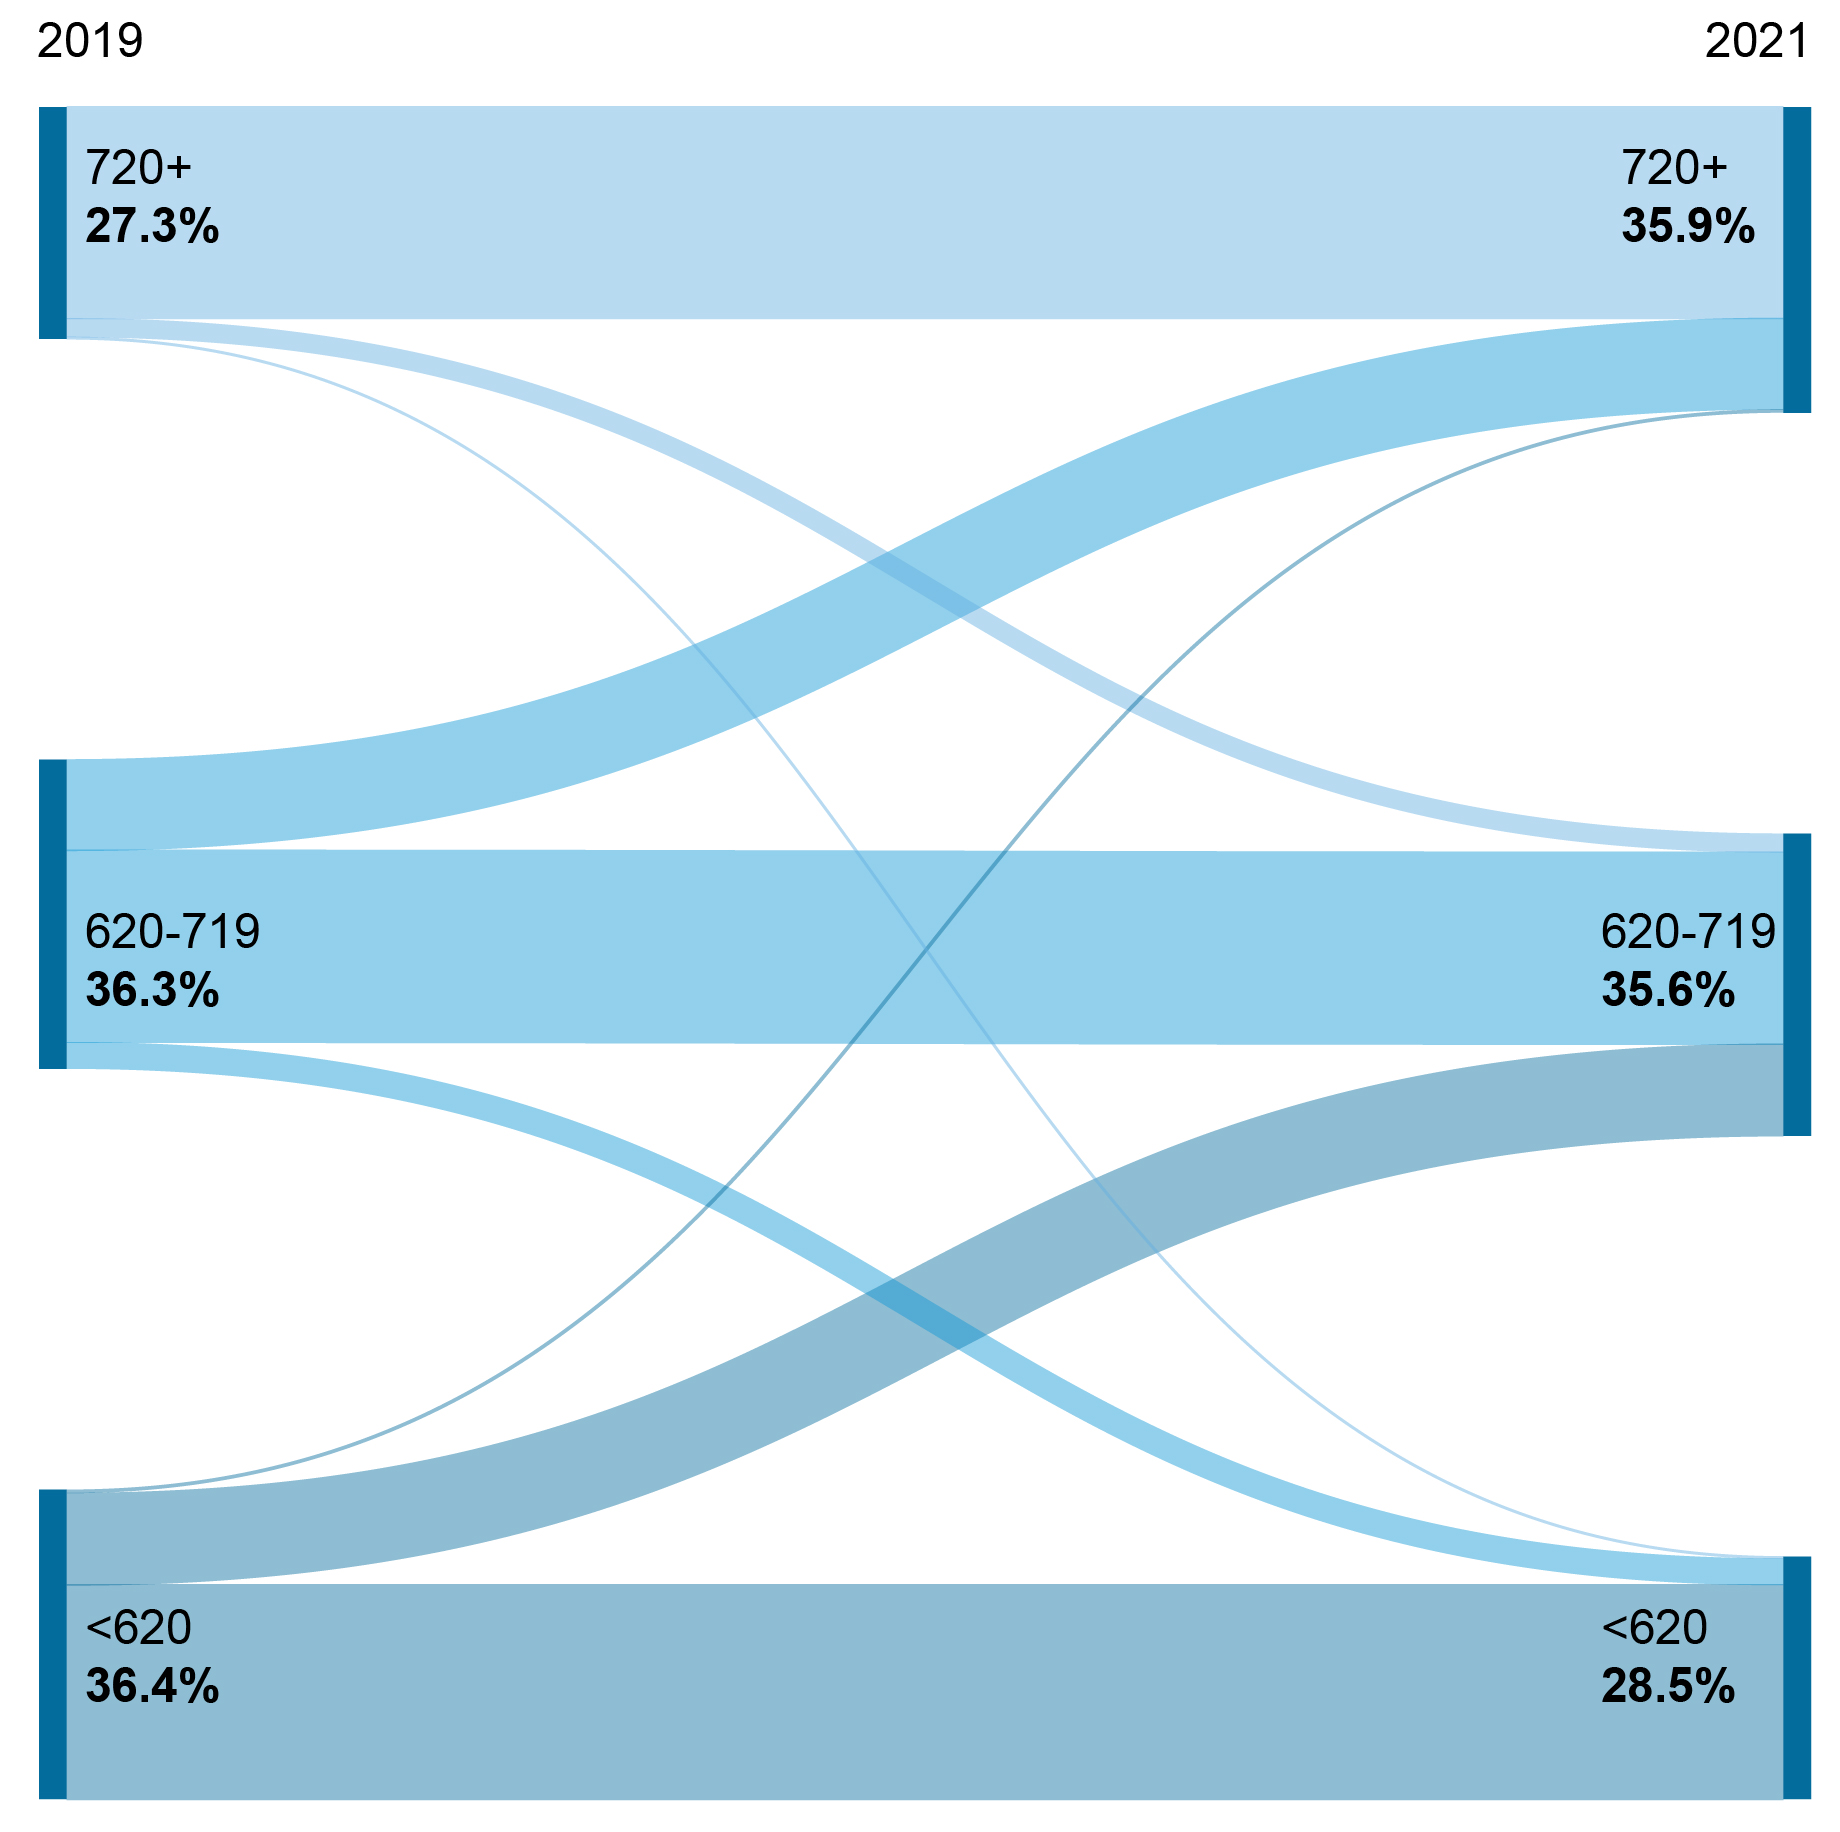
Note: Credit scores here are Equifax Risk Scores, which are comparable to FICO credit scores.
Fact 3: Student loan balances and delinquency rates vary widely across states with worse outcomes in the South
On pages 9 through 11 of the 2022 Student Loan Update, we report the average balance, median balance, and borrower delinquency rate for student loan borrowers by state for 2019, 2020, and 2021. Median balances vary widely across states with Wyoming having the smallest median balance ($14,660) and Maryland and Georgia having the largest ($22,000), although Puerto Rico has the lowest median balance of $12,210 and Washington, D.C. outpaces all states with a median balance of $28,510. Of the ten states (not including D.C.) with the largest median balance, six belong to the Southern Census region (Georgia, Maryland, Virginia, North Carolina, South Carolina, and Alabama).
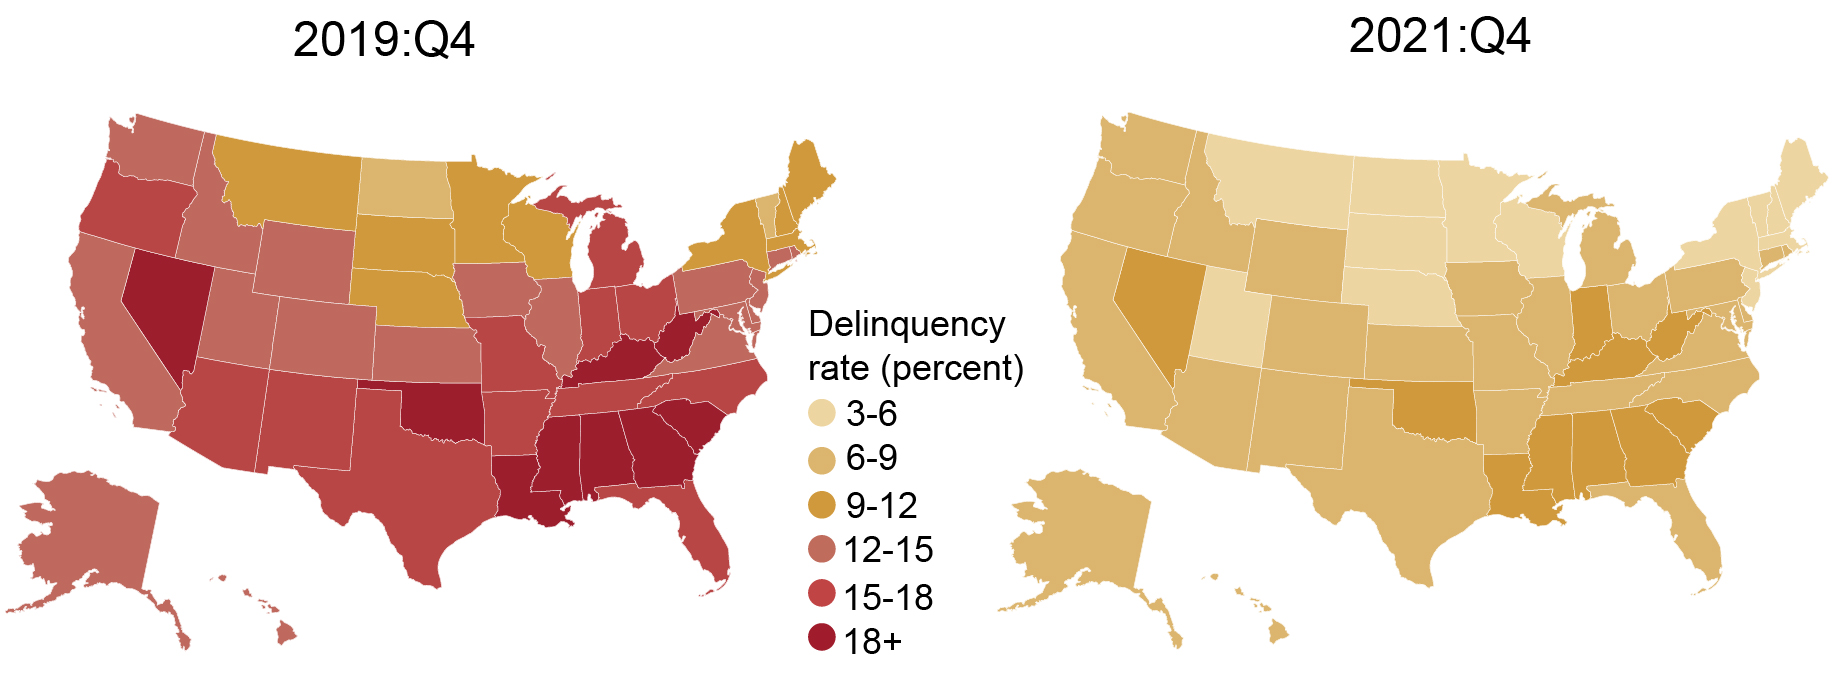
Below, we report the borrower delinquency rate for each state for the end of 2019 and the end of 2021. Prior to the pandemic, the median state had 14.1 percent of borrowers with either a delinquent or defaulted student loan on their credit report. The borrower delinquency rates were the highest in Mississippi (22.1 percent of student loan borrowers), Puerto Rico (20.2 percent), and Louisiana (19.5 percent) and lowest in Vermont (9.6 percent) and North Dakota (9.7 percent). As with median balances, the South also had the highest borrower delinquency rates, claiming ten of the top twelve states. In fact, every state in the Southern Census region except Virginia had a borrower delinquency rate equal to or higher than the median state.
Due to the automatic forbearance for federal student loans during the pandemic, the borrower delinquency rate dropped dramatically across the country when previously delinquent (but not defaulted) student loans owned by the federal government were marked current. Additionally, borrowers in default could more easily rehabilitate their defaulted loans during the forbearance period. At the end of 2021, the highest borrower delinquency rates were nearly halved (for example, Louisiana to 9.0 percent and Mississippi to 10.8 percent), although the general rank of states was largely unchanged.
Pandemic Relief Drastically Reduced Borrower Delinquency Rates
The student loan landscape is poised to change again dramatically between the end of 2021 and the end of 2022. Most critically, the pandemic forbearance for federal student loans is currently scheduled to end on August 31, 2022. If so, we expect a reduction in the share of student loan borrowers not making progress on their loans as payment requirements resume. While many will decrease their balances, some borrowers will enter delinquency or default. The extent of these shifts will largely depend on the policies that accompany the resumption of payments. If missed payments are not reported to credit bureaus, the rise in delinquency (and corresponding reductions in credit scores) will be delayed. The end of forbearance will have impacts on credit scores, borrowing, and household cash flow over the coming year for the 38 million federal borrowers that have benefitted from the pause, and we will continue to monitor how these dynamics unfold.


Daniel Mangrum is a research economist in Equitable Growth Studies in the Federal Reserve Bank of New York’s Research and Statistics Group.

Joelle Scally is a senior data strategist in the Federal Reserve Bank of New York’s Research and Statistics Group.

Crystal Wang is a former summer intern in the Federal Reserve Bank of New York’s Research and Statistics Group.
How to cite this post:
Daniel Mangrum, Joelle Scally, and Crystal Wang, “Three Key Facts from the Center for Microeconomic Data’s 2022 Student Loan Update,” Federal Reserve Bank of New York Liberty Street Economics, August 9, 2022, https://libertystreeteconomics.newyorkfed.org/2022/08/three-key-facts-from-the-center-for-microeconomic-datas-2022-student-loan-update/
BibTeX: View |
Disclaimer
The views expressed in this post are those of the author(s) and do not necessarily reflect the position of the Federal Reserve Bank of New York or the Federal Reserve System. Any errors or omissions are the responsibility of the author(s).
 RSS Feed
 Follow Liberty Street Economics