


U.S. oil and gas production boomed during the years leading up to the pandemic. From 2011 to 2019, oil production more than doubled and dry natural gas production rose by more than half. Remarkably, these gains occurred despite lackluster investment spending and hiring. Instead, higher production came largely from productivity gains, via wider adoption of fracking technologies. More recently, production recovered sluggishly from the pandemic downturn despite a quick recovery in prices. Our analysis in this post suggests that slower productivity growth and investors’ demand for higher returns have made U.S. firms willing to boost output only at a higher threshold oil price.
Productivity Drove a Boom in Oil and Gas Output
U.S. oil and gas production boomed during the years leading up to the pandemic. Real net output in the oil gas extraction industry more than doubled from 2011 to 2019 according to data published by the U.S. Bureau of Labor Statistics (BLS), a development shown by the top line of the chart below. The sharp rise in the BLS index was driven by an enormous increase in physical quantities. Crude oil production more than doubled over the period, while dry gas production rose by more than half. This growth came as a surprise as production had stagnated over the prior two decades.
Oil and gas extraction surged in the last decade
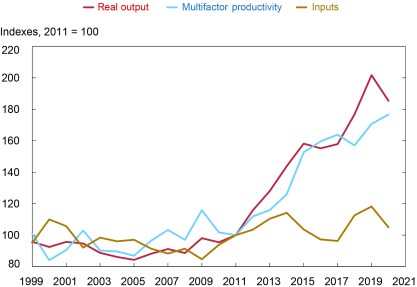
Notes: Real output is a composite of oil and gas extraction, taking account of the mix and value of specific oil and gas varieties. Real inputs are comprised of capital, labor, and intermediates, aggregated using production cost shares. The index also takes into account the mix and value of specific oil and gas product varieties.
The chart also shows that the BLS measure of real inputs rose only modestly over the period. Instead, the boom was driven largely by productivity gains—by the efficiency with which capital, labor and intermediate inputs were used, rather than by their quantity. This conclusion can be quantified via the economic concept of multifactor productivity (MFP)—a measure of the portion of output growth not explained by combined growth in inputs. The intuition is that increases in MFP reflect technological and organizational changes that boost output for a given quantity of inputs.
According to the BLS data, real inputs to oil and gas extraction grew by only 18 percent from 2011 to 2019 (the gold line in our chart). Multifactor productivity, derived as a residual between output growth and input growth, was up by slightly over 70 percent over the period (blue line).
More detailed data show that input growth came largely from increased use of intermediates: energy, materials and purchased services. Capital inputs rose by only about 5 percent over the period, with investment spending mostly going to offset depreciation. Labor inputs actually declined, reflecting a drop in hours worked.
The oil and gas productivity boom owed to the adoption and refinement of fracking and related technologies. These technologies enabled producers to access oil and gas embedded in shale and other “tight rock” formations and to achieve remarkable gains in drilling efficiency. Indeed, data from the U.S. Energy Information Agency, seen in the chart below, show crude oil production per active well more than doubling from 2011 to 2019, and gas production per well rising 50 percent. Total wells in operation, meanwhile, remained essentially flat.
Fracking technology drove strong productivity gains
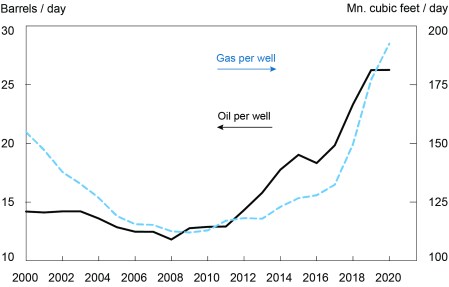
Note: The chart shows average output per active well.
Strong Productivity Growth Didn’t Mean Higher Profits
It seems natural to think that strong productivity growth would mean strong profit growth. After all, firms can increase output without spending more on inputs. Events didn’t turn out that way.
Our estimate of economic profits, shown by the blue bars in the chart below, declined over the period, with persistent losses setting in after 2014. (We rely on our own estimate because the official U.S. profit data don’t include unincorporated businesses, which hold about half the sector’s capital stock.) This profit performance translated into subpar returns for investors. Indeed, the Energy Information Administration estimates that the return on equity for energy companies was consistently below the return for manufacturing companies throughout the fracking boom.
Higher productivity has not been reflected in higher profits

Notes: Profits are equal to value added less labor compensation, depreciation, taxes on production net of subsidies, and net interest payments. Net interest payments are set equal to 65 percent of payments by the mining industry, since data for the oil and gas industry are not reported separately. Oil prices refer to WTI.
The mismatch between productivity and financial performance owes to weak prices. Oil and gas prices held near all-time highs from 2011 through late 2014 but then tumbled and remained low. In 2019, oil prices (the dotted black line in the chart) averaged 40 percent below their 2011 level. Natural gas prices at Henry Hub averaged 35 percent below their 2011 level. These price developments help explain why investment and hiring were so anemic. What productivity growth gave, lower prices took away.
A comparison of 2019 with the situation in 2009 is also instructive. Oil prices were about the same in both years. Yet profits were lower in 2019, with higher input costs putting a lid on the industry’s financial performance despite remarkable productivity gains.
The Tepid Recent Response to Higher Energy Prices
The onset of the pandemic sent energy prices into a tailspin and sharp cutbacks in production and exploration followed. But prices recovered and, by March 2021, oil prices had risen to $63/barrel, above the 2019 average. Natural gas prices moved past their 2019 average even more quickly, by late 2020. Both oil and gas prices then continued to trend higher.
U.S. production and investment were slow to recover in spite of the bounce back in prices. Crude oil production in June 2022 was about 7 percent below its level in early 2020. Gas production was only barely above that level. And real capital expenditure in the second quarter for oil and gas extraction was down some 15 percent from its pre-pandemic pace.
Why did U.S. production and capital expenditure respond so sluggishly? We see three related explanations—with important implications for future oil and gas production.
Uncertainty. Before Russia’s invasion of Ukraine, there were plausible scenarios under which oil prices might fall: another pandemic-induced slowdown, easing of sanctions on Iran and Venezuela, or higher production from Saudi Arabia. In this connection, producers considered the sizeable losses in 2015 and 2020 and were reluctant to expand.
Investor pressure. The 2022:Q1 Dallas Fed Energy Survey asked firms about factors holding back production. The most common answer was investor pressure to maintain high returns, with almost a 60 percent share. Recent analyst discussions also emphasize this theme. Keeping capital spending low leaves more money to return to investors as dividends or to pay down debt. This investor pressure for “capital discipline” is of course connected with uncertainty. Having been burned twice in the last decade, investors are more actively asking for higher returns.
Slower MFP gains. Firms may be responding to worries that the industry is nearing the end of outsized productivity gains. In this connection, MFP growth slowed to a 2.3 percent annual pace over 2016-2019—still impressive, but a sharp step down from a nearly 10 percent pace over 2011-2016. The slowdown likely reflects the maturing and now near universal adoption of fracking technologies.
A look at long-term performance across industries supports the notion that productivity growth in the oil and gas sector will remain lower than in the 2010s. Across successive multiyear periods, there is a marked tendency for industries seeing especially strong MFP growth during one period then experiencing muted growth during the next. A slowing in the sector’s MFP growth would sharpen the trade-off between output and capital discipline. Boosting output would then require higher investment outlays, leaving less cash to return to investors.
The 2022:Q1 Dallas Fed survey also asked firms what price would be needed to push the industry into “growth mode.” Some 41 percent of firms said $80-100/barrel would be needed. Another 29 percent cited a price above $100-120/barrel or higher. (The rest said the decision did not depend on prices.) The stronger pickup in extraction activity since Russia’s invasion of Ukraine, with prices staying above $100/barrel, is consistent with this survey response. Notably, similar questions in the third quarter of 2016 and the fourth quarter of 2017 placed growth mode at below $70/barrel. In short, U.S. firms are apparently willing to expand production aggressively only at a much higher price threshold than in the recent past.
A shift to a higher price threshold has global implications. During the 2010s, U.S. firms played a key role in keeping global energy prices low, via their outsized contribution to growth in global gas and energy production. Indeed, the Department of Energy estimates that 75 percent of the increase in global production of liquid fuels from 2010 to 2019 came from higher U.S. production. Slower productivity growth and investors’ demand for higher returns argue against a repeat performance in the years ahead. The result may be a persistently higher floor for global energy prices.

Matthew Higgins is an economic research advisor in International Studies in the Federal Reserve Bank of New York’s Research and Statistics Group.

Thomas Klitgaard is an economic research advisor in International Studies in the Federal Reserve Bank of New York’s Research and Statistics Group.
How to cite this post:
Matthew Higgins and Thomas Klitgaard, “The Disconnect between Productivity and Profits in U.S. Oil and Gas Extraction,” Federal Reserve Bank of New York Liberty Street Economics, August 17, 2022, https://libertystreeteconomics.newyorkfed.org/2022/08/the-disconnect-between-productivity-and-profits-in-u-s-oil-and-gas-extraction/
BibTeX: View |
Disclaimer
The views expressed in this post are those of the author(s) and do not necessarily reflect the position of the Federal Reserve Bank of New York or the Federal Reserve System. Any errors or omissions are the responsibility of the author(s).
 RSS Feed
 Follow Liberty Street Economics