


The recovery since the onset of the pandemic has been characterized by a tight labor market and rising nominal wage growth. In this post, we look at labor market conditions from a more granular, sectoral point of view focusing on data covering the nine major industries. This breakdown is motivated by the exceptionality of the pandemic episode, the way it has asymmetrically affected sectors of the economy, and by the possibility of exploiting sectoral heterogeneities to understand the drivers of recent labor market dynamics. We document that wage pressures are highest in the sectors with the largest employment shortfall relative to their pre-pandemic trend path, but that other factors explain most of the wage growth differentials. We suggest that one key factor is the extent of physical contact that has had to be compensated for by offering higher wages. One implication of our analysis is that, as COVID-related factors recede, sectoral imbalances could be restored from the supply side as employment recovers back toward the pre-pandemic trend.
Are Sectoral Labor Markets Tight? Descriptive Evidence
We focus our analysis on the NAICS industry breakdown of the following sectors: construction, manufacturing (goods-producing industries), trade, transportation, and utilities, information, financial activities, professional and business services, education and health services, leisure and hospitality, and other services (service-providing industries). We then collect data on the real and nominal Employment Compensation Index (ECI) from the Bureau of Labor Statistics (BLS) at a quarterly frequency, number of jobs opening data from the Job Opening and Labor Turnover Survey (JOLTS) and number of unemployed and employment data from the Current Population Survey (CPS) from the BLS at a monthly frequency for the sectors mentioned above starting from December 2000 to the most recent observation (June 2022).
We first document labor market tightness by using the unemployed people per job opening ratio as a measure of labor market conditions (see for example Domash and Summers (2022)). According to this metric, all sectors are now at ratios that are signaling tighter market conditions relative to the pre-COVID period except for construction. Moreover, service-providing industries have seen higher wage growth than goods producing industries. For example, as of the second quarter of 2022 annual wage inflation in leisure and hospitality was 66 percent higher than that of manufacturing.
Wage Inflation and Labor Market Tightness
We explore the link between nominal wage growth and labor market indicators by conducting a simple regression analysis. We regress nominal year-over-year ECI wage growth on the unemployed per opening measure of labor tightness at the sectoral level and on the four-quarter moving average of lagged year-over-year CPI inflation to check the relationship between sectoral wage inflation and past CPI yearly inflation. A negative coefficient on the labor tightness implies that less unemployed per job opening, that is, more labor market tightness, is associated with inflationary pressures on nominal wages. The sample period is from the fourth quarter of 2000 to the second quarter of 2022 for manufacturing, construction, and finance; from the first quarter of 2002 to the second quarter of 2022 for all other sectors. We use a COVID dummy at the sectoral level that applies from the starting point of the pandemic (from the first quarter of 2020 onward) to isolate specific pandemic factors that affect sectoral labor markets. As mentioned above, one example of these factors is the extent to which a sector is exposed to physical contact.
Wage Regressions Using Unemployed per Job Opening, COVID Dummy
| LSR | TRD | EDU | SRV | PRF | MFG | FIN | CNS | INF | |
|---|---|---|---|---|---|---|---|---|---|
| Unemployed per opening | -0.50*** | -0.33*** | -0.69*** | -0.47*** | -0.33** | -0.08*** | -0.42** | -0.07*** | -0.09 |
| (0.09) | (0.05) | (0.11) | (0.08) | (0.11) | (0.02) | (0.15) | (0.01) | (0.06) | |
| Lagged CPI-inflation | 0.34** | 0.22*** | 0.46*** | 0.32*** | 0.45*** | 0.26*** | -0.13 | 0.39*** | 0.10 |
| (0.12) | (0.06) | (0.06) | (0.09) | (0.08) | (0.05) | (0.13) | (0.07) | (0.07) | |
| COVID dummy | 3.13*** | 1.54∗∗∗ | 0.40* | 0.97** | 0.69* | 0.72*** | 0.64 | 0.33 | 0.98*** |
| (0.40) | (0.21) | (0.20) | (0.30) | (0.26) | (0.16) | (0.44) | (0.24) | (0.24) | |
| Constant | 2.85*** | 2.78*** | 2.36*** | 3.06*** | 1.90*** | 2.20*** | 3.66*** | 2.25*** | 2.25*** |
| (0.39) | (0.20) | (0.21) | (0.32) | (0.26) | (0.13) | (0.42) | (0.19) | (0.23) | |
| Observations | 82 | 82 | 82 | 82 | 82 | 87 | 87 | 87 | 82 |
| Adjusted R^2 | 0.612 | 0.655 | 0.638 | 0.494 | 0.458 | 0.555 | 0.088 | 0.576 | 0.231 |
Notes: cns is construction, edu is education and health services, fin is financial activities, Inf is information, lsr is leisure and hospitality, mfg is manufacturing, prf is professional and business services, srv is services, and trd is trade, transportation, and utilities.
Note that in the table above we list sectors from highest to lowest wage growth. The strength of the COVID dummy (measured by a higher coefficient associated with it in our regression) is linked to the sectors with the highest pandemic wage pressures. The highest value for the COVID dummy is for the leisure and hospitality sector, followed by trade, transportation, and utilities, and then the information sector. The first two are indeed the sectors in which nominal wage increases have been the highest.
What determines the heterogeneity of the COVID dummy across sectors? Here we suggest that one possible factor is the intensity of physical contacts in the job. Indeed, the estimated coefficient of the COVID dummy from the regression could be related with the average physical proximity index for sectors used by Famiglietti, Leibovici, and Santacreu (2020) indicating that wage increases are more concentrated in physical contact intensive sectors.
Sectors with Higher Wage Inflation during the Pandemic Have Higher Physical Proximity
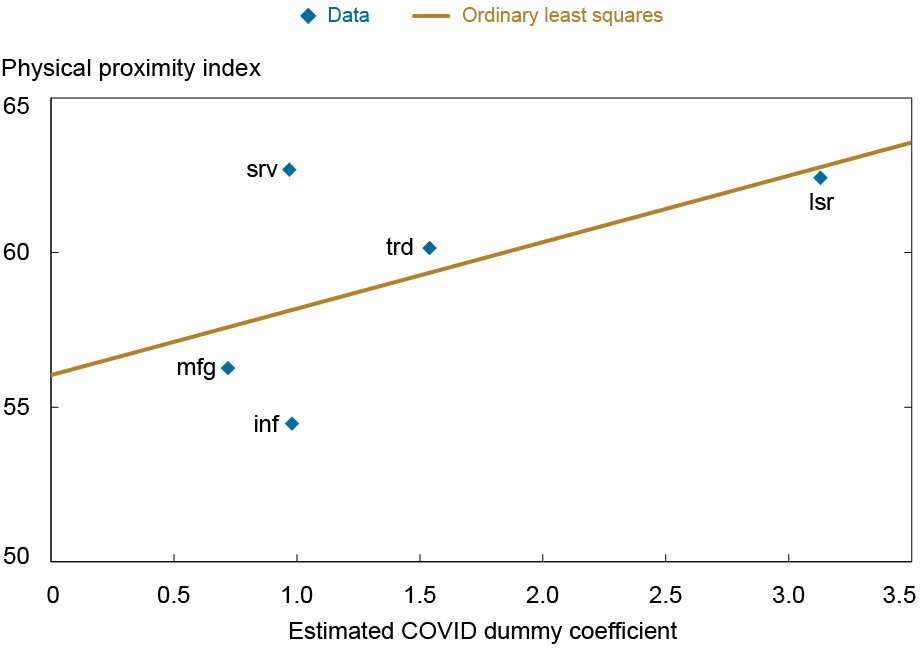
Notes: inf is information, lsr is leisure and hospitality, mfg is manufacturing, srv is services, and trd is trade, transportation, and utilities.
In the chart above, restricting our analysis to the sectors in which the COVID dummy is significant at the 1 percent level, we find that the sectors with higher physical contact in the workplace have seen higher wage increases during the pandemic controlling for the sectoral labor tightness.
A Labor Supply Story
Although labor market indicators point at a tight labor market, employment in the different sectors is still below the pre-pandemic trend. Interestingly, the leisure and hospitality sector has the highest wage pressures as well as the biggest gap in terms of employment level in thousands relative to the pre-pandemic trend.
We explore the sectoral wage heterogeneity further by documenting what percent of the sectoral employment has recovered relative to the pre-pandemic trend as of June 2022. Values below 100 imply that employment has not yet reached the pre-pandemic trend level and those above 100 imply that employment has recovered past the pre-pandemic trend level. A value of 100 means that actual employment is the same as the implied pre-pandemic trend. Indeed, only employment in the information sector has recovered above the pre-pandemic trend. We relate this measure with sectoral wage inflation in the scatter plot below.
Sectors with Higher Wage Inflation Also Have the Biggest Gap in Employment Recovery
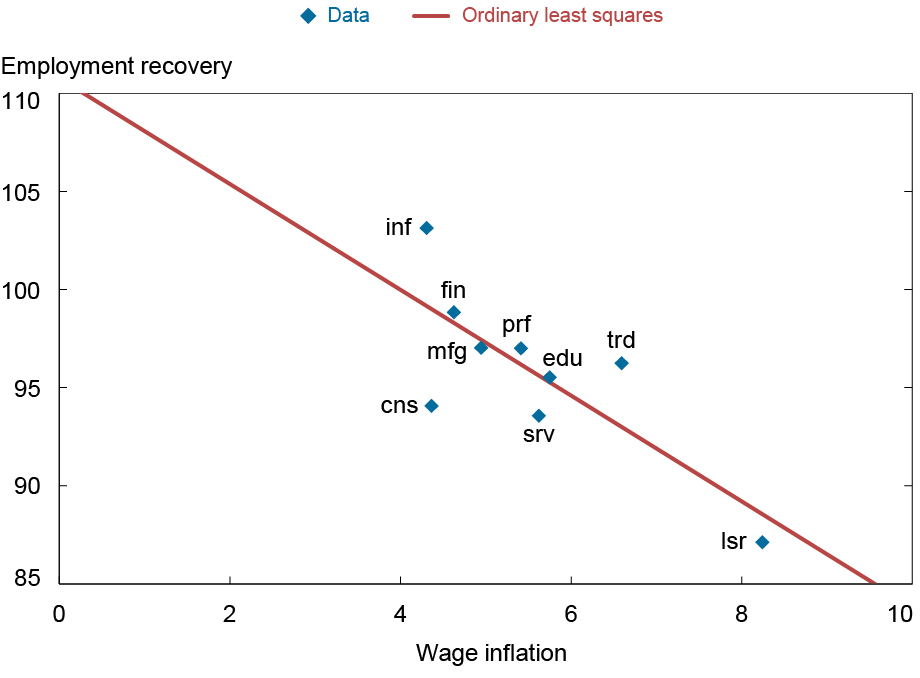
Notes: cns is construction, edu is education and health services, fin is financial activities, Inf is information, lsr is leisure and hospitality, mfg is manufacturing, prf is professional and business services, srv is services, and trd is trade, transportation, and utilities.
While sectoral labor markets appear extremely tight, there is a significant gap in terms of employment in the sectors with the highest wage pressures. One possible interpretation of the sectoral gaps in employment is that workers are not willing to reenter the labor market especially in specific sectors where employees work in close contact with others and are more exposed to COVID.
Conclusions
We look at the status of labor market conditions from a sectoral point of view. While labor market indicators point at tight sectoral labor markets, the employment level in almost all the sectors is still below the pre-pandemic trend. The heterogeneity at the sectoral level in terms of wage growth, labor market tightness and employment level suggest that the recent acceleration in nominal wage is associated with pandemic specific factors. Our analysis suggests that the rebalancing of the labor market could be restored from the supply side as employment return towards pre-pandemic levels rather than the demand side by reducing the number of vacancies.

Gianluca Benigno is the head of International Studies in the Federal Reserve Bank of New York’s Research and Statistics Group.
Serra Pelin is a former senior research analyst in the Federal Reserve Bank of New York’s Research and Statistics Group
How to cite this post:
Gianluca Benigno and Serra Pelin, “Pandemic Wage Pressures,” Federal Reserve Bank of New York Liberty Street Economics, August 4, 2022, https://libertystreeteconomics.newyorkfed.org/2022/08/pandemic-wage-pressures/
BibTeX: View |
Disclaimer
The views expressed in this post are those of the author(s) and do not necessarily reflect the position of the Federal Reserve Bank of New York or the Federal Reserve System. Any errors or omissions are the responsibility of the author(s).
 RSS Feed
 Follow Liberty Street Economics