


Total household debt increased by $312 billion during the second quarter of 2022, and balances are now more than $2 trillion higher than they were in the fourth quarter of 2019, just before the COVID-19 pandemic recession, according to the Quarterly Report on Household Debt and Credit from the New York Fed’s Center for Microeconomic Data. All debt types saw sizable increases, with the exception of student loans. Mortgage balances were the biggest driver of the overall increase, climbing $207 billion since the first quarter of 2022. Credit card balances saw a $46 billion increase since the previous quarter, reflecting rises in nominal consumption and an increased number of open credit card accounts. Auto loan balances rose by $33 billion. This analysis and the Quarterly Report on Household Debt and Credit use the New York Fed Consumer Credit Panel, based on credit data from Equifax.
In part, the growth in each debt type reflects increased borrowing due to higher prices. Prices for both homes and motor vehicles have been rising, and the borrowing amounts have risen in tandem—in fact, the average dollar amount for new purchase originations of both autos and homes is up 36 percent since 2019. Purchase mortgage origination volume is up 7 percent in the second quarter, driven primarily by increased borrowing amounts. (Note that refinances are down 34 percent since the first quarter of 2022, a continuation of the trend we wrote about in May). As we reported earlier this year (and has been widely covered elsewhere), increases in car prices are also pushing up auto loan origination volumes. Notably, these increases are seen across the board—even for borrowers with subprime credit scores.
The effects of inflation are also visible in credit card balances. The $46 billion increase in credit card balances this quarter was among the largest seen in our data since 1999, at least partly reflecting inflation on consumer goods and services purchased using credit cards. Americans are borrowing more, but a big part of the increased borrowing is attributable to higher prices.
Although debt balances are growing rapidly, households in general have weathered the pandemic remarkably well, due in no small part to the expansive programs put in place to support them. Further, household debt is held overwhelmingly by higher-score borrowers, even more so now than it has been in the history of our data. Mortgages represent the largest household debt product, and their balances dominate the overall total. Since the financial crisis, mortgage underwriting has been tight, and the vast majority of mortgage balances are now held by borrowers with high credit scores, as shown in the left panel of the chart below. Still, if we exclude mortgages and look at all other types of debt, we see a shifting of balances toward higher credit score borrowers, albeit a less dramatic one, as shown in the right panel.
Balances Outstanding by Credit Score Are Increasingly Prime
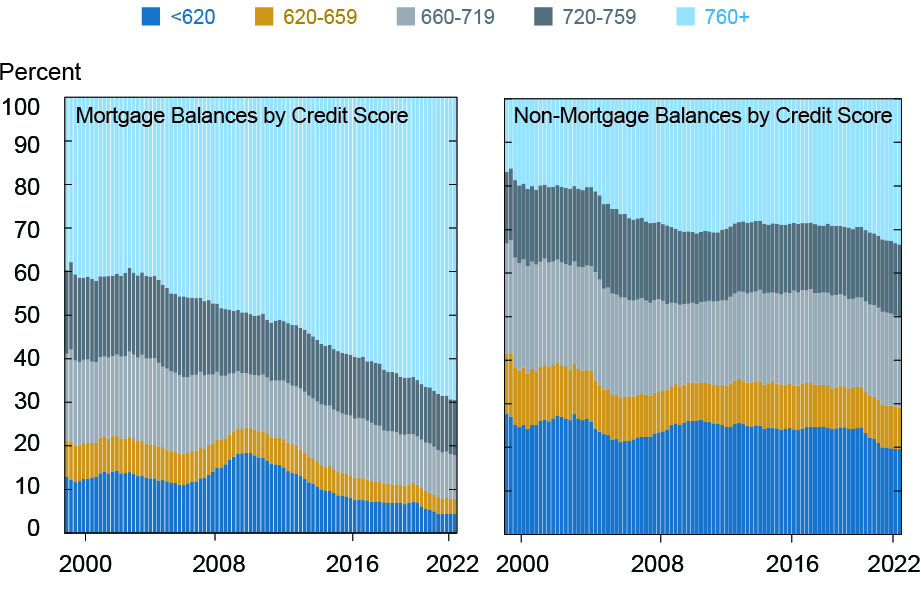
Notes: Charts show the percentage of total balances outstanding. Credit score is Equifax Risk Score 3.0.
With the supportive policies of the pandemic mostly in the past, there are pockets of borrowers who are beginning to show some distress on their debt. Upticks in delinquency transition rates are visible in aggregate, as seen on pages 13 and 14 of the Quarterly Report on Household Debt and Credit. When we break these out by neighborhood income using borrower zip code, we observe that the delinquency transition rates for credit cards and auto loans are creeping up, particularly in lower-income areas, as shown in the charts below. These rates appear to be resuming a trend in rising delinquencies among subprime borrowers that we had begun to see in 2019 in auto loans, where subprime borrowers retain a nontrivial share of the outstanding balances. We wrote about this topic even before the pandemic, and the return to these trends after two years of exceptionally low delinquency is noteworthy.
Delinquency Rates Creep Up—Especially in Lower Income Areas
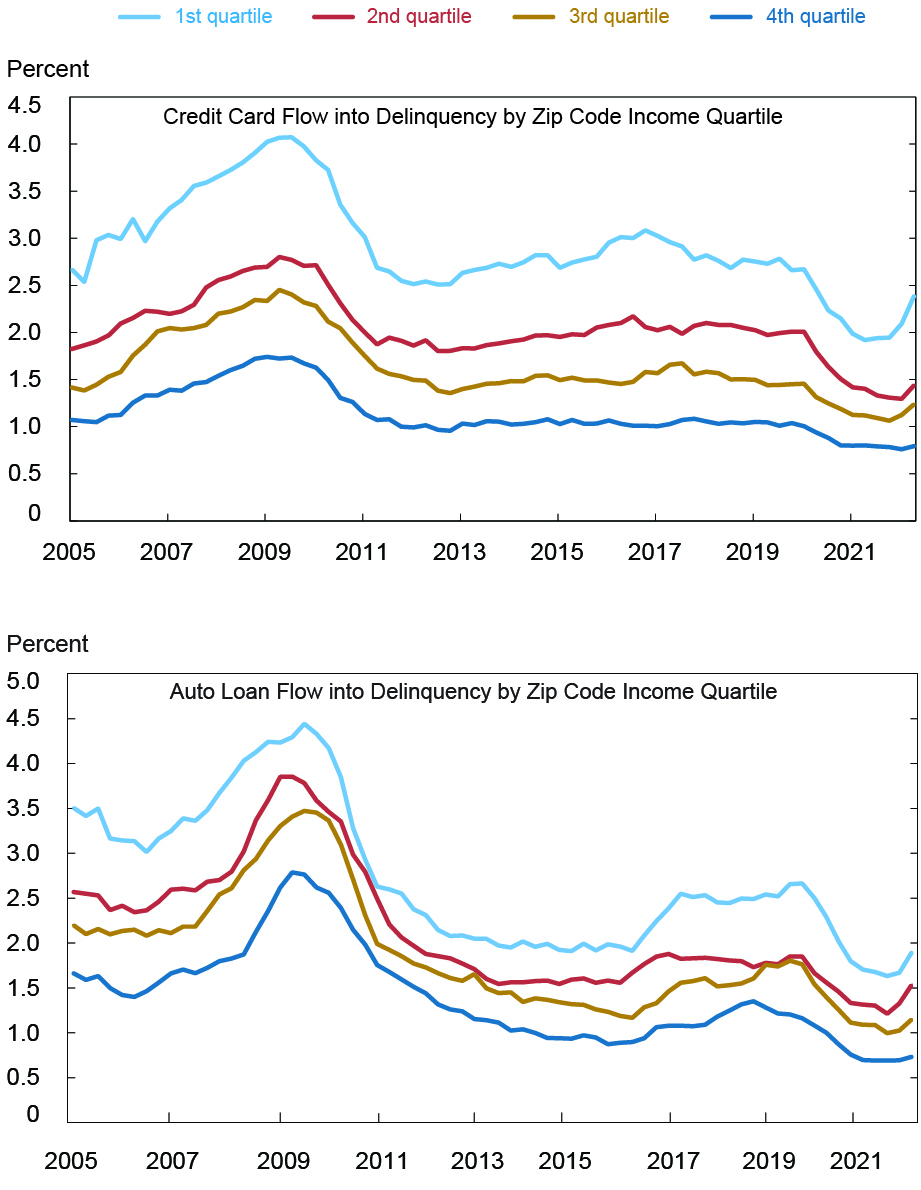
Note: Charts show the percentage of balances transitioning into delinquency by zip code income quartile, smoothed as a four-quarter moving average.
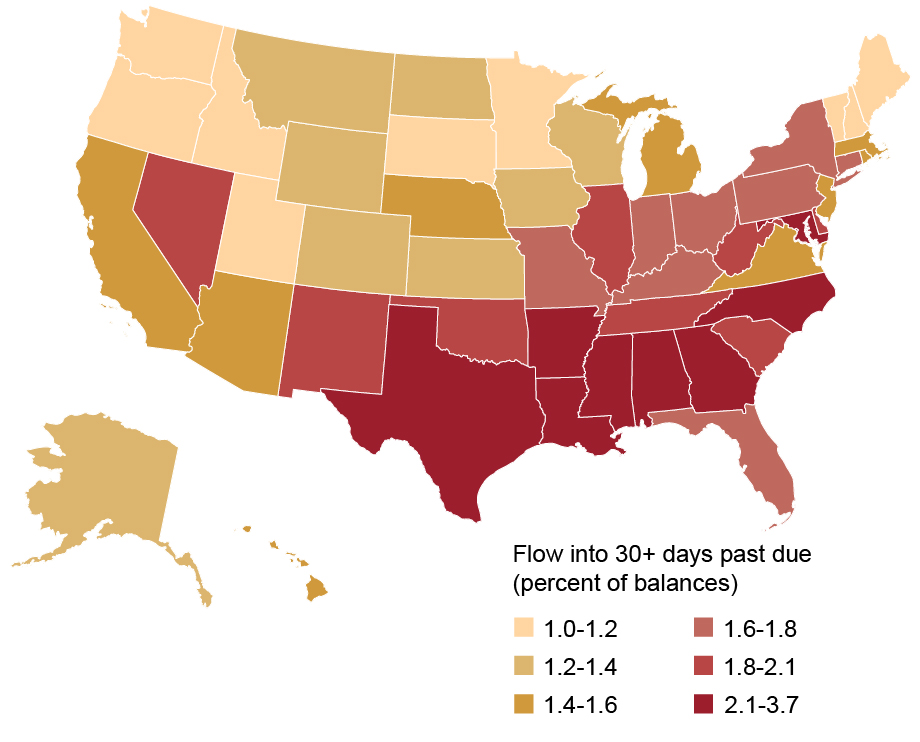
The map below depicts the current share of auto loan balances 30+ days past due, by state. There is considerable variation in the delinquency rates by state, mostly reflecting differences in borrower composition and in local economic conditions. Notably, a map of the delinquency transition rates from the fourth quarter of 2019 would yield a nearly identical picture: the rankings of the states in this map are hardly changed from their ranks before the pandemic.
Auto Loan Delinquency Concentrated in the South
While overall credit profiles thus far remain resilient, the recent uptick in delinquencies in some households suggests that many communities or individuals are experiencing the economy differently. We are seeing a hint of the return of the delinquency and hardship patterns we saw prior to the pandemic. Despite that, many are experiencing a strong economy and robust consumer demand, but the impacts of inflation are apparent in high volumes of borrowing. We will monitor these areas going forward for evidence of growing stress due to inflation and higher borrowing costs.

Andrew F. Haughwout is director of Household and Public Policy Research in the Federal Reserve Bank of New York’s Research and Statistics Group.

Donghoon Lee is an economic research advisor in Consumer Behavior Studies in the Federal Reserve Bank of New York’s Research and Statistics Group.

Daniel Mangrum is a research economist in Equitable Growth Studies in the Federal Reserve Bank of New York’s Research and Statistics Group.

Joelle Scally is a senior data strategist in the Bank’s Research and Statistics Group.

Wilbert van der Klaauw is an economic research advisor on Household and Public Policy Research in the Federal Reserve Bank of New York’s Research and Statistics Group.
How to cite this post:
Andrew Haughwout, Donghoon Lee, Daniel Mangrum, Joelle Scally, and Wilbert van der Klaauw, “Historically Low Delinquency Rates Coming to an End,” Federal Reserve Bank of New York Liberty Street Economics, August 2, 2022, https://libertystreeteconomics.newyorkfed.org/2022/08/historically-low-delinquency-rates-coming-to-an-end/
BibTeX: View |
Disclaimer
The views expressed in this post are those of the author(s) and do not necessarily reflect the position of the Federal Reserve Bank of New York or the Federal Reserve System. Any errors or omissions are the responsibility of the author(s).
 RSS Feed
 Follow Liberty Street Economics
I believe that the Federal tightening cycle could bring another credit crisis. Once loans slow down and spending drops, then economic numbers will follow. Hopefully it will curb inflation though
Tough times ahead