


Total household debt increased substantially during the second year of the COVID-19 pandemic, with a $1.02 trillion increase in aggregate debt balances, according to the Quarterly Report on Household Debt and Credit for the fourth quarter of 2021 from the New York Fed’s Center for Microeconomic Data. The yearly increase was the largest seen since 2007 in nominal terms and was boosted by particularly robust growth in mortgage balances, which grew by nearly $900 billion through 2021. Credit card balances, which have followed an unusual path during the pandemic, saw a large seasonal increase in the fourth quarter but remain well below pre-pandemic levels. And student loan balances increased only modestly through 2021 due to lower enrollment and also due to administrative forbearance on federal student loans—the smallest annual increase we’ve seen since 2004. Outstanding auto loan balances grew in 2021 by $84 billion. The $734 billion in newly opened auto loans through the year was the largest volume we’ve seen in our data.
A closer look reveals that the large origination volumes are, in part, reflecting the unprecedented sharp increases in the prices of homes and cars through 2021. Here, we will take a closer look at newly opened auto loans, and how the price increases in autos have been borne by different groups. The analysis here uses the New York Fed’s Consumer Credit Panel (CCP), which is based on anonymized Equifax credit data and also the source for the Quarterly Report.
A Closer Examination of the Auto Loan Market
The chart below, directly from our Quarterly Report, depicts the newly originated auto loans, broken out by the credit score of the borrower at origination. There was a notably high volume of auto loan originations in 2021, even measured against the record levels seen during the years prior to the pandemic. In examining the composition of the bars by credit score, we see that the originations have only changed slightly in quality since the fourth quarter of 2019, with a decline of just 6 points in the median credit score among newly opened auto loans. Note that these volumes include loans and leases for both new and used vehicles.
Auto Loan Originations Pick Up in 2021
Originations by credit score band

Source: New York Fed Consumer Credit Panel / Equifax.
The aggregate volume comprises the two key components—the number of new loans originated, and the average amount per loan that people are borrowing. These two margins combine to create the aggregate, but have been following different paths during the past year. The chart below shows the average origination balance, and number, of newly opened loans. The number of newly opened loans, in gold, had a dip during mid-2020 when many dealerships closed during the peak of the pandemic. There did not appear to be a pent-up-demand driven spike when dealerships reopened—only a return to roughly the origination counts that had been seen between 2015-19. By contrast, the red line shows the average nominal dollar amount financed by car buyers. The red line shows a notable increase in the amount borrowed during the pandemic, commensurate with the sharp increases in the prices for new and used vehicles. As car prices have soared, buyers have borrowed more to finance the additional cost. The blue line depicts the average origination amount deflated using the CPI for new and used vehicles. Controlling for vehicle price inflation, the average origination amount has been relatively flat. The large gap between the real and nominal borrowing series is another indicator of the sharply rising price of cars.
Origination Amounts Are Revving Up with Vehicle Prices
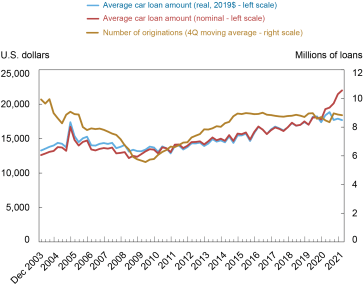
Sources: New York Fed Consumer Credit Panel / Equifax; Bureau of Labor Statistics.
The impact of increasing vehicle prices that we see overall appears to have affected all types of borrowers. In the chart below, we show the differences relative to 2019 in the average balances of newly originated borrowers by credit score—these balances increased by approximately 20 percent for borrowers in all credit score groups. A similar story can be told for other dimensions, such as by age and by the neighborhood incomes of the borrowers—the new loan balances reflect that the price increases in new and used cars were not easily avoidable by different types of borrowers. A variation exists, however, in the number of vehicles financed: subprime borrowers financed 16 percent fewer vehicles in 2021 compared to 2019, while the number of new originations compared to 2019 overall declined by only 1 percent, as the higher score groups all originated slightly more auto loans.
Prime and Subprime Loans Grew Larger in 2021
Average origination amounts by credit score group
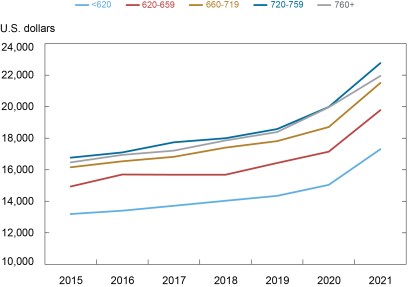
Source: New York Fed Consumer Credit Panel / Equifax.
For the borrowers who purchased cars in 2021—at higher prices and larger amounts of financing—these loans are associated with higher payments, although the lower interest rates available on auto loans through the pandemic helped to soften these somewhat. Average balances grew by approximately 20 percent, and the median monthly payment on newly opened loans was 8 percent higher in 2021 compared to 2020, to $418.
The chart below, from our Quarterly Report, shows a visible uptick in the transition rates to 90 or more days past due among borrowers under 30 years old. This uptick suggests that, although these delinquency rates remain quite low, there may be challenges brewing for some younger borrowers. Overall, the loans originated during 2021 are performing well, compared to other recent vintages. Personal income has grown during the past year (and has been supplemented since the pandemic’s start by stimulus programs including transfer payments to households), and this helped borrowers make their payments on time. However, there may be some risk for lower income or lower credit score borrowers, particularly as used car purchases may be more prevalent in this group. Used cars have seen steeper increases in prices than new cars; the CPI for used cars and trucks has increased more than 50 percent since December 2020; in comparison, the CPI for new cars is up just under 14 percent. Although it is not uncommon for auto loans to be underwater, this is especially a risk for these borrowers who would find themselves owing significantly more on their cars than they are worth if and when used car prices normalize, particularly as the increase in used motor vehicle prices may prove unsustainable.
Delinquency Transition Rates Tick Up for Youngest Borrowers
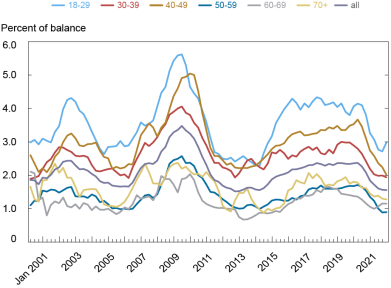
Source: New York Fed Consumer Credit Panel / Equifax.
Because vehicles are occasional large purchases rather than frequent small purchases (like apparel or food), the sharp spike in vehicle prices may not affect some households at all, but the impact will be real for households that were not able to delay these car purchases and will find themselves with debt incurred at the elevated prices. For the households that have purchased cars during this unusual year, their elevated payments will remain a larger monthly obligation for some time to come.
Chart data ![]()

Andrew Haughwout is a senior vice president in the Federal Reserve Bank of New York’s Research and Statistics Group.

Donghoon Lee is an officer in the Bank’s Research and Statistics Group.

Daniel Mangrum is an economist in the Bank’s Research and Statistics Group.


Wilbert van der Klaauw is a senior vice president in the Bank’s Research and Statistics Group.
Disclaimer
The views expressed in this post are those of the authors and do not necessarily reflect the position of the Federal Reserve Bank of New York or the Federal Reserve System. Any errors or omissions are the responsibility of the authors.
 RSS Feed
 Follow Liberty Street Economics