


Total household debt balances continued their upward climb in the first quarter of 2022 with an increase of $266 billion; this rise was primarily driven by a $250 billion increase in mortgage balances, according to the latest Quarterly Report on Household Debt and Creditfrom the New York Fed’s Center for Microeconomic Data. Mortgages, historically the largest form of household debt, now comprise 71 percent of outstanding household debt balances, up from 69 percent in the fourth quarter of 2019. Driving the increase in mortgage balances has been a high volume of new mortgage originations, which we define as mortgages that newly appear on credit reports and includes both purchase and refinance mortgages. There has been $8.4 trillion in new mortgage debt originated in the last two years, as a steady upward climb in purchase mortgages was accompanied by an historically large boom in mortgage refinances. Here, we take a close look at these refinances, and how they compare to recent purchase mortgages, using our Consumer Credit Panel, which is based on anonymized credit reports from Equifax.
A Slowdown in Originations with a Sharp Drop in Refinancing
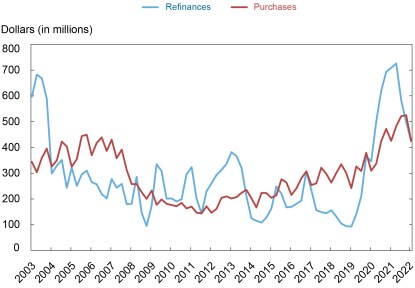
Mortgage originations were at $859 billion in the first quarter of 2022, a decline from the previous quarter and notably down from the high of $1.2 trillion reached in the second quarter of 2021. However, purchase and refinance mortgages have followed different trends through the last two business cycles. In the chart below, we split refinance and purchase originations into their respective time-series. Mortgage refinances surged in the last two years, as many homeowners were able to take advantage of historically low interest rates. Purchase originations, mortgages associated with the new purchase of a property, increased at a steady pace. The beginning of 2022 shows a modest decline in purchase originations and a relatively sharp drop in refinances.
Purchase and Refinance Originations Decline in Q1:2022
Mortgage origination volume
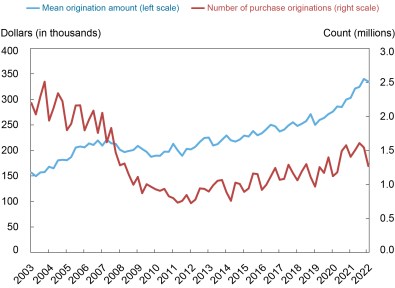
Next, we take a closer look at originations broken out into their two components – the number of mortgages originated and the average amount of the newly opened mortgages. We do this first, in the chart below, with purchase originations. The red line, which indicates the number of newly opened purchase mortgage accounts – has increased more moderately in the last two years. In fact, the number of new loans originated during the past two years was markedly lower than the numbers of new mortgages seen during any two-year period between 2000-06. The first quarter of 2022 saw a decline even accounting for seasonal patterns in purchases originations, as the volume was lower than in the first quarter of 2021. The blue line depicts the average dollar amount of newly opened mortgages. As house prices have increased steeply during the past two years, this has increased as well, as homebuyers pay more – and borrow more – to finance the purchase of their homes. One component of home purchases not included here are those made with all cash – which according to a recent report from the National Association of Realtors are increasing in prevalence and comprised 28 percent of purchases of existing homes in March.
Number of Purchase Originations Shows Small Quarterly Decline
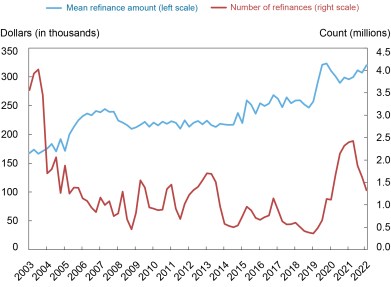
Next, we decompose the volume of refinance originations in the same manner. The count of refinance originations is shown by the red line. The refinance boom during 2020 and 2021 was substantial, but at its peak was still only half the number of loans being refinanced per quarter during the historically large 2003 mortgage refinance boom. The red line suggests that the recent refinancing boom is effectively over, given the recent increases in mortgage rates and the fact that many borrowers who would benefit from a refinance have already done so. The blue line, which charts the average dollar amount borrowed on newly refinanced mortgages, has also increased at a steep rate in the past two years. This rise is consistent with the impact of rising home prices on equity.
The Refinance Boom Winds Down as Mortgage Rates Begin to Pick Up
Comparing Today’s Mortgage Market to 2007
The memory of the last housing boom and bust remains a troubling reminder for many Americans as home prices soar. The collapse of the housing market left significant financial scars on households–millions of whom were left owing more on their properties than they were worth, and with more than 10 million Americans experiencing a foreclosure. But there are many differences in the mortgage market now compared to 2007. First, unlike the 2003-06 housing boom, mortgage debt has been rising much more slowly than home values. As above, the number of mortgages originated remains far lower than in the early part of our time series, which would be even lower if population adjusted. And finally – loans being originated now are going to higher credit score borrowers; more than 70 percent of mortgages originated in the last two years were to borrowers with credit scores over 760, compared to 38 percent between 2003-06. Subprime mortgages remain effectively non-existent. With house prices continuing to rise and housing affordability a growing concern, there remain risks, and we will continue to monitor the evolution of the housing and mortgage market.


Andrew Haughwout is a director in the Federal Reserve Bank of New York’s Research and Statistics Group.

Donghoon Lee is an economic research advisor in the Bank’s Research and Statistics Group.

Daniel Mangrum is a research economist in the Bank’s Research and Statistics Group.

Joelle Scally is a senior data strategist in the Bank’s Research and Statistics Group.

Wilbert van der Klaauw is an economic research advisor in the Bank’s Research and Statistics Group. He is also the director of the Center for Microeconomic Data.
Disclaimer
The views expressed in this post are those of the authors and do not necessarily reflect the position of the Federal Reserve Bank of New York or the Federal Reserve System. Any errors or omissions are the responsibility of the authors.
 RSS Feed
 Follow Liberty Street Economics