


Tight inventories of homes for sale combined with strong demand pushed up national house prices by an eye-popping 19 percent, year over year, in January 2022. This surge in house prices created concerns that first-time buyers would increasingly be priced out of owning a home. However, using our Consumer Credit Panel, which is based on anonymized Equifax credit report data, we find that the share of purchase mortgages going to first-time buyers actually increased slightly from 2020 to 2021.
The housing market was very active last year. As shown below, new purchase mortgage volume increased for the tenth consecutive year since a low in 2011 following the housing bust. We classify a household as a first-time buyer (FTB) if there has never been a mortgage lien on their credit file prior to this purchase mortgage. This provides a more accurate measure of FTBs than the traditional measure, based on not owning a home in the past three years. The number of purchase mortgages originated by FTBs increased from 2.25 million in 2020 to 2.52 million in 2021—an 11.9 percent increase. In contrast, purchase mortgages originated by repeat buyers increased by a slower 7.5 percent—roughly half its 15 percent pace in 2020.
New Purchase Mortgage Volume Continues to Rise

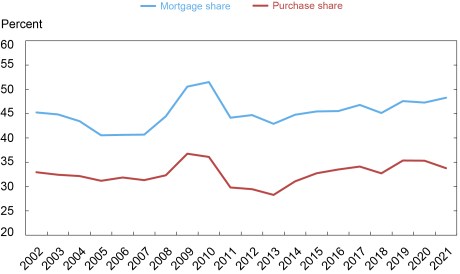
How did FTBs fare in 2021? As shown by the blue line in the chart below, despite the 19 percent increase in house prices nationally, the FTB share of purchase mortgages increased slightly to 48.3 percent as compared to 47.3 percent in 2020. Using our measure, the FTB share has been steadily rising over the last eight years and is moving closer to its maximum level over the past twenty years of 50.7 percent in 2010. When we divide housing markets by the extent of their house price increases over 2021, we did not find any relationship between the pace of house price increases and the change in the FTB share. Disaggregating by age, we found that the FTB share increased for all ten-year age groups up to age 59.
A broader measure of access to homeownership by FTBs is to look at FTBs as a share of all home purchases, not just those financed by a mortgage. Redfin calculates the percentage of home purchases that are made by all-cash buyers. These buyers include large institutional investors as well as individuals. According to Redfin’s data, cash purchases as a percentage of home purchases increased from 25.3 percent in 2020 to 30 percent in 2021. If we assume that all FTBs finance their purchases with a mortgage, then we can calculate the FTB share of all home purchases. As shown by the red line in the chart below, our broader measure of FTBs’ purchases as a share of all home purchases fell from 35.3 percent in 2020 to 33.8 percent in 2021.
First-Time Buyers’ Share of Mortgages and Home Purchases
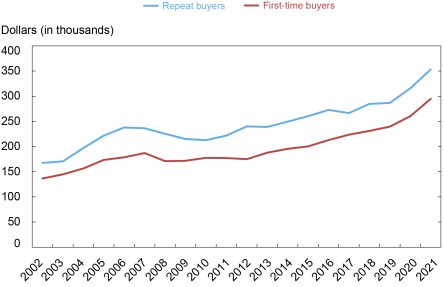
Given the strong increase in house prices, how did FTBs manage to maintain their share of purchase mortgages? As shown in the following chart, the surge in house prices in 2021 resulted in higher purchase mortgage balances for both first-time and repeat buyers. Mortgage balances increased by 13.3 percent for FTBs in 2021, exceeding the prior year’s increase of 8.6 percent.
Average Balance of Purchase Mortgage by Type of Buyer
What matters is how these higher mortgage balances translate into monthly payments for households. Freddie Mac reports that the average thirty-year FRM mortgage rate in 2021 was 2.96 percent, down modestly from a rate of 3.11 percent in 2020. This decline in the average mortgage rate was not enough to offset all of the higher mortgage balances for FTBs, resulting in the average monthly payment for FTBs increasing by 7.7 percent (from $1,594 per month in 2020 to $1,718 in 2021—an increase of slightly under $1,500 per year). These monthly payments include property taxes and/or homeowners insurance if they are escrowed. However, data from CoreLogic indicate that the average down payment percentage for FTBs rose from 8.5 percent in 2020 to 9.2 percent in 2021. If the decline in the FTB share of home purchases was due to growing affordability challenges, we might have expected the average down payment percentage to have been lower in 2021 than in 2020.
A possible alternative explanation is that the decline in FTBs’ share of home purchases may reflect FTBs being crowded out of the market as the purchase activity by all-cash buyers increased. If this took place, we cannot directly identify these households in our data. We do find that the average age of an FTB increased slightly, rising from 35.7 years in 2020 to 36.4 years in 2021. This might suggest that younger households found it relatively more difficult to compete in the tight housing market of 2021. However, the rise in the average age is well within the year-to-year variation we see in our data over the past decade. The growth in FTB purchase mortgages was also concentrated in conventional mortgages guaranteed by Fannie Mae and Freddie Mac, while the volume of FTB purchase mortgages guaranteed by the FHA/VA remained constant between 2020 and 2021. This could also indicate that the challenges in transitioning to homeownership in 2021 were more acute for households that need to make smaller down payments and therefore use FHA mortgages to finance their home purchase.
The housing market was on fire in 2021, with house prices rising 19 percent nationally. Despite this headwind, the FTB share of purchase mortgages grew slightly, continuing a trend underway since 2013. However, when we factor in all-cash purchases, we find that the FTB share of home purchases declined by 1.5 percentage points. This suggests that the influx of all-cash buyers in 2021 may have crowded out some FTBs.

Donghoon Lee is an economic research advisor in the Bank’s Research and Statistics Group.
Joseph Tracy is an executive vice president and senior advisor to the president at the Federal Reserve Bank of Dallas.
How to cite this post:
Donghoon Lee and Joseph Tracy, “First-Time Buyers Were Undeterred by Rapid Home Price Appreciation in 2021,” Federal Reserve Bank of New York Liberty Street Economics, May 12, 2022, https://libertystreeteconomics.newyorkfed.org/2022/05/first-time-buyers-were-undeterred-by-rapid-home-price-appreciation-in-2021/.
Disclaimer
The views expressed in this post are those of the authors and do not necessarily reflect the position of the Federal Reserve Bank of New York or the Federal Reserve System. Any errors or omissions are the responsibility of the authors.
 RSS Feed
 Follow Liberty Street Economics