


Total household debt increased modestly, by $32 billion, in the fourth quarter of 2018, according to the latest Quarterly Report on Household Debt and Credit from the New York Fed’s Center for Microeconomic Data. Although household debt balances have been rising since mid-2013, their sluggish growth in the fourth quarter was mainly due to a flattening in the growth of mortgage balances. Auto loans, which have been climbing at a steady clip since 2011, increased by $9 billion, boosted by historically strong levels of newly originated loans. In fact, 2018 marked the highest level in the nineteen-year history of the loan origination data, with $584 billion in new auto loans and leases appearing on credit reports, up in nominal terms from 2017’s $569 billion. In this post, we take a closer look at the composition and performance of outstanding auto loan debt using the New York Fed’s Consumer Credit Panel (CCP), which is based on anonymized Equifax credit data and also the source for the Quarterly Report.
After years of growth among borrowers across the credit score spectrum, 2018’s strength in auto loans was primarily driven by those originated by the most creditworthy individuals, while originations to those with scores below 720 have leveled off, albeit at high volumes. The high volume of prime originations has caused a quality-shift in the outstanding pool of auto loans and, as of the fourth quarter of 2018, 30 percent of the $1.27 trillion in outstanding debt was originated to borrowers with credit scores over 760. Meanwhile, the share of total auto loans outstanding that was originated to subprime borrowers fell to 22 percent. In fact, these percentages would suggest that the overall auto loan stock is the highest quality that we have observed since our data began in 2000. However, with growth in auto loan participation, there are now more subprime auto loan borrowers than ever, and thus a larger group of borrowers at high risk of delinquency.
Loan Performance Sliding… But Slowly
The overall performance of auto loans has been slowly worsening, despite an increasing share of prime loans in the stock. The flow into serious delinquency (that is, the share of balances that were current or in early delinquency that became 90+ days delinquent) in the fourth quarter of 2018 crept up to 2.4 percent, substantially above the low of 1.5 percent seen in 2012.
In the chart below, we disaggregate the delinquency rate by the borrower’s credit score at origination. The relative performance between each credit score group stands out immediately; but the increase in delinquency is most obvious among the loans of the two groups of lower-score borrowers, shown by the blue and red lines in the chart below. Borrowers with credit scores less than 620 saw their transitions into delinquency exceed 8 percent in the fourth quarter (annualized as a moving sum), a development that is surprising during a strong economy and labor market. Meanwhile, the delinquency transitions among those with the highest credit scores have remained stable and very low. In aggregate, the increasing share of prime loans has partially offset the deteriorating performance of the subprime sector.

So who is originating and servicing the subprime debt? We have previously written on Liberty Street Economics about a breakout in our data set, from which we can infer whether a lender reports to the credit bureau as a bank/credit union or as an auto finance company, and have shown that the subprime market is dominated by auto finance reporters. This group of lenders also has persistently higher delinquency rates when compared with banks and credit unions, even after controlling for the borrowers’ credit scores.
Our colleagues at the Federal Reserve Bank of Philadelphia have some additional, loan-level data on auto loans which have enabled us to refine this breakout even more accurately, irrespective of how the lenders report to the credit bureaus. In the chart below, we show the outstanding balance for each lender type, the share owed by borrowers with subprime credit scores, as well as the share of each balance that is 90 or more days delinquent. Note that our data reflect who originates the loans, rather than who holds the debt, so loans that are securitized and sold may shift around.
The chart below shows that first, the largest share of auto loans is from banks, followed by credit unions. Debt issued by captives, which we classify as dealer-based loans that are associated with car manufacturers (such as Ford or Honda), is predominantly owed by prime borrowers and shows relatively strong performance. But auto finance companies are a different story—50 percent of outstanding loans from auto finance companies are to borrowers with credit scores less than 620. By comparison, only 14 percent of the $340 billion in outstanding auto loans owed to credit unions are associated with subprime borrowers. The performance of loans reflects these quality differences; 6.5 percent of auto finance loans are 90+ days past due, compared with only 0.7 percent of loans originated by credit unions.

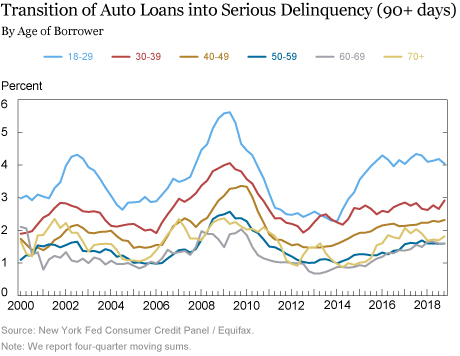
Repayment by Age
Shifting gears and looking at loan performance by the age of the borrowers, some interesting trends emerge. Age-based flows into serious delinquency for auto loans—in the Quarterly Report and reproduced in the chart below—depict a sharp worsening in the performance of the loans held by borrowers under 30 years old between 2014 and 2016. Meanwhile, delinquencies on auto loans held by borrowers over 30 have crept up slowly over time.
The surging auto loan industry has been on our radar for more than five years now. But, the level of loan originations has been commensurate with auto sales, with a steady 50 to 60 percent financing share of combined new and used vehicle purchases—a percentage surprisingly stable in our sample period, which suggests that car loans have been tracking the growth seen in motor vehicle sales. Although rising overall delinquency rates remain below 2010 peak levels, there were over 7 million Americans with auto loans that were 90 or more days delinquent at the end of 2018. That is more than a million more troubled borrowers than there had been at the end of 2010 when the overall delinquency rates were at their worst since auto loans are now more prevalent. The substantial and growing number of distressed borrowers suggests that not all Americans have benefitted from the strong labor market and warrants continued monitoring and analysis of this sector.
CMD Resources:
Chart data
Household Debt and Credit – Interactive Results
Quarterly Report 2018:Q4
Analysis: Auto Loans
Disclaimer
The views expressed in this post are those of the authors and do not necessarily reflect the position of the Federal Reserve Bank of New York or the Federal Reserve System. Any errors or omissions are the responsibility of the authors.
 Andrew F. Haughwout is a senior vice president in the Federal Reserve Bank of New York’s Research and Statistics Group.

Donghoon Lee is an officer in the Bank’s Research and Statistics Group.

Joelle Scally is a senior data strategist in the Bank’s Research and Statistics Group.

Wilbert van der Klaauw is a senior vice president in the Bank’s Research and Statistics Group.
How to cite this blog post:
Andrew F. Haughwout, Donghoon Lee, Joelle Scally, and Wilbert van der Klaauw, “Just Released: Auto Loans in High Gear,” Federal Reserve Bank of New York Liberty Street Economics (blog), February 12, 2019, https://libertystreeteconomics.newyorkfed.org/2019/02/just-released-auto-loans-in-high-gear.html.
 RSS Feed
 Follow Liberty Street Economics
Jen: Thanks for your question – this chart depicts the percent of balances that became 90 or more days past due during each quarter.
Is the first chart (Transition of Auto Loans in Serious Delinquency) reflecting % change of the # of auto loans or principal balances that are moved into delinquency? (i.e. count or $)
NOTE: In addition to the reader comments posted here, we received some off-line questions that we wanted to answer publicly: Q. Why are your balance-weighted 90+ days past due (dpd) rates higher than those widely circulated in the industry? A. The 90+ dpd rates widely circulated in the industry stop including debt in that rate once it has been “charged off” on the lenders’ books. Our rates are different because we use the credit bureau data to show the status of household debt from the borrower’s perspective. Thus our measure of 90+ dpd debt includes “severely derogatory “ balances that loan servicers continue to report to credit bureaus (even after that debt has been “charged off” on the lenders’ books). A large share of 90+ dpd auto debt is reported as severely derogatory, and much of it remains on borrowers’ credit reports for years after it becomes severely derogatory. This also helps to explain why the 90+ dpd delinquency rate (the stock of borrowers or debt that is 90+ dpd in this period) is higher than the delinquency transition rate (the share of debts or borrowers that was current or less than 90+ dpd last period, but is 90+ dpd this period).
Q. How do you get the 7 million delinquent borrowers figure? A. The first thing to note is that this figure refers to borrowers rather than debt. In the Quarterly Report we report balance-weighted delinquency rates, either as transition rates or stock delinquency rates. The blog focuses on people, and the percentage of people with a seriously delinquent or severely derogatory auto loan on their credit reports is higher (7.88% of the 89 million people with at least one auto loan in 2018Q4) than the percentage of debt that is 90+ dpd (4.47% in 2018Q4; the average borrower with a seriously delinquent or severely derogatory loan has less than the average amount of auto debt). The time series of borrowers with 90+ dpd auto debt is now attached to the post.
Carl: This is a very interesting question and may well explain some of the growth in the popularity of auto loans, but whether a driver intends on using the vehicle for rideshare apps is not denoted on credit reports and not something we are able to observe. It’s worth noting again that the loan origination volume we observe in our data has been commensurate with the sales volume of new and used autos.
Tom: It would depend on the how the lender classifies their lender type and the loan description they use to report to the credit bureau, but we don’t see this much detail, unfortunately.
I wonder if there is some Uber effect going on here – people who bought or leased a car in hopes of monetizing it only to end up making less than expected? Not sure the demo of the age cohort would support this. It’s been awhile since I’ve spoken with an Uber driver that was happy with their decision.
I would assume that motorcycle and RV loans are not included in the data. Correct?