


The U.S. labor force participation rate (LFPR) currently stands at 62.5 percent, 0.8 percentage point below its level in February 2020. This “participation gap” translates into 2.1 million workers out of the labor force. In this post, we evaluate three potential drivers of the gap: First, population aging from the baby boomers reaching retirement age puts downward pressure on participation. Second, the share of individuals of retirement age that are actually retired has risen since the onset of the COVID-19 pandemic. Finally, long COVID and disability more generally may induce more people to leave the labor force. We find that nearly all of the participation gap can be explained by population aging, which caused a significant rise in the number of retirements. Higher retirement rates compared to pre-COVID have had only a modest effect, while disability has virtually no effect.
The LFPR is defined as the ratio between workers in the labor force (either employed or unemployed) and the civilian, non-institutional population age 16 and older. As the chart below shows, the LFPR has been gradually declining since the early 2000s. It stayed relatively flat over the period 2014-19 and even slightly rose up to February 2020 as the strong labor market exerted a positive effect on labor supply. After a dramatic decline in the early months of the pandemic, participation has recovered gradually but remains significantly below its pre-COVID level—by 0.8 percentage point or 2.1 million workers as of February 2023. We examine potential drivers of the participation gap using the Current Population Survey (CPS), a monthly survey of about 60,000 households that is conducted by the Bureau of Labor Statistics (BLS).
The Labor Force Participation Rate (LFPR) Remains below its Pre-Pandemic Level

Notes: The chart shows the seasonally adjusted LFPR for the population aged 16+ years. The red dashed line illustrates the size of the shortfall between 2020:m2 and 2023:m2.
Population Aging
We first analyze population aging. As noted elsewhere, the panel chart below illustrates that as the baby boomer cohort has reached the retirement threshold, retirements have increased dramatically. The left panel shows the distribution of the U.S. population in 2009. Each gray bar shows the number of individuals of a given age in the U.S. population from U.S. Census data. The blue bars show the number of workers in that age group who are retired. We indicate the baby boomer cohort, that is, those workers born between 1946 and 1964, by the gray shaded area, and mark the retirement age of 65 years by the vertical red line. The left panel shows that in 2009 the baby boomers were just beginning to enter retirement.
Baby Boomer Retirements Have Increased Dramatically over Time
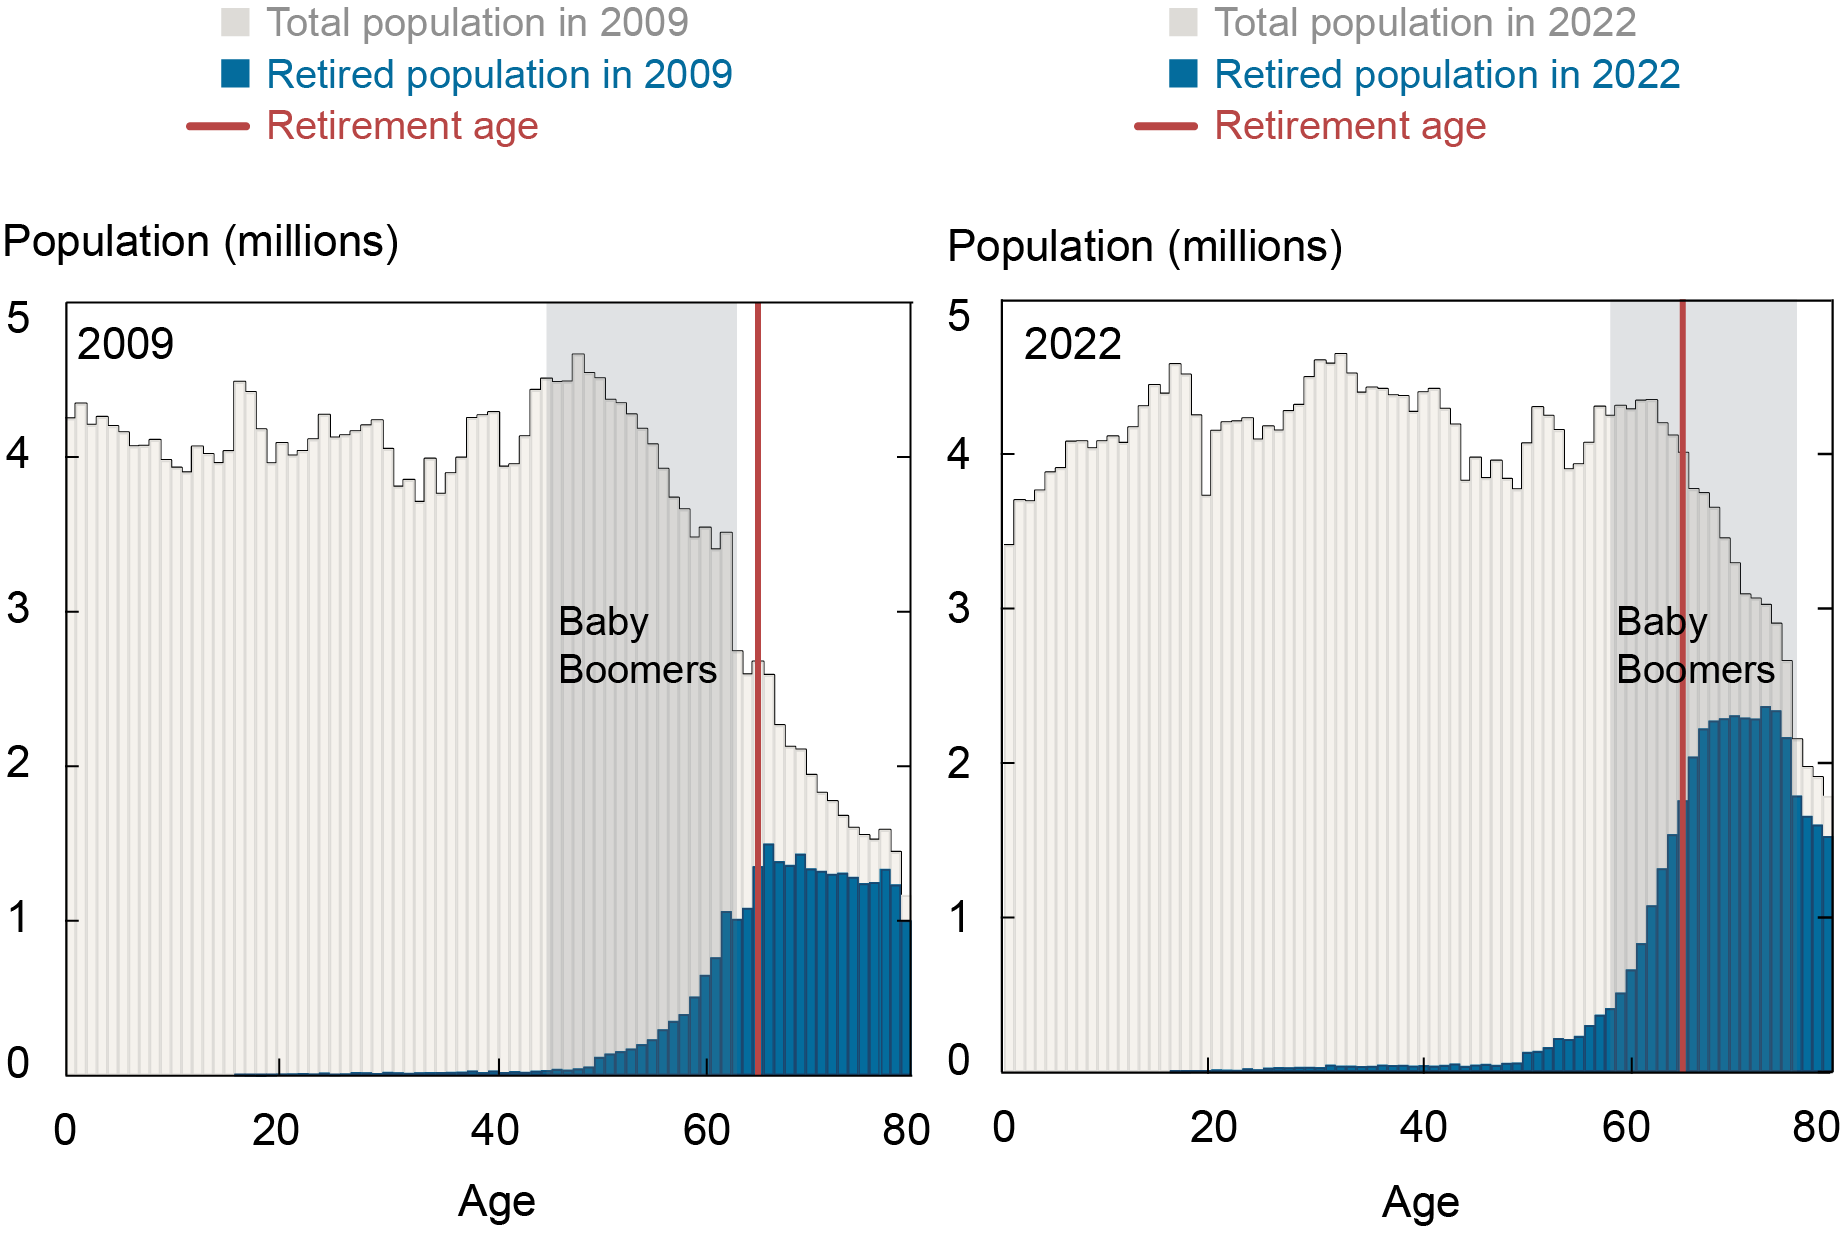
Notes: The gray bars show the U.S. population of a given age. The blue bars show the estimated number of retirees at each age, computed from the share of retired workers at each age from the CPS. The red vertical line indicates the normal retirement age of 65 years. The gray shaded area indicates the ages corresponding to the baby boomer cohort, that is, those individuals born between 1946 and 1964.
The right panel of the chart shows the same distribution in 2022. By 2022, a large share of the baby boomer generation had entered retirement, leading to a significant increase in the number of individuals retired, as indicated by the blue bars.
Retirements within Specific Age Groups Have Increased Compared to Pre-Pandemic Levels
We next examine retirements within age groups in more detail. The previous chart suggests that retirement shares by age group have risen only modestly, as shown by the height of the blue bars relative to the gray bars. To substantiate this point, we break the population into groups of individuals aged 60-69, 70-79, and over 79. We focus on individuals aged 60 and older since these account for more than 90 percent of all retirees in the United States. For those aged 60-69, the retirement share has risen from an average of 39.7 percent in 2018-19 to 40.0 percent over the second half of 2022. The retirement share for those aged 70-79 has increased from 77.5 percent in 2018-19 to 78.8 percent in the more recent period. Finally, among those over 79, the retirement share has gone up from 88.5 percent to 90.5 percent. Here we consider the average over 2018-19 as our pre-pandemic reference point to remove shorter-term movements in the retirement shares.
How does this change in retirement behavior affect overall retirements? The share of retired workers in the U.S. population has risen substantially, from an average of 18 percent in 2018-19 to nearly 20 percent at the end of 2022. However, once we control for the overall aging of the population, the changes in the age-specific retirement shares reported above imply an increase in the overall share of retirees in the population of only about 0.3 percentage point.
Share of Workers with Disability and Not in the Labor Force Has Actually Fallen
We finally analyze the effect of disability on the participation gap. To capture a broad notion of disability, we focus on a set of six questions in the CPS that ask respondents whether because of a physical, mental, or emotional condition they have serious difficulty concentrating, remembering, or making decisions.
We start by considering the number of disabled individuals in the labor force as a share of the total population. The share of workers with disability (based on the above definition) rose from an average of 2.5 percent of the population in 2018-19 to about 2.9 percent in the last six months of 2022. While the rise in disability among workers in the labor force may have implications for the intensity of work effort, a recent study has found relatively little change in average hours worked by workers with disability. Therefore, there may be relatively little effect on the LFPR since these workers are still in the labor force. For this reason, we focus on the share of disabled individuals not in the labor force. This share has risen slightly, from about 9.2 percent in 2018-19 to 9.4 percent in the second half of 2022. Once we adjust for aging, we find that the share of disabled individuals not in the labor force has, in fact, marginally declined. This result arises because disability shares have slightly fallen for the older age groups.
Impact on Labor Force Participation
How have the three channels affected labor force participation? We first analyze the impact of population aging in isolation by constructing a counterfactual LFPR that keeps constant the share of the population in each age group at February 2020 levels. The gold line in the chart below shows this age-adjusted participation rate. Removing the effect of aging can explain the entire participation gap, lifting LFPR by 0.9 percentage point in February 2023. This big effect arises because the large baby boomer cohort is right at the retirement cutoff. As the chart above shows, the retirement share rises dramatically with age around the age of 65. Consequently, the aging of the baby boomers between 2020 and 2022 led to a significant rise in retirements, reducing participation.
Second, we analyze the effect of excess retirements on participation, in addition to the effect of aging. To do so, we analyze how the overall age-adjusted retirement share would change if we went back to the retirement shares in each age group of 2018-19. In other words, we ask what LFPR would prevail if retirement behavior went back to pre-COVID levels, controlling for aging. Since about half of new retirees in 2020-22 were already out of the labor force prior to retirement (for example, a stay-at-home partner who transitions into retirement), we multiply the effect of excess retirement by one half. The red line in the chart below shows that additionally removing excess retirements increases LFPR by a further 0.2 percentage point in February 2023. This effect is smaller than in a recent study that finds a 0.6 percentage point effect. The difference arises mainly because we assume that only half of all excess retirees could return to the labor force, since the rest were already out of the labor force prior to retirement.
Finally, the increase in disability has virtually no effect on the participation gap because, as discussed above, the increase is entirely accounted for by individuals that remain in the labor force. We do not separately plot this effect on the chart below. Overall, our results imply that undoing the effects of population aging and excess retirements would raise the LFPR by 1.1 percentage point from 62.5 percent to 63.6 percent, more than making up for the participation gap.
Participation Rate Is Higher after Adjusting for Aging and Excess Retirements
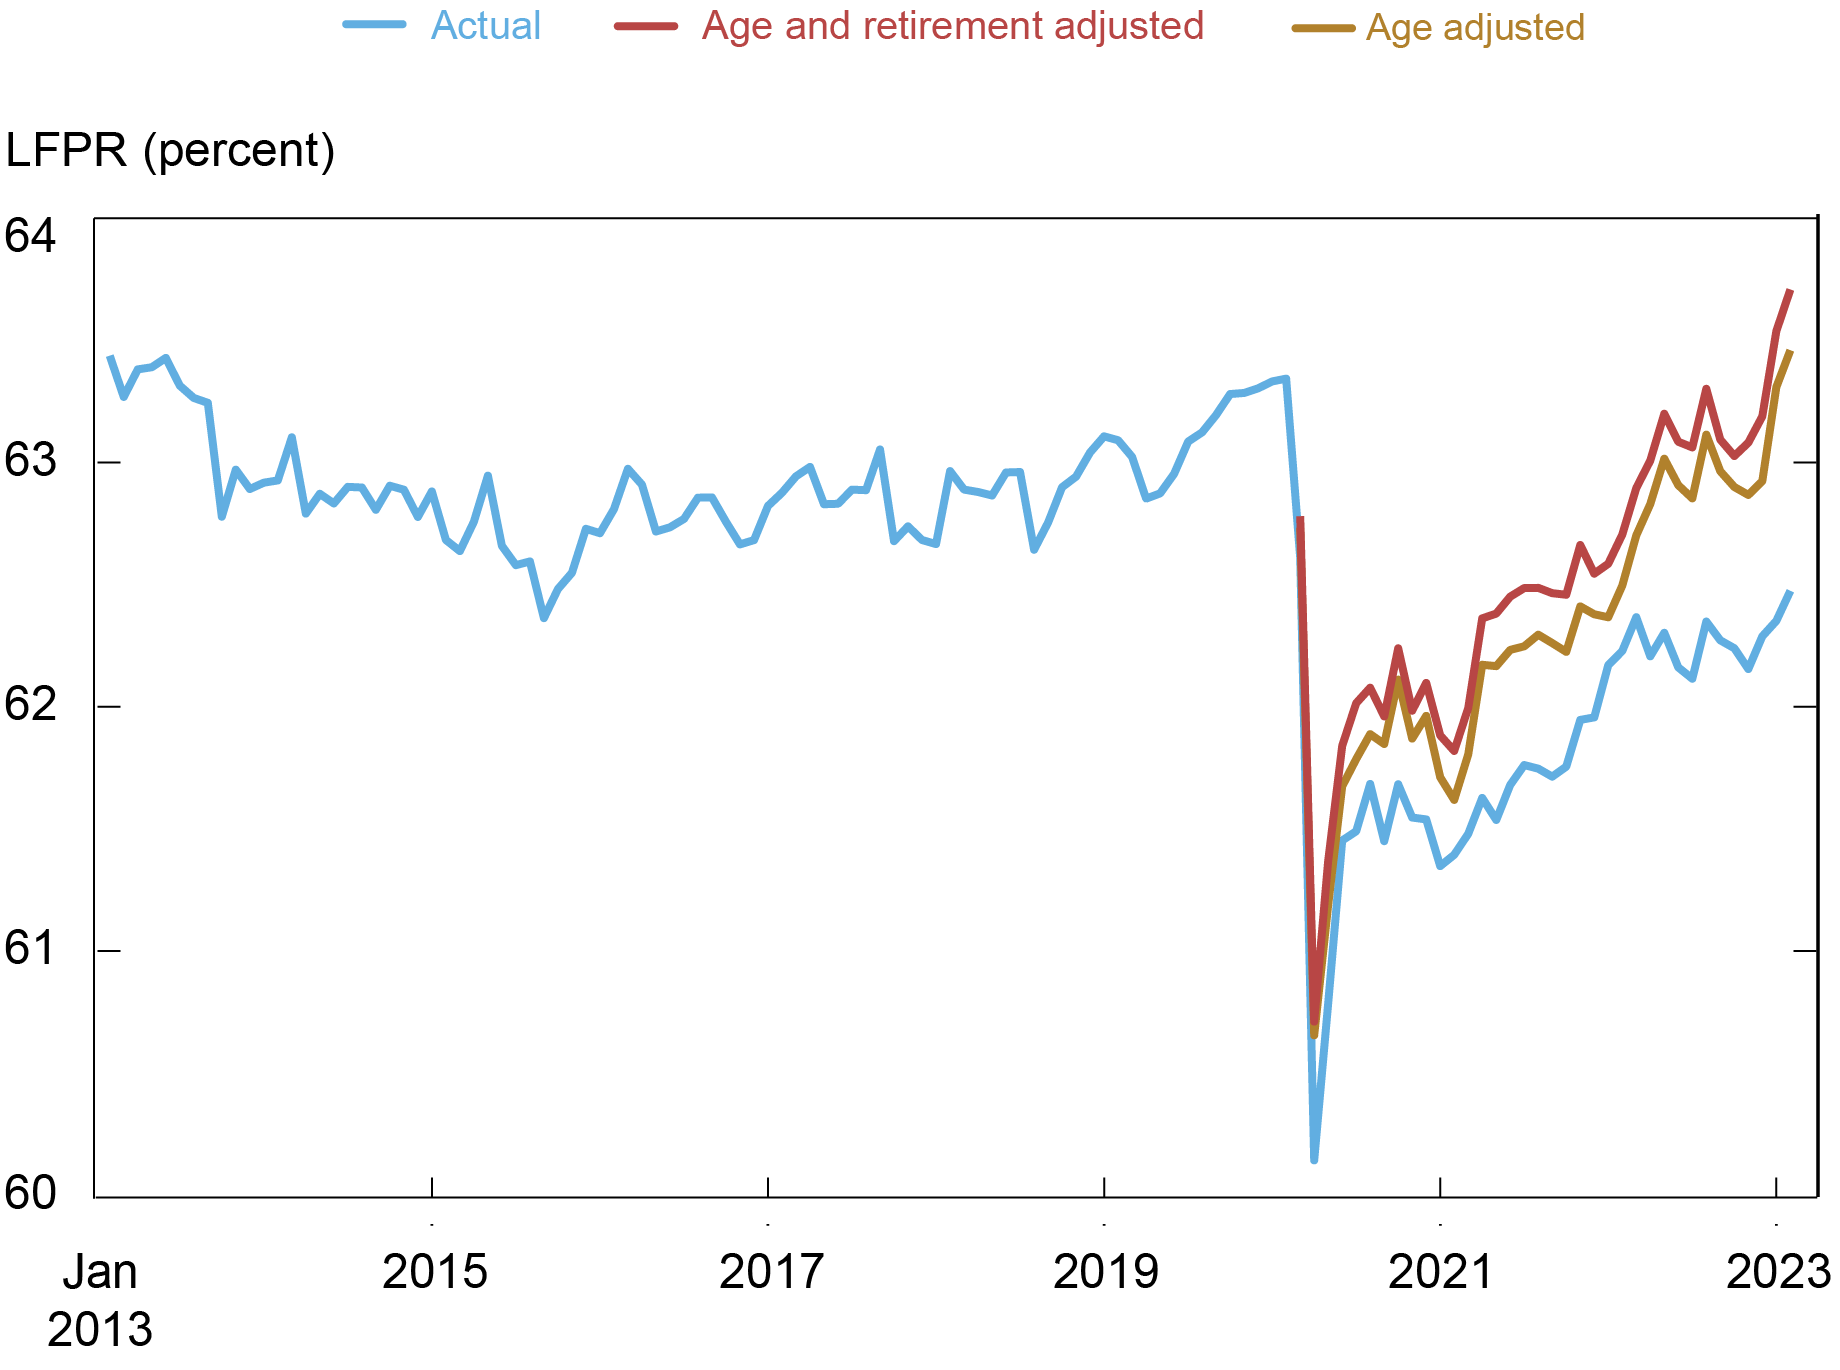
Notes: The blue line shows the headline labor force participation rate (LFPR) reported by the Bureau of Labor Statistics. The gold line is the counterfactual LFPR holding fixed the population age structure in February 2020. The red line further adds the surplus of retired workers in the recent period compared to 2018-19, at the fixed age structure of February 2020.
Conclusion
In this blog post we show that demographic trends, specifically population aging, exert a powerful influence on labor force participation. In other words, the participation gap largely disappears once we control for population aging, indicating that participation has recovered a great deal since the large shock induced by the pandemic. Other possible contributing factors, such as elevated retirement rates or disability, play only a minor role in explaining the participation gap. Population aging is likely to continue to exert strong downward pressure on participation going forward, as more of the baby boomer generation continue to enter retirement.

Mary Amiti is the head of Labor and Product Market Studies in the Federal Reserve Bank of New York’s Research and Statistics Group.

Sebastian Heise is a research economist in Labor and Product Market Studies in the Federal Reserve Bank of New York’s Research and Statistics Group.

Giorgio Topa is an economic research advisor in Labor and Product Market Studies in the Federal Reserve Bank of New York’s Research and Statistics Group.

Julia Wu is a research analyst in the Federal Reserve Bank of New York’s Research and Statistics Group.
How to cite this post:
Mary Amiti, Sebastian Heise, Giorgio Topa, and Julia Wu, “What Has Driven the Labor Force Participation Gap since February 2020?,” Federal Reserve Bank of New York Liberty Street Economics, March 30, 2023, https://libertystreeteconomics.newyorkfed.org/2023/03/what-has-driven-the-labor-force-participation-gap-since-february-2020/
BibTeX: View |


Disclaimer
The views expressed in this post are those of the author(s) and do not necessarily reflect the position of the Federal Reserve Bank of New York or the Federal Reserve System. Any errors or omissions are the responsibility of the author(s).
 RSS Feed
 Follow Liberty Street Economics
In reply to eg:
Thank you for this comment. We agree that the demographic effects on the participation rate are expected. There are a number of articles written by Federal Reserve staff that discuss the implications of declining participation. See for example:
“Where Is Everybody? The Shrinking Labor Force Participation Rate” (philadelphiafed.org) https://www.philadelphiafed.org/the-economy/macroeconomics/where-is-everybody-the-shrinking-labor-force-participation-rate
Aaronson et al. “Labor Force Participation: Recent Developments and Future Prospects.” https://www.brookings.edu/wp-content/uploads/2016/07/fall2014bpea_aaronson_et_al.pdf (brookings.edu)
Note, however, that there are many other factors that affect labor force participation, such as the business cycle or immigration. It is therefore difficult to predict the exact path of participation going forward, even if we knew exactly the age structure of the population. For example, labor force participation actually rose in the years prior to the pandemic as the strong labor market pulled individuals into the labor force that were previously non-participating.
In reply to Sara Hamlen:
Thank you for this comment. We have not specifically analyzed the evolution of hours worked for these sub groups, as our focus is on the labor force participation rate. However, the study we cite in the blog finds that average hours worked by those with disability have been relatively constant (https://www.brookings.edu/wp-content/uploads/2022/10/WP80-Sheiner-Salwati_10.27.pdf (brookings.edu), Figure 5).
For your other question, we do not see much “un-retirement” of the baby boomer cohort. We have looked at the share of retired workers that return to the labor force in each month by age group and find that these “flows” back into the labor force are currently lower than they were in the decade prior to the pandemic for 60-69 and 70-79 year olds.
In my opinion, there is a reluctance, if not outright discrimination, for employers to even consider hiring – full time or part-time retired boomers. Anecdotally, I am 72 and retired. I have an MBA and have extensive experience in managing large IT projects. I don’t need to work but I want to work and contribute. It’s important to me and others in my circle. Yet no one wants to interview or discuss any possible contribution I might make to a company. I can only conclude this is due to my age. Ageism, along with discrimination against minorities, is robbing the economy of workers who want and can contribute. Just my senile opinion, of course.
Looking longer term, one finds rising labor force participation for those age 65 and over, but much smaller gains for the population age 55 to 64, since the early 1990s. Why is that? Perhaps because of health insurance costs, businesses don’t want those who do not yet qualify for Medicare.
It’d look more clear if you presented tangible numbers on how boomer aging could contribute to it. Comparing 2009 and 2022 doesn’t seem like a solid explanation for sudden drop of 0.8%p between 2020 and 2022.
If I understood the argument correctly, then presumably the current participation rate was an expected outcome based upon long known demographic trends? If so are there any Fed blogs/papers which feature such forecasts and any related policy proposals?
Fascinating. Do the baby boomers remain retired? Have you examined if the number of hours worked per week (less than 19.5 so no health insurance, for example) has remained steady or changed? For disability community as well as older adults (50+)?
Have older adults “un-retired” in baby boomer cohort?
In reply to Andrew:
Indeed, baby boomer aging was exerting downward pressure on the LFPR also before 2020. However, countervailing that, the labor market was very strong in the few years prior to 2020, drawing more people back into the labor force who may have been on the sidelines.
Super interesting, thank you! I just can’t get my head around one intuition here: if baby boomer aging explains almost the whole gap, wouldn’t we see LFPR decreasing steadily in the couple of years prior to 2020? This cohort was entering retirement at elevated rates back then, too.
You will note that Prime Age EPOP and LFPR have met or exceeded pre-pandemic levels.