


The size of the money market fund (MMF) industry co-moves with the monetary policy cycle. In a post published in 2019, we showed that this co-movement is likely due to the stronger response of MMF yields to monetary policy tightening relative to bank deposit rates, combined with MMF shares and bank deposits being close substitutes from an investor’s perspective. In this post, we update the analysis and zoom in to the current monetary policy tightening by the Federal Reserve.
Differential Betas on Bank Deposits and MMF Shares
The Federal Open Market Committee (FOMC) adjusts the stance of monetary policy primarily by changing the target range for the federal funds rate, the interest rate banks charge each other for overnight unsecured loans of funds. Changes in the target range are implemented via two policy tools—the rate paid on banks’ reserve balances and the rate offered at the overnight reverse repo facility—that influence rates in the federal funds market. Changes in federal funds rates are then passed through to other rates, including the interest rates banks and non-bank money managers offer to their clients. The pace at which changes in the policy stance are transmitted and affect broad financial conditions is a key determinant of the impact of monetary policy on economic conditions.
The chart below plots the effective federal funds rate (EFFR)—a volume-weighted median of overnight federal funds transactions—along with the average rate on three-month certificates of deposit (CDs) offered by banks to their retail customers and the average yield paid by MMFs to their investors net of fund fees. As the chart shows, the response of retail three-month CD rates to changes in monetary policy (the so-called deposit beta) is much slower than that of MMF shares, which for symmetry with the deposit beta, we call the MMF beta. Indeed, since March 2022, yields on MMFs have risen by 4.13 percentage points, or 97 percent of the EFFR increase, whereas CD rates have only risen by 0.32 percentage points, or 8 percent of the increase in the EFFR.
MMF Beta Is Higher Than Deposit Beta. . .
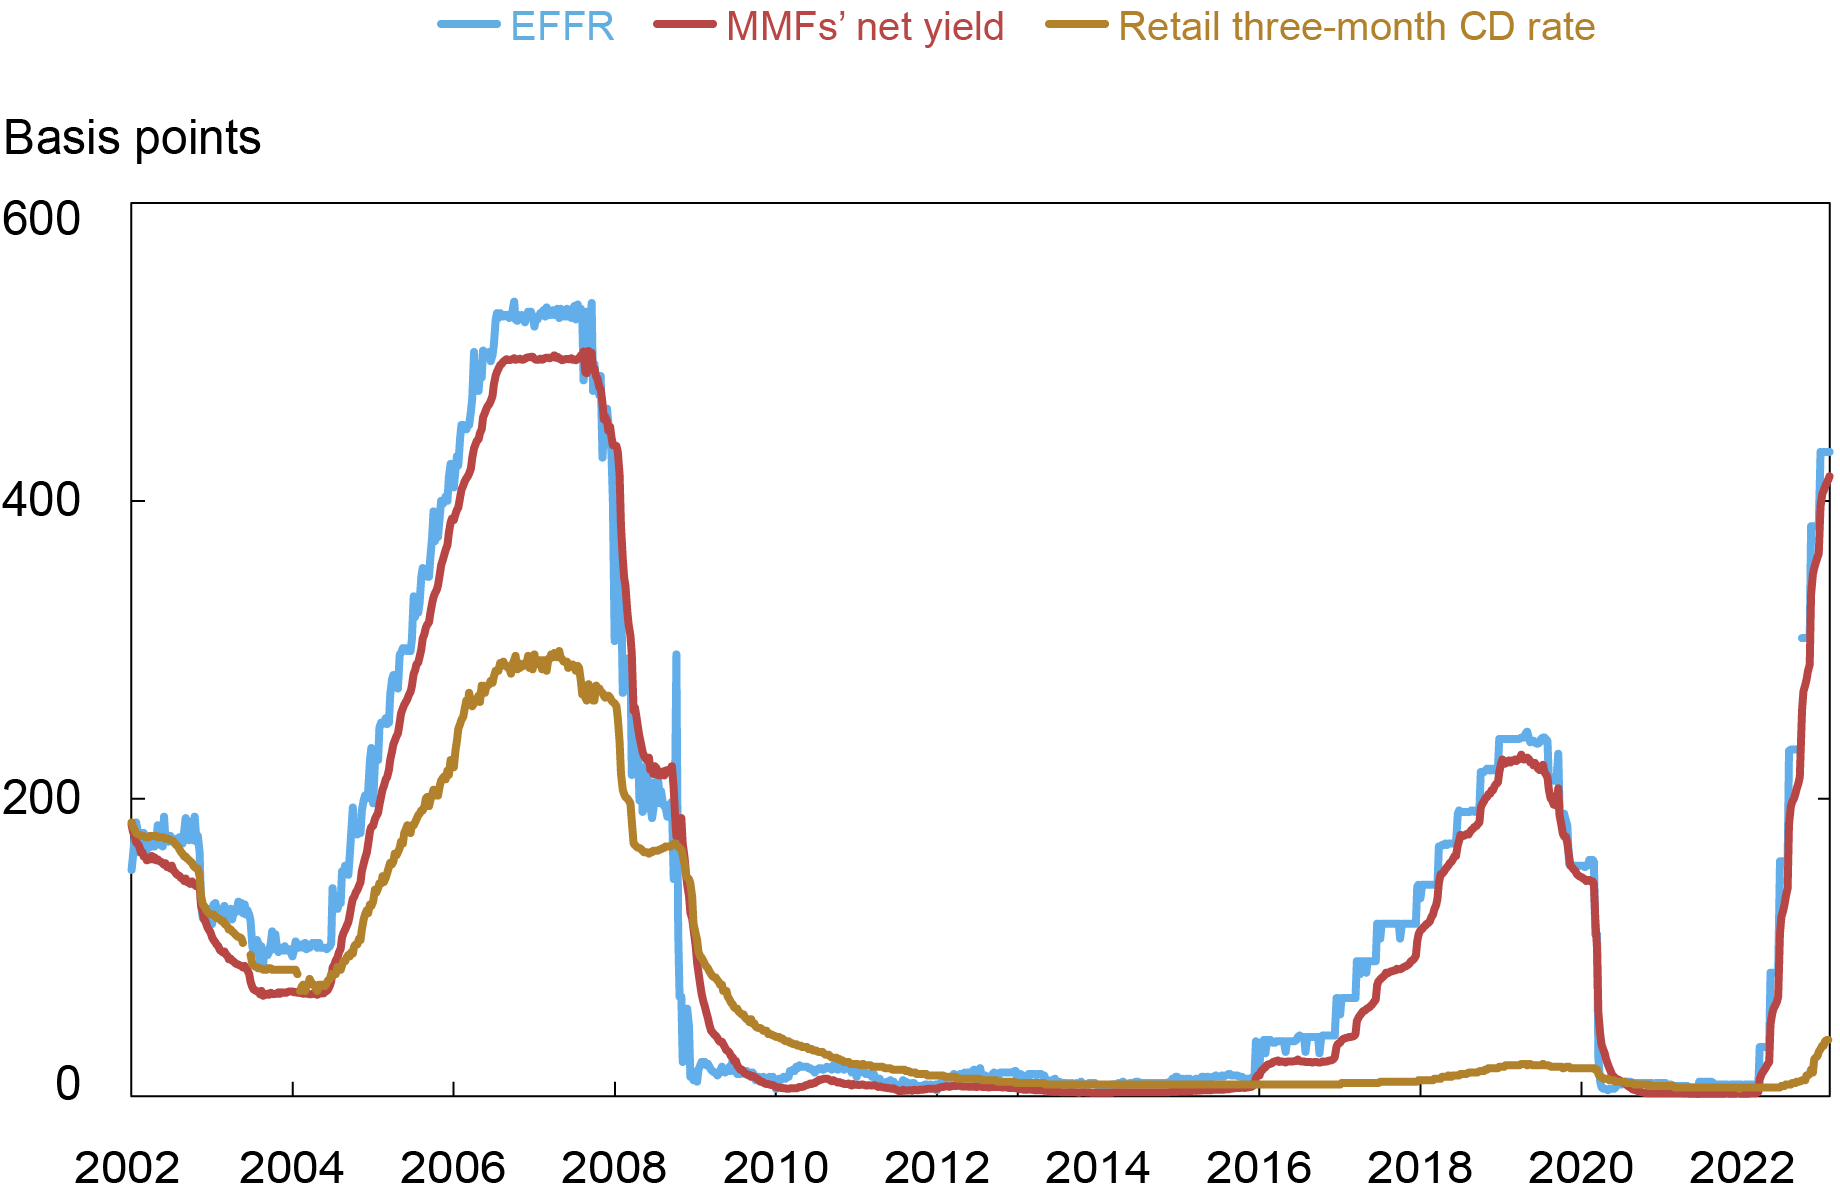
Note: The chart plots the EFFR, the net yield on MMF shares, and the rate on three-month CDs from January 2002 to January 30, 2023.
The differential betas are not just a feature of the most recent policy cycle; as shown in the table below, between 2002 and January 2023, the deposit beta was 26 percent: that is, a one percentage point increase in the EFFR leads to a 0.26 percentage point increase in the CD rate. In contrast, a one percentage point increase in the EFFR increases MMF yields by 0.88 percentage points. One reason for the difference in betas could be the level of sophistication of retail and institutional investors. However, while the yields of MMFs catering to institutional investors respond more quickly to monetary policy changes, as we show in this post, retail MMFs also have much higher betas than bank deposits: in 2002-23, for instance, the beta on retail MMF shares was 86 percent, three times larger than the deposit beta.
Monetary Policy Pass-Through 2002-2023
| Retail CD rates | 0.26 |
| MMF yields | 0.88 |
| Retail MMF yields | 0.86 |
Note: The betas are estimated through regression analysis, following the approach of
Afonso et al. (2022), on data from January 2002 to January 30, 2023.
The deposit and MMF betas have also diverged over time. As discussed in this post, deposit betas have attenuated over the last twenty years, whereas the betas on MMF shares have remained roughly constant. Indeed, as the next table shows, the deposit beta decreased from 42 percent in 2002-09 to 8 percent in 2010-23, while the MMF beta stayed flat at around 90 percent across the two periods.
Monetary Policy Pass-Through 2002-2009 vs 2010-2023
| 2002-2009 | 2010-2023 | ||
| Retail CD rates | 0.42 | 0.08 | |
| MMF yields | 0.87 | 0.93 | |
| Retail MMF yields | 0.86 | 0.89 |
Note: The betas are estimated through regression analysis, following the approach of
Afonso et. al (2022), on data from January 2002 to December 2009 (left column) and from January 2010 to January 30, 2023 (right column).
Monetary Policy Transmission and the Size of the MMF Industry
The gap between the deposit and MMF betas increases the appeal of MMF shares relative to bank deposits when the Federal Reserve tightens its monetary policy and decreases their appeal when the Federal Reserve cuts rates. As a result, the size of the MMF industry tracks the monetary policy cycle, albeit with a lag. The chart below shows the assets under management (AUM) of the MMF industry, along with the EFFR and the spread between the MMF yield and the three-month retail CD rate. As the chart shows, the MMF industry did indeed expand following the monetary policy tightening cycles of 2004-08, 2015-18, and 2022 onward. The expansions, however, took place with a lag of one to two years.
. . . and the Size of the MMF Industry Increases following Monetary Policy Tightening
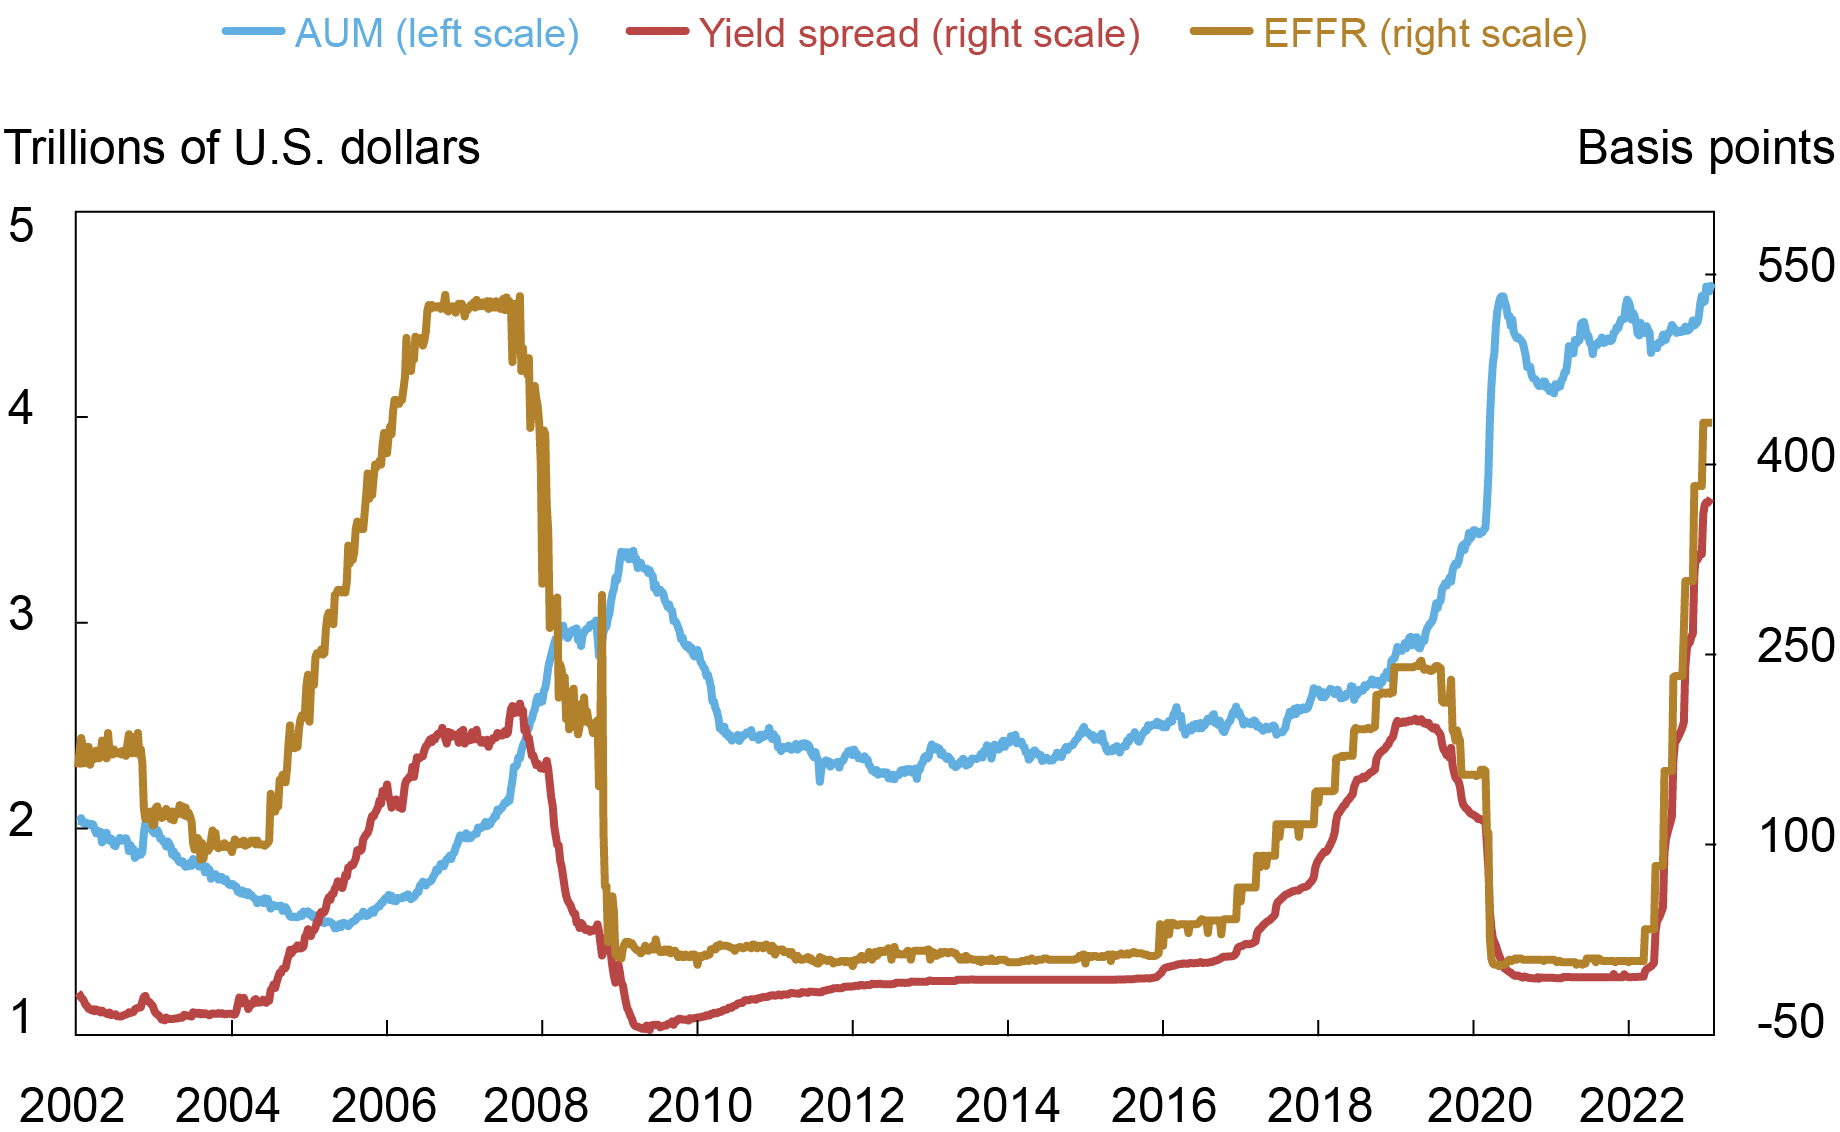
Notes: The chart plots MMFs’ assets under management (left axis) and the EFFR and yield spread (right axis), from May 2002 to January 30, 2023. The yield spread is the spread between the MMF net yield and the retail three-month CD rate.
In a recently published staff report, we show that a one percentage point increase in the EFFR increases the AUM of the average MMF by roughly 6 percent over two years. Given that our sample contains 500 MMFs with an average AUM of $5 billion, a one percentage point increase in the EFFR is estimated to increase the AUM of the MMF industry by $150 billion over the following two years. Similarly, the ratio of MMFs’ AUM to bank deposits increases by 6 percent over the same horizon.
It is worth noting that, as the chart above shows, the MMF industry did not shrink significantly after rates were cut in 2020; rather, it grew after the Federal Reserve rapidly increased its balance sheet in response to the COVID-19 financial crisis. The reason, as we will explain in a future post, is that a larger balance sheet puts pressure on depository institutions by affecting their regulatory constraints, and gives them an incentive to shed deposits, which in turn flow to MMF shares, a close substitute. Moreover, current policy tightening has just started to have an impact on the MMF industry, with the size of the industry starting to tick upward after August 2022.
To Sum Up
This post updates the findings of our previous work on the relationship between monetary policy, MMF yields, and the size of the MMF industry. During the current tightening cycle, MMF yields have increased by 4.13 percentage points, in line with our previous estimate of the beta on MMF shares between 2002 and 2020; in contrast, deposit rates have remained flat. Moreover, consistent with these results, the AUM of the MMF industry has increased as the Federal Reserve has tightened rates, from $4.31 trillion in April 2022 to $4.62 trillion in January 2023. The relatively small magnitude of this increase in the size of the MMF industry, against a rate hike of 4.25 percentage points, is likely due to a lag with which monetary policy affects investor flows in MMFs; the recent monetary policy tightening, in fact, could lead to a further expansion of the MMF industry in the near future.

Gara Afonso is the head of Banking Studies in the Federal Reserve Bank of New York’s Research and Statistics Group.

Marco Cipriani is head of Money and Payments Studies in the Federal Reserve Bank of New York’s Research and Statistics Group.

Catherine Huang is a research analyst in the Federal Reserve Bank of New York’s Research and Statistics Group.

Abduelwahab Hussein is a research analyst in the Federal Reserve Bank of New York’s Research and Statistics Group.

Gabriele La Spada is a financial research economist in Money and Payments Studies in the Federal Reserve Bank of New York’s Research and Statistics Group.
How to cite this post:
Gara Afonso, Marco Cipriani, Catherine Huang, Abduelwahab Hussein, and Gabriele La Spada, “Monetary Policy Transmission and the Size of the Money Market Fund Industry: An Update,” Federal Reserve Bank of New York Liberty Street Economics, April 3, 2023, https://libertystreeteconomics.newyorkfed.org/2023/04/monetary-policy-transmission-and-the-size-of-the-money-market-fund-industry-an-update/
BibTeX: View |


Disclaimer
The views expressed in this post are those of the author(s) and do not necessarily reflect the position of the Federal Reserve Bank of New York or the Federal Reserve System. Any errors or omissions are the responsibility of the author(s).
 RSS Feed
 Follow Liberty Street Economics