


Editor’s Note: When this post was first published the entries in the legend for the first chart were transposed; the legend has been corrected (November 21, 9:45 a.m.)

When the Federal Open Market Committee (FOMC) wants to raise the target range for the fed funds rate, it raises the interest on reserve balances (IORB) paid to banks, the primary credit rate offered to banks, and the award rate paid to participants that invest in the overnight reverse repo (ON RRP) market to keep the fed funds rate within the target range (see prior Liberty Street Economics posts on this topic). When these rates change, market participants respond by adjusting the valuation of financial products, of which a significant category is deposits. Understanding how deposit terms adapt to changes in policy rates is important to understanding the impact of monetary policy more broadly. In this post, we evaluate the pass through of the fed funds rate to deposit rates (that is, deposit betas) over the past several interest rate cycles and discuss factors that affect deposit rates.
Deposit Betas
Deposits make up an $18 trillion product category that is critical to the funding structure of banks and a key source of savings for households and businesses. The degree to which changes in the target fed funds rate pass through to deposits is important for bank funding, monetary policy transmission, and depositors’ finances. The deposit beta is the portion of a change in the fed funds rate that is passed on to deposit rates. For example, if the target fed funds rate is raised by 50 basis points and in response a bank increases its deposit rate 25 basis points, the deposit beta is 50 percent. In a rising rate environment like the one we are currently in, low deposit betas boost bank earnings but limit payouts to depositors.
We estimate the evolution of deposit betas using data from Bank Holding Company (BHC) regulatory filings (FR Y-9C). To infer the annualized rates being paid on deposits we sum across all BHCs and scale the interest expense paid on deposits by total interest-bearing (IB) deposits for each quarter. Although we focus on the rates paid on IB deposits, including noninterest bearing accounts does not affect our general findings. We focus on the industry-level deposits given our interest in the overall pass-through of monetary policy to deposit rates.
Deposit Rates and the Fed Funds Rate
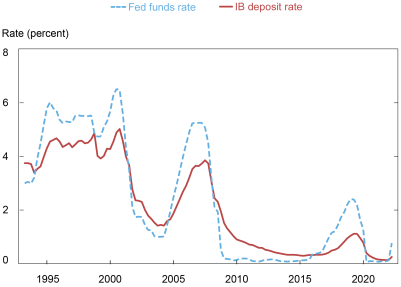
The above chart shows the path of deposit rates and the average fed funds rate over time. Deposit rates follow the fed funds rate but are typically lower, particularly when the fed funds rate is elevated.
Prior research has found that betas are lower when the fed funds rate is rising than when it is falling; therefore, we focus our analysis on periods with rising rates. We consider the current cycle as well as three tightening cycles over the last thirty years: 1994:Q1-1995:Q2, 2004:Q3-2007:Q2, and 2015:Q4-2019:Q2. In the chart below, we calculate the cumulative beta as the cumulative change in deposit rates relative to the cumulative change in the fed funds rate over several tightening cycles.
Cumulative Deposit Betas over Tightening Cycles
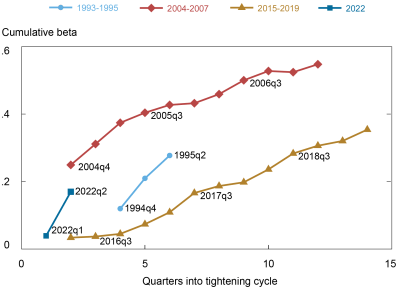
As seen in the chart, deposit betas started higher in the 2004 rate cycle and peaked at a cumulative beta approaching 60 percent, whereas in the cycle post the financial crisis, betas start near zero and ultimately never exceeded 40 percent. The 1990s look to be an intermediate example with no response in the first several quarters but a rapid and growing beta toward the end of the tightening cycle. Peak betas have fallen by about 30 percent, a significant decrease, since the 2000s.
The Role of Deposit Supply
The changes in the deposit betas since the 1990s occur concurrently with large changes in the monetary policy regime and financial conditions, especially since the Global Financial Crisis (GFC). In particular, deposits have increased significantly as a source of funding for the banking sector. One reason banks may be reluctant to raise deposit rates is that they have more deposits than they really need, so they are willing to allow depositors to seek better rates elsewhere.
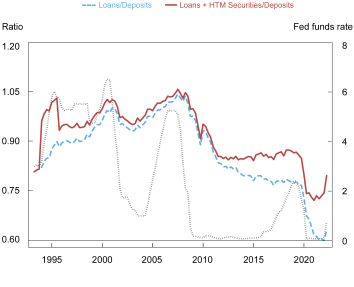
We consider two measures of deposit supply to help explain the evolution of betas over the past several decades. Since the financial crisis, deposits have grown steadily as a share of bank assets, specifically invested assets like loans. In the chart below, we plot the ratio of BHC loans-to-deposits and loans plus Held to Maturity (HTM) securities-to-deposits. The loans-to-deposits ratio is often referenced by the industry as a measure of investment-to-funding, but since the financial crisis, HTM securities have increased significantly in response to regulatory changes and they are unlikely to be sold, particularly in a rising rate environment, so we include them with loans.
Lending relative to deposit funding has fallen since 2007 and is particularly low following the COVID recession. The patterns reflect the growth of deposit funding during the period where the fed funds rate is close to zero. These ratios were also low at the onset of the 1994 rate cycle. Hence the level of deposits appears to be roughly correlated with the responsiveness of deposit rates to fed funds hikes that is, the deposit betas), as shown in the prior chart.
Loan-to-Deposit Ratios and the Fed Funds Rate
Countering the high quantity of deposits are forces that encourage depositors to withdraw and invest elsewhere. One way to measure the opportunity cost of depositors is to look at the gap between the average fed funds rate and the rate on deposits over time (the deposit gap). This gap is representative of the earnings depositors forego. A bigger gap means that the opportunity cost of holding deposits is higher, and a smaller (or negative) gap means that it is lower. From the banks’ perspective, a higher gap suggests that depositors are more likely to exit the banking sector to seek other investments.
Deposit Gap, Deposit Rates and the Fed Funds Rate
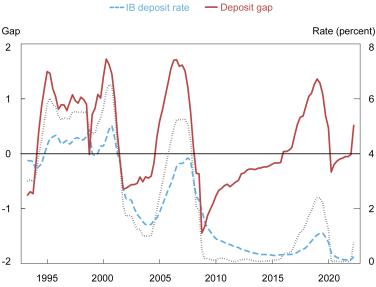
Looking at the chart, we can observe that the gap is negative when rates are near zero (and deposit levels are high) and positive when rates rise. As a consequence, post GFC and prior to the 1994 tightening, deposits were more attractive to depositors and deposit supply was high relative to loans. These periods also correspond to lower initial deposit betas. However, as rates rise the gap increases, depositors move elsewhere, banks raise their rates, and cumulative deposit betas rise.
In addition to the time-series, we considered cross-sectional evidence relating these measures of deposit supply to deposit betas across banks. Our results indicate that both the loans-plus-HTM securities-to-deposits ratio and the deposit gap are positively correlated to deposit betas.
Takeaways
Since the 1990s, the response of deposits to monetary policy has been attenuated. This can be explained by the growth in deposits over the post-crisis period relative to investment opportunities. Understanding deposit pricing dynamics requires thinking about the quantities of various funding sources and the presence (or lack thereof) of competing products. Taken together, current deposit betas are lower and slower given banks significant supply of deposit funding. However, going forward the rapid increase in the fed funds rate suggests that the deposit gap will be higher than recent rate cycles, causing depositors to look elsewhere and deposit rates to rise in response.

Alena Kang-Landsberg is a research analyst in the Federal Reserve Bank of New York’s Research and Statistics Group

Matthew Plosser is a financial research advisor in Banking Studies in the Federal Reserve Bank of New York’s Research and Statistics Group.
How to cite this post:
Alena Kang-Landsberg and Matthew Plosser , “How Do Deposit Rates Respond to Monetary Policy?,” Federal Reserve Bank of New York Liberty Street Economics, November 21, 2022, https://libertystreeteconomics.newyorkfed.org/2022/11/how-do-deposit-rates-respond-to-monetary-policy/
BibTeX: View |
Disclaimer
The views expressed in this post are those of the author(s) and do not necessarily reflect the position of the Federal Reserve Bank of New York or the Federal Reserve System. Any errors or omissions are the responsibility of the author(s).
 RSS Feed
 Follow Liberty Street Economics