


This post presents an updated estimate of inflation persistence, following the release of personal consumption expenditure (PCE) price data for February 2023. The estimates are obtained by the Multivariate Core Trend (MCT), a model we introduced on Liberty Street Economics last year and covered most recently in a February post. The MCT is a dynamic factor model estimated on monthly data for the seventeen major sectors of the PCE price index. It decomposes each sector’s inflation as the sum of a common trend, a sector-specific trend, a common transitory shock, and a sector-specific transitory shock. The trend in PCE inflation is constructed as the sum of the common and the sector-specific trends weighted by the expenditure shares.
Modest Decline in the MCT
The MCT declined slightly to 4.5 percent in February from 4.6 percent in January (the value for January was itself revised down from 4.8 percent). Uncertainty is high, resulting in a 68 percent probability band (shaded area) of (4.0, 5.2) percent. By comparison, the standard twelve-month core PCE measure declined from 4.7 percent in January to 4.6 percent in February following monthly readings of 0.6 percent in January and 0.3 percent in February.
PCE and Multivariate Core Trend
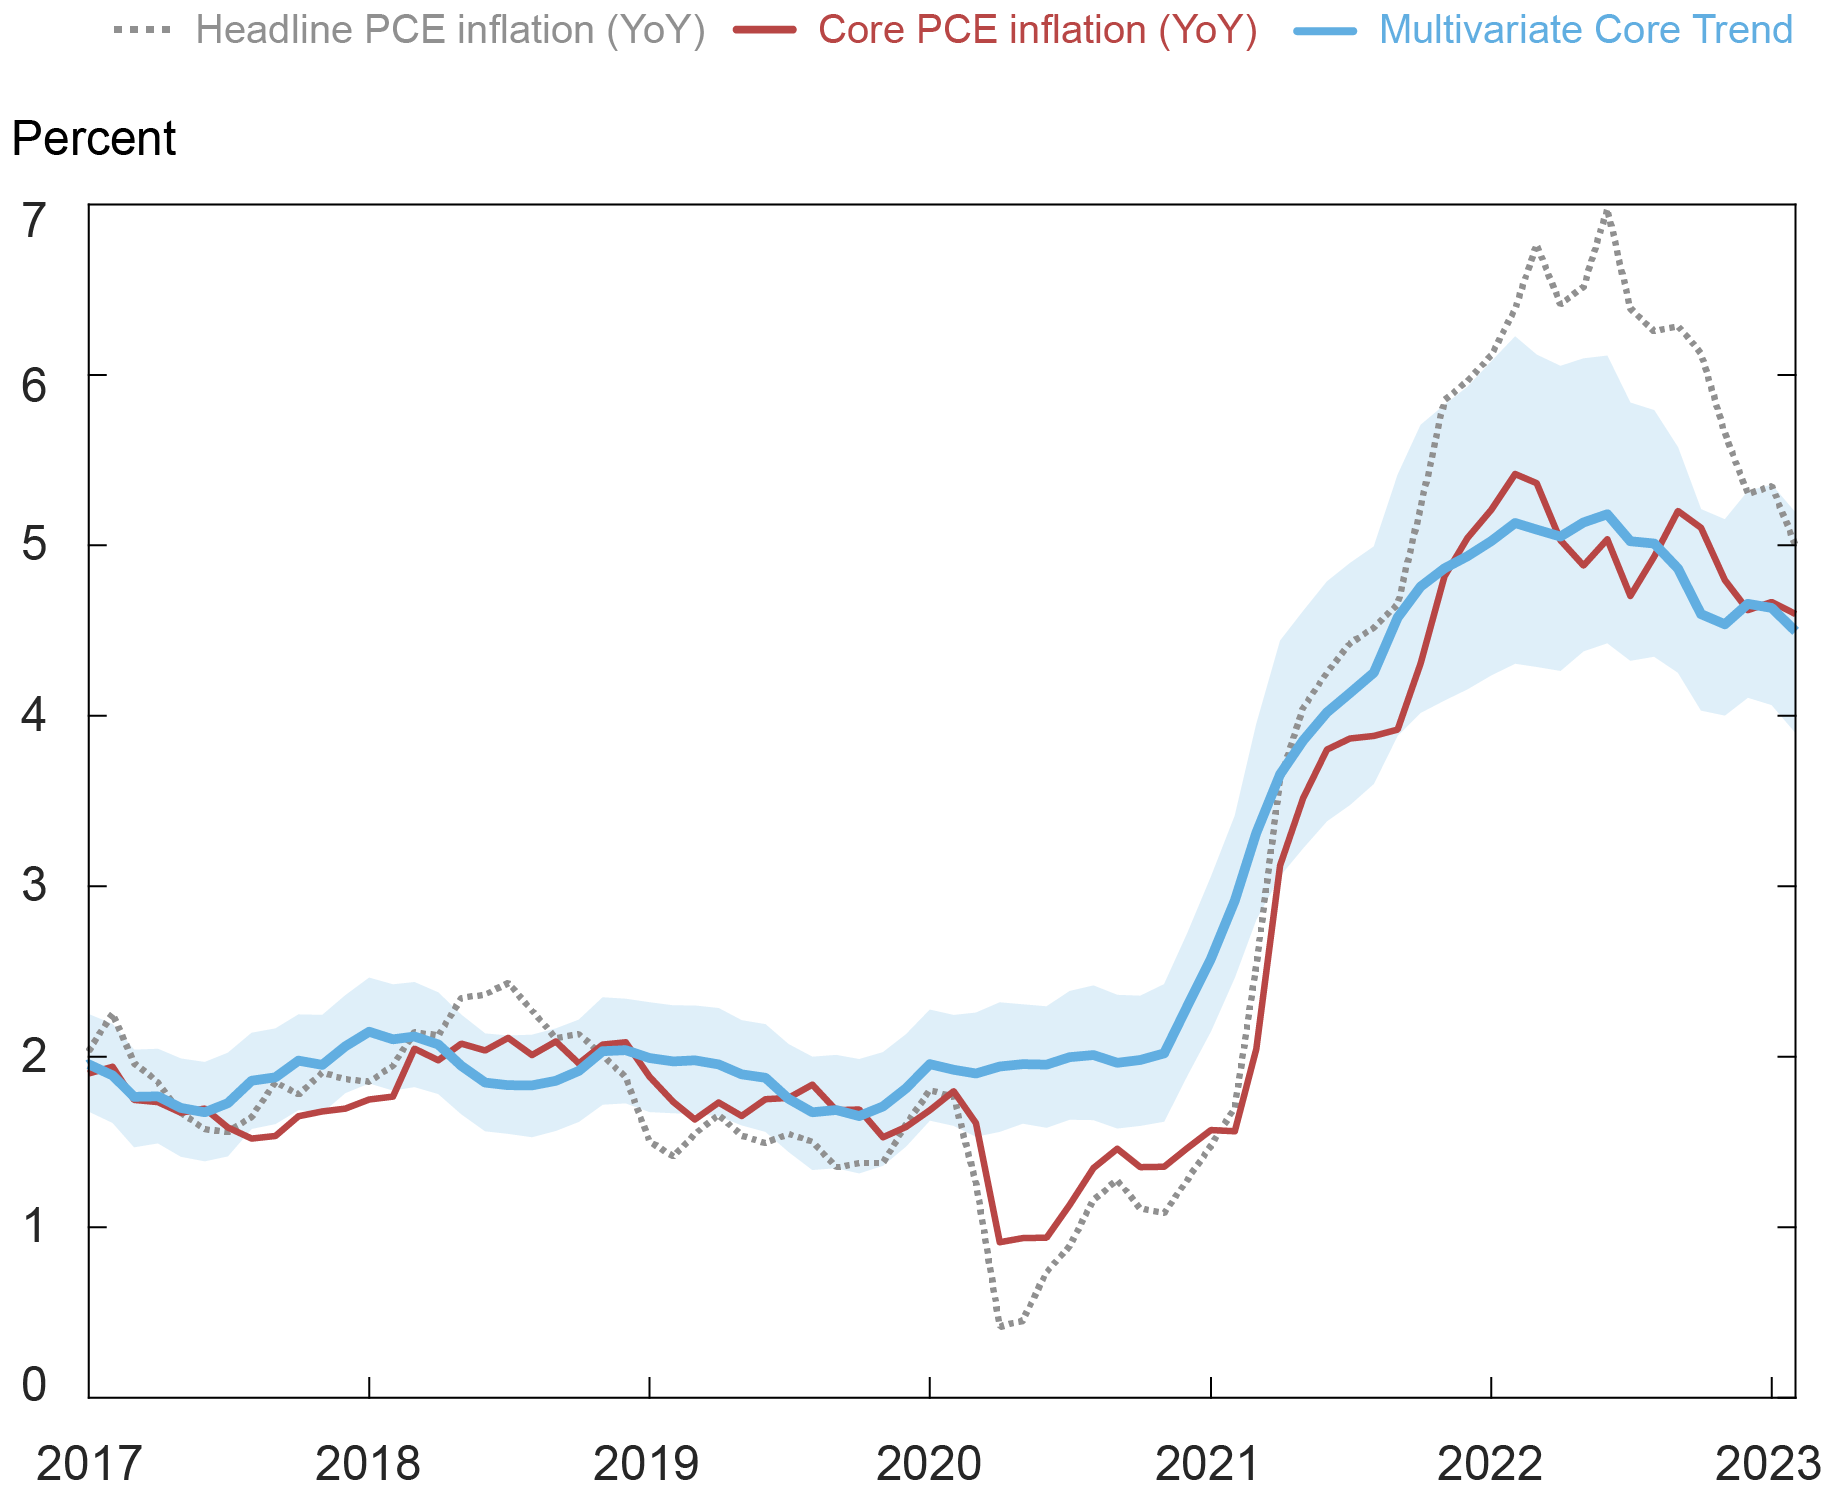
Notes: PCE is personal consumption expenditure. The shaded area is a 68 percent probability band.
According to our latest estimates, the trend has held steady at a level between 4.5 and 4.7 percent since October 2022 after exceeding 5 percent during most of 2022. The sectoral composition remained stable with the contribution of core goods, core services excluding housing, and housing not too different from their values in October 2022.
The trend in housing inflation appears to have stabilized at 8.9 percent (a tick lower from 9.0 percent in January). This is in contrast with the twelve-month measure that has continued to increase. The trends in goods and services, after a small bump in January, are again declining. Considering this, the contribution of housing inflation to the increase in the persistent component of inflation from the onset of the pandemic, at about 1 ppt, is comparable to the contributions of services ex-housing (0.9 ppt) and goods (0.8 ppt), as shown in the following chart.
Inflation Trend Decomposition: Sector Aggregates
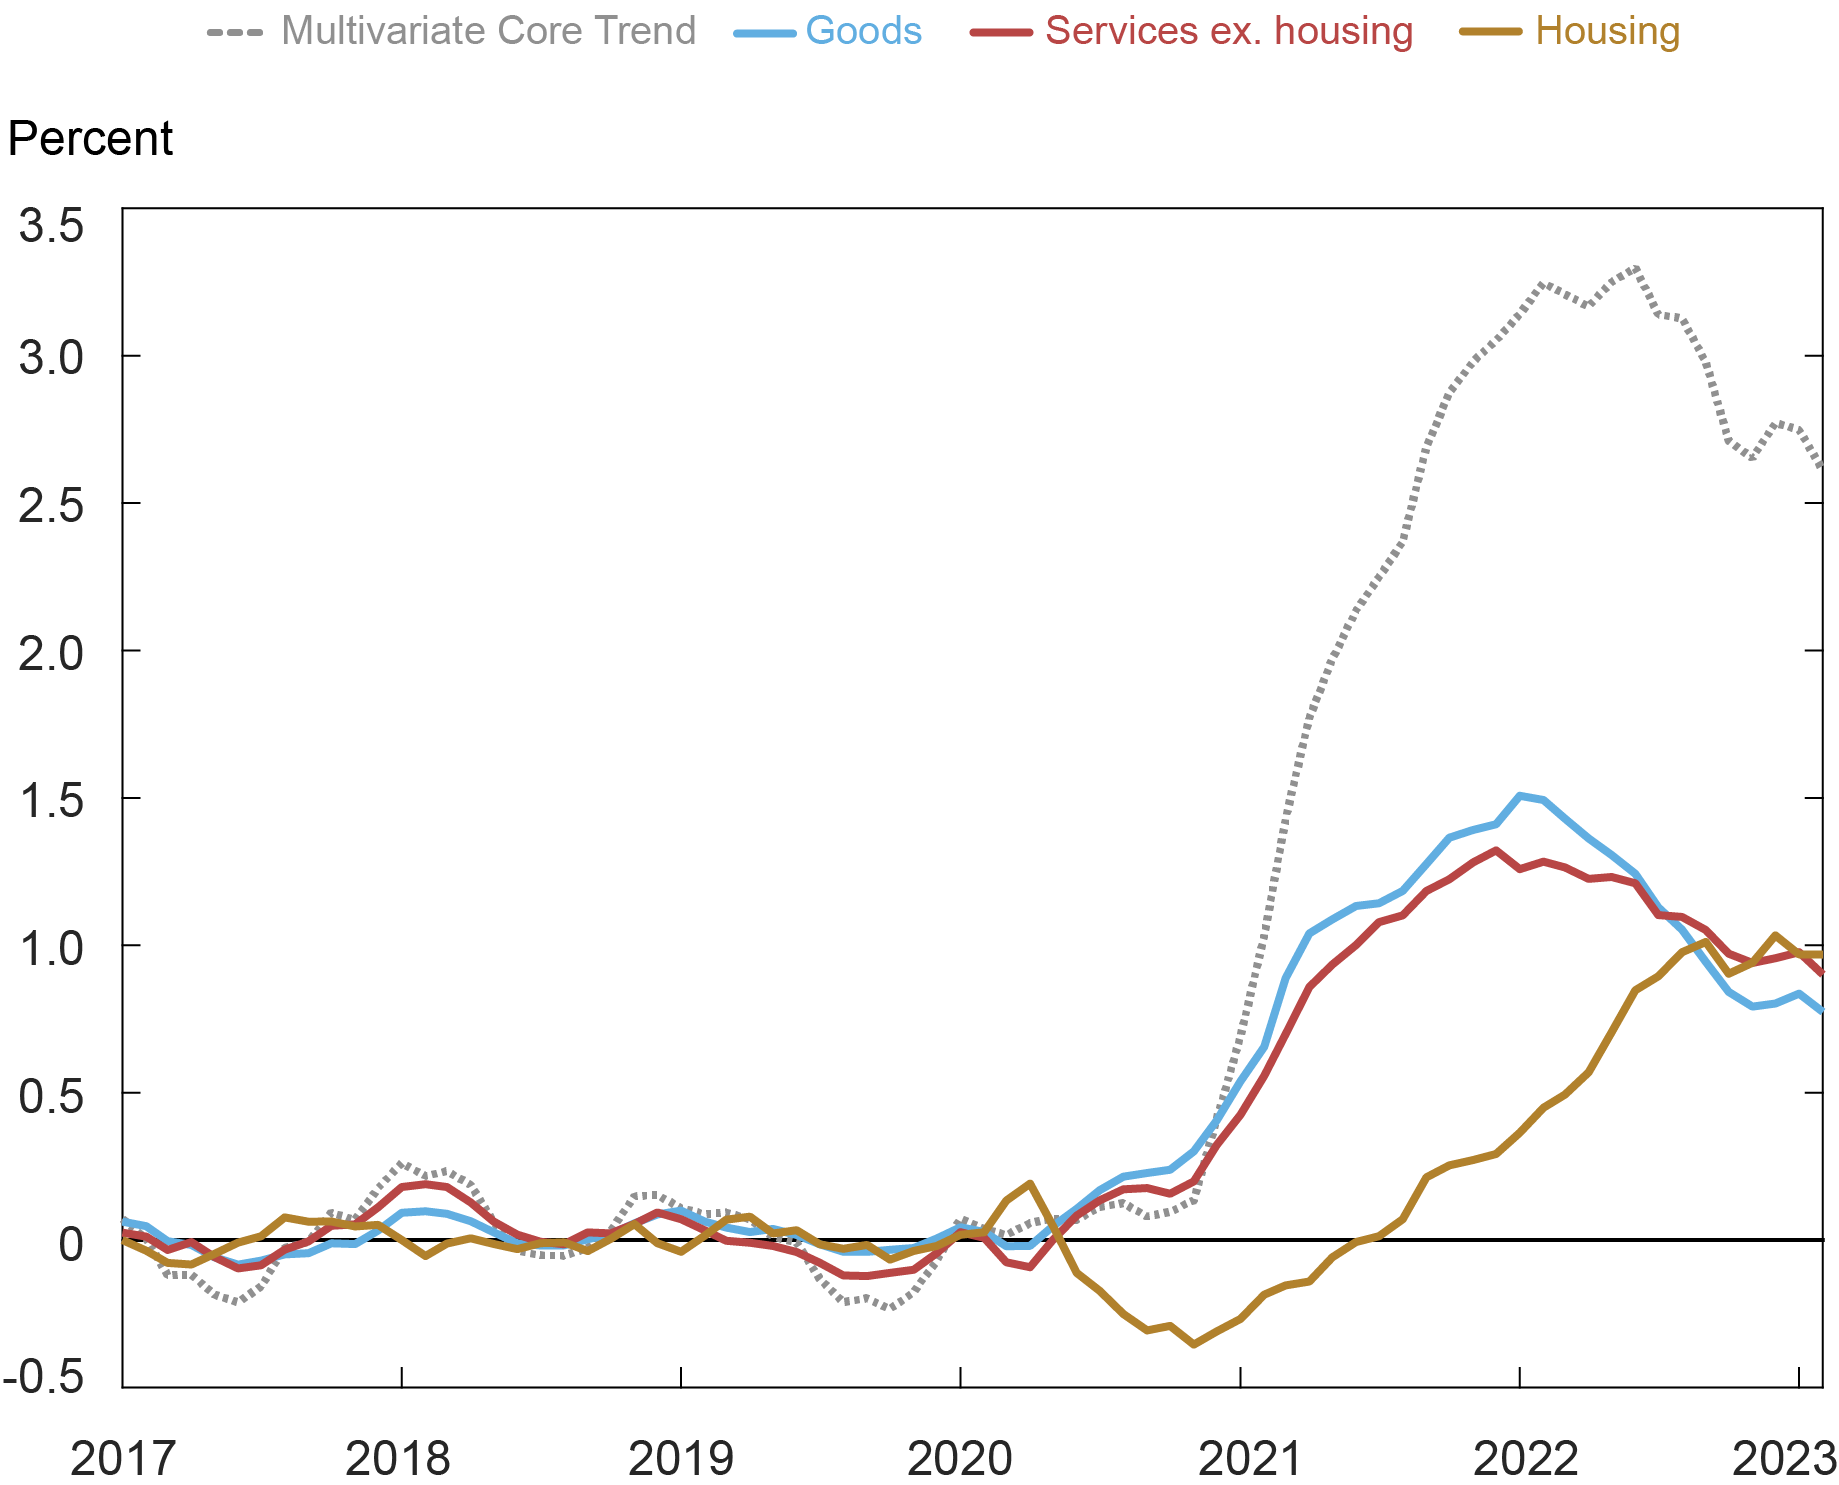
Note: The base for the calculations of the contributions to the change in the Multivariate Core Trend is the average over the period January 2017-December 2019.
As we documented in our previous posts, an important difference across sectors is the source of the persistence: in the housing sector, the persistence has a strong sector-specific component, while core goods and services ex-housing are dominated by their common component.
Finer Inflation Trend Decomposition
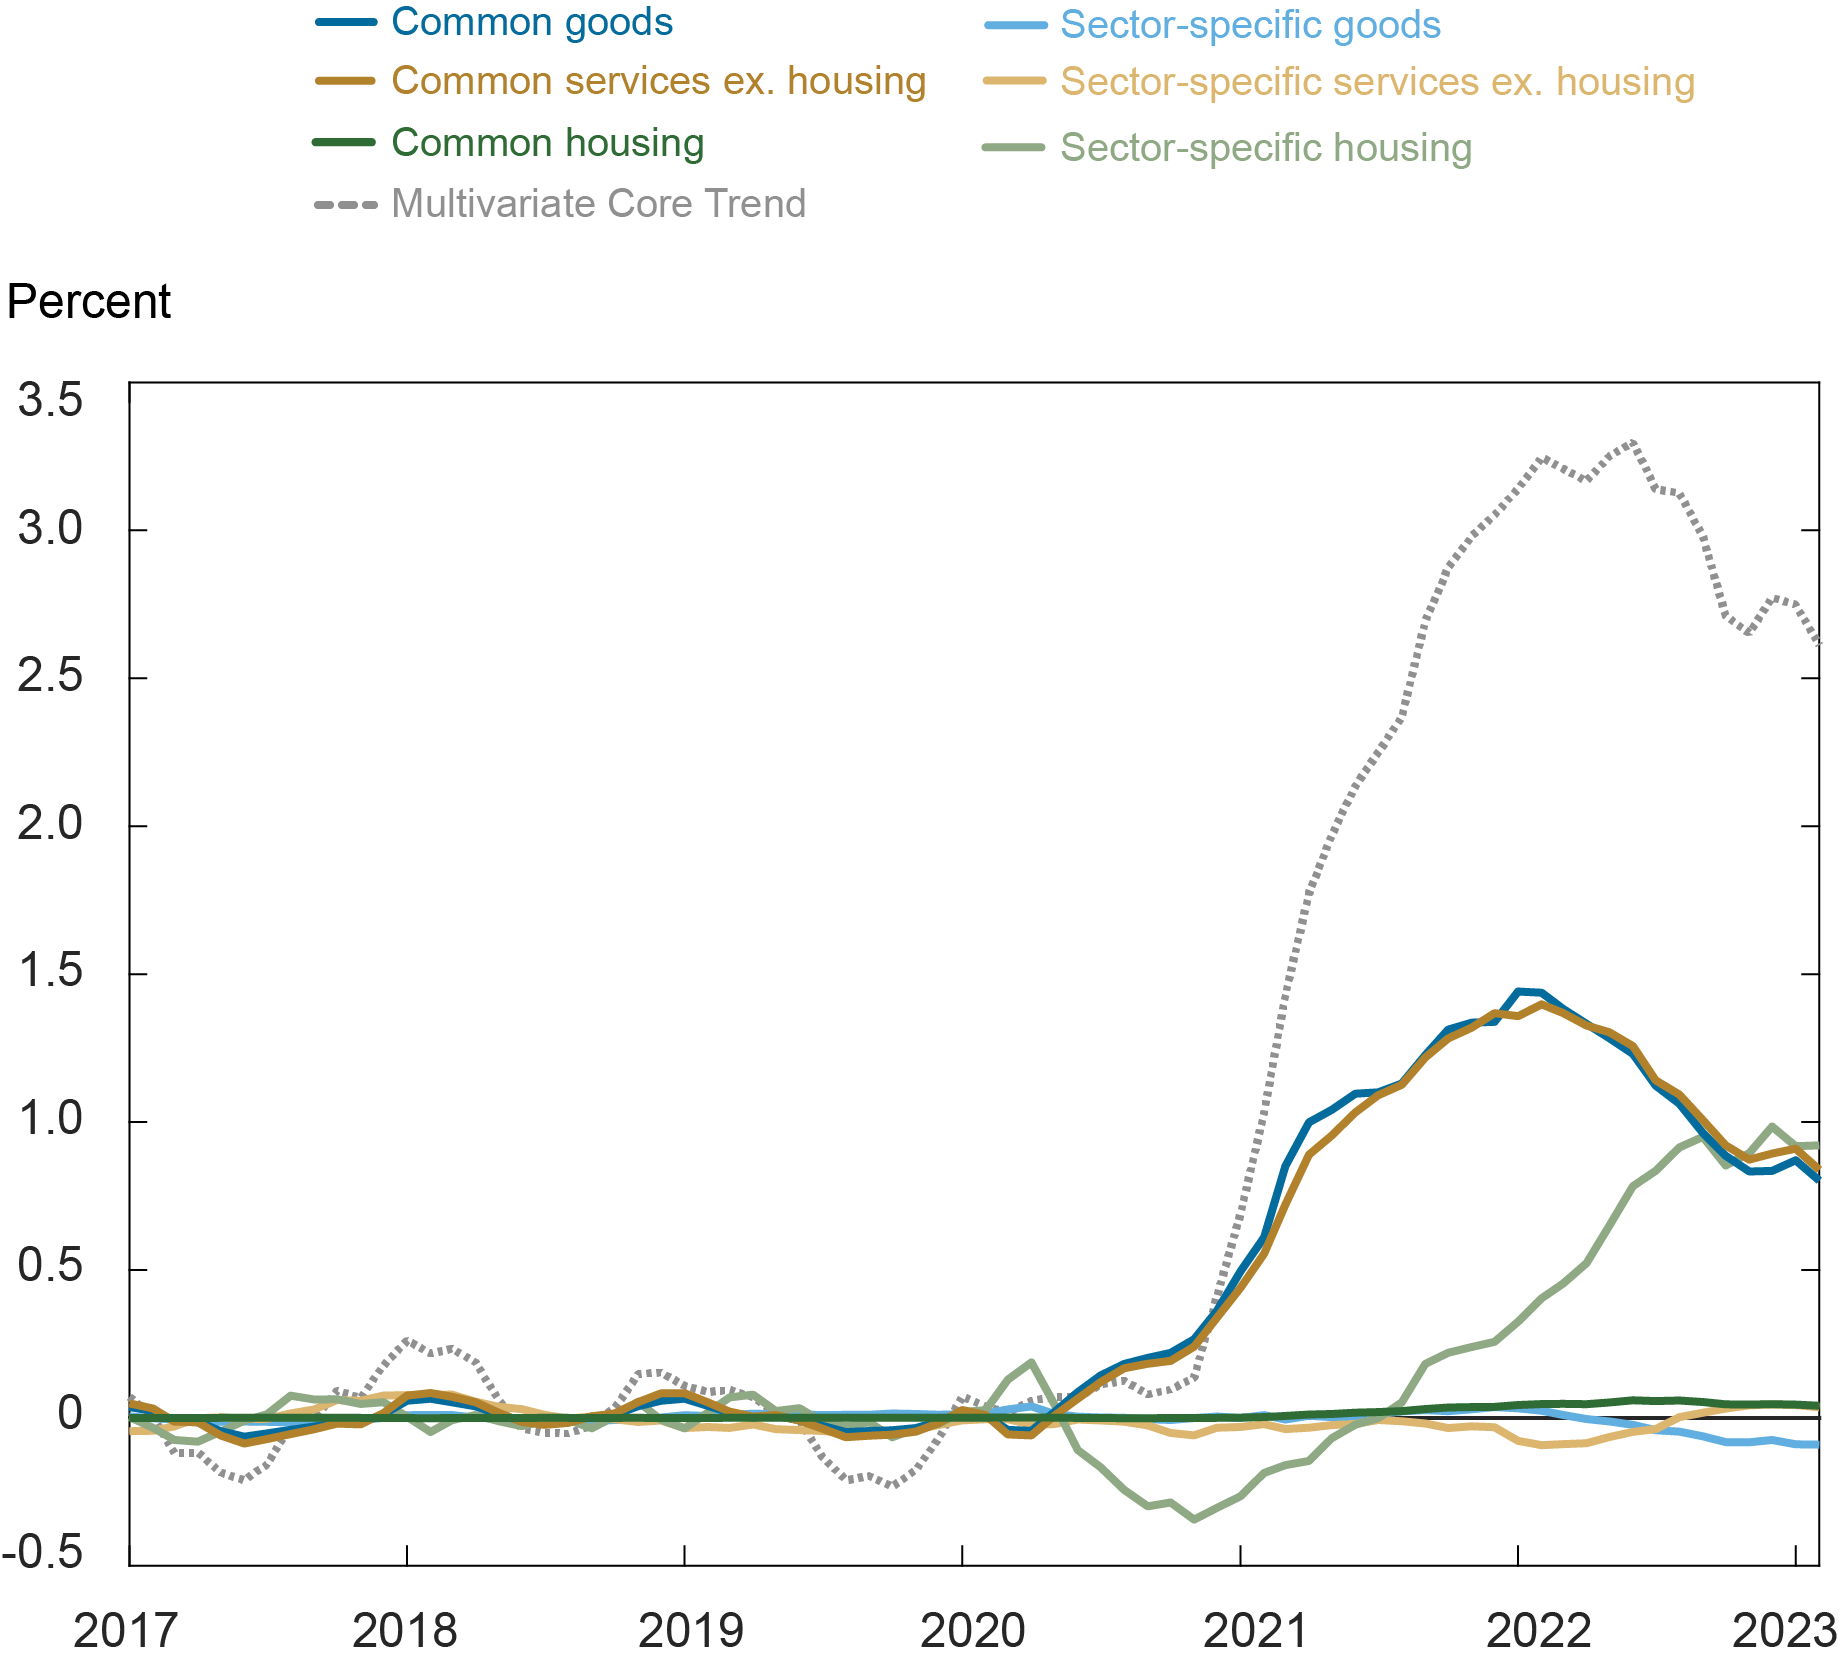
Note: The base for the calculations of the contributions to the change in the Multivariate Core Trend is the average over the period January 2017-December 2019.
We will provide a new update of the MCT and its sectoral insights after the release of March PCE data.

Martín Almuzara is a research economist in Macroeconomic and Monetary Studies in the Federal Reserve Bank of New York’s Research and Statistics Group.

Babur Kocaoglu is a senior research analyst in the Federal Reserve Bank of New York’s Research and Statistics Group.

Argia Sbordone is the head of Macroeconomic and Monetary Studies in the Federal Reserve Bank of New York’s Research and Statistics Group.
How to cite this post:
Martin Almuzara, Babur Kocaoglu, and Argia Sbordone, “MCT Update: Inflation Persistence Declined Modestly in February,” Federal Reserve Bank of New York Liberty Street Economics, April 6, 2023, https://libertystreeteconomics.newyorkfed.org/2023/04/mct-update-inflation-persistence-declined-modestly-in-february/
BibTeX: View |


Disclaimer
The views expressed in this post are those of the author(s) and do not necessarily reflect the position of the Federal Reserve Bank of New York or the Federal Reserve System. Any errors or omissions are the responsibility of the author(s).
 RSS Feed
 Follow Liberty Street Economics