


This post presents updated estimates of inflation persistence, following the release of personal consumption expenditure (PCE) price data for January 2023. The estimates are obtained by the Multivariate Core Trend (MCT), a model we introduced on Liberty Street Economics last year and covered most recently here and here. The MCT is a dynamic factor model estimated on monthly data for the seventeen major sectors of the PCE price index. It decomposes each sector’s inflation as the sum of a common trend, a sector-specific trend, a common transitory shock, and a sector-specific transitory shock. The trend in PCE inflation is constructed as the sum of the common and the sector-specific trends weighted by the expenditure shares.
Significant Increase in the MCT
The current release of the MCT implies a significant upward revision in estimated inflation persistence. The MCT stands at 4.9 percent for the month of January following an increase in December, as shown in the solid blue line in the chart below. Importantly, the MCT curve has moved up relative to the estimates reported in our February 7 post. What happened?
PCE and Multivariate Core Trend
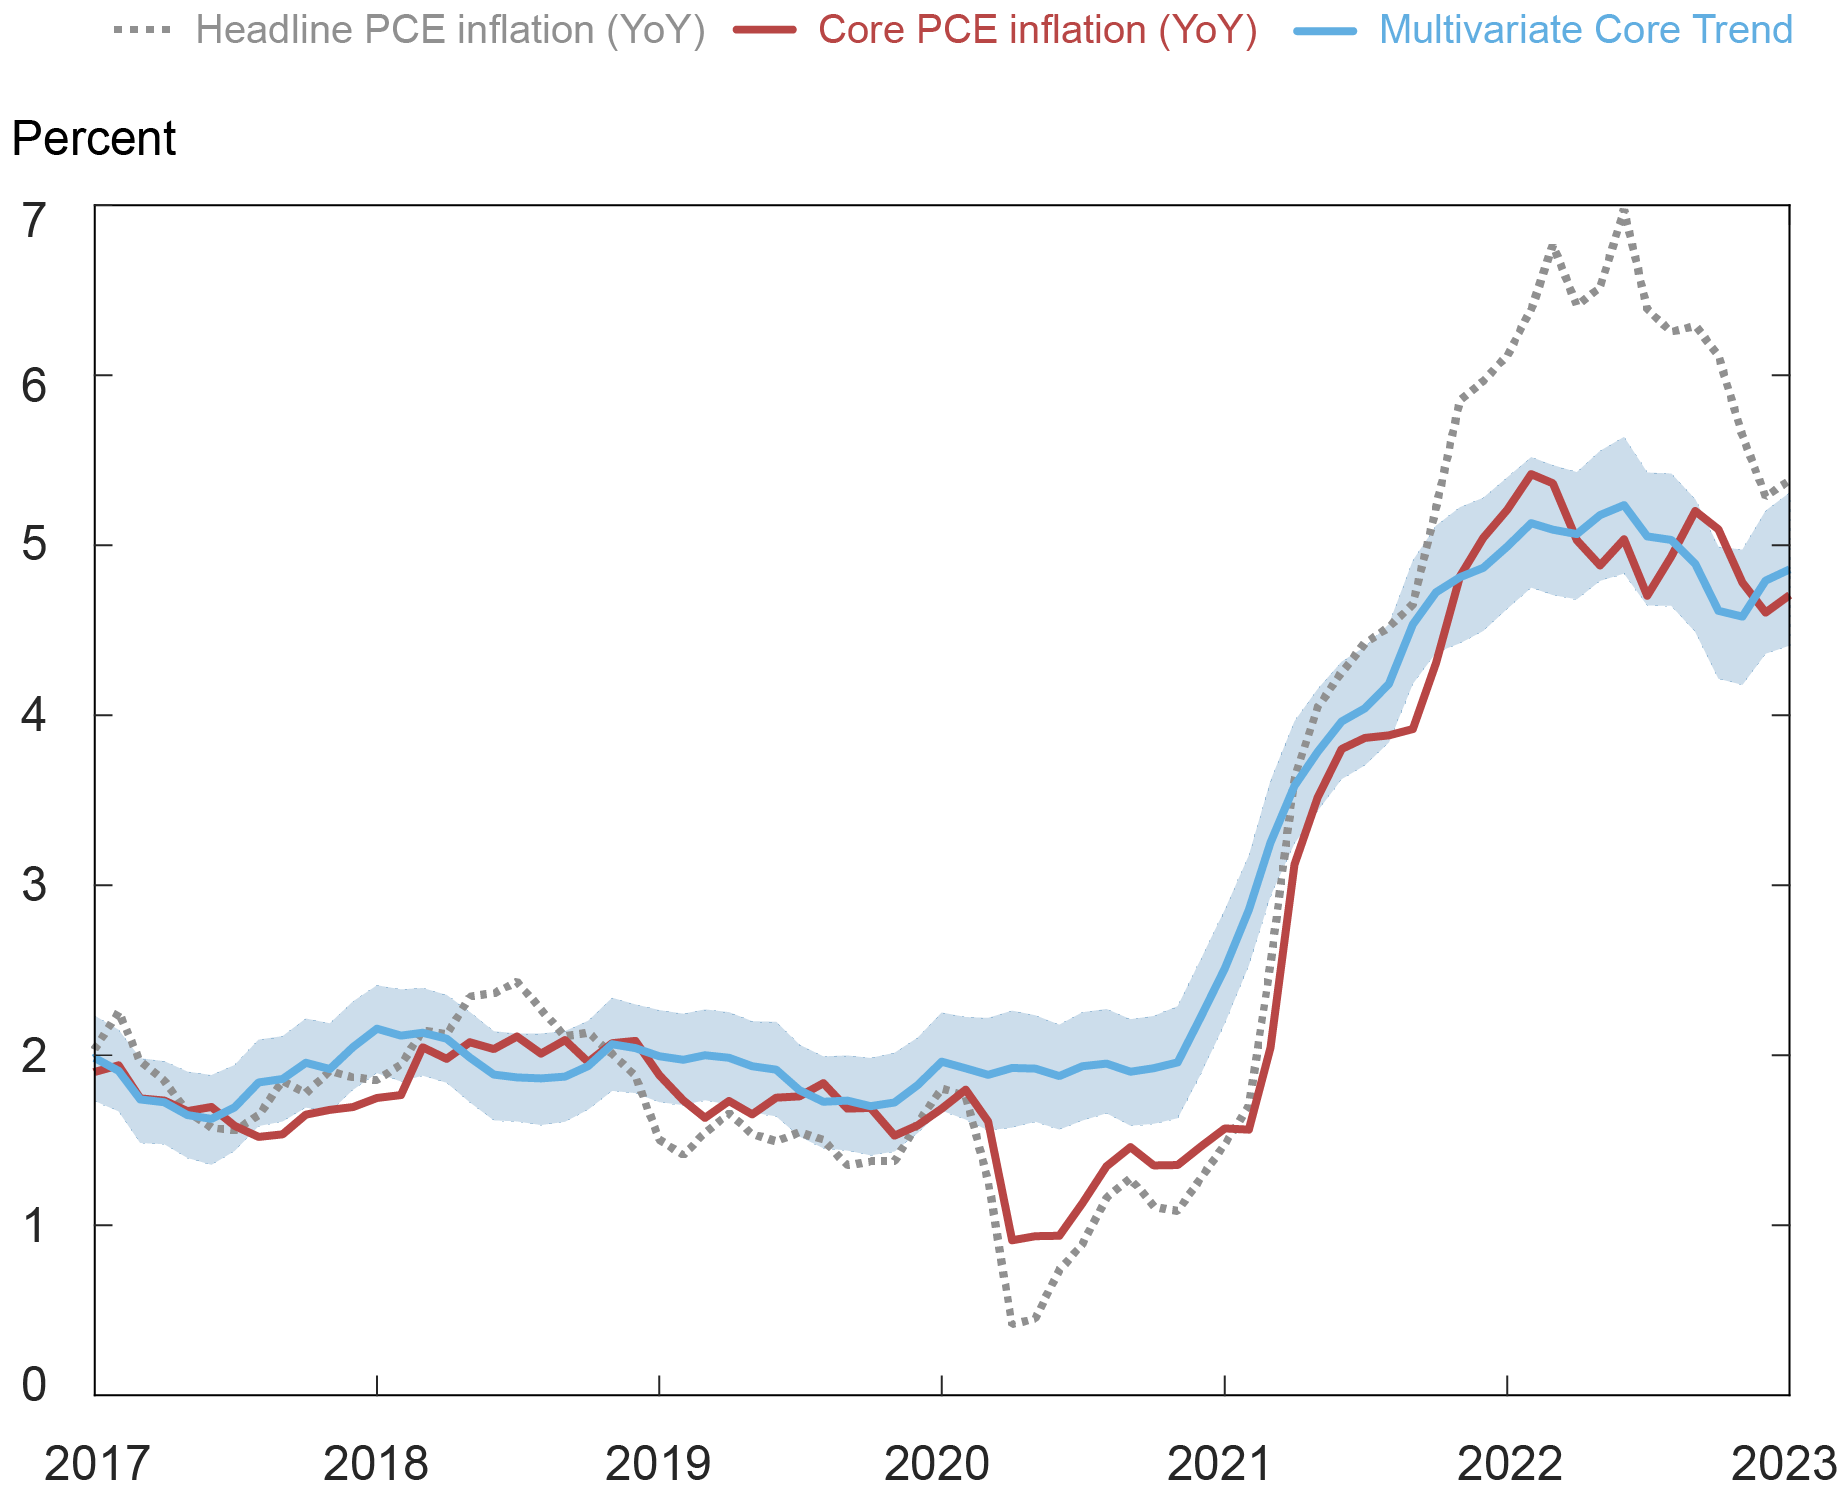
Notes: PCE is personal consumption expenditure. The shaded area is a 68 percent probability band.
The Bureau of Economic Analysis (BEA) release of PCE data for January 2023 included substantial revisions to the price data for the last three months of 2022 (due primarily to revised seasonal adjustment of the Consumer Price Index (CPI) components that underlie much of the PCE price index). Overall, the revisions amounted to an average increase of 0.74 percentage point (ppt) in the monthly annualized core PCE inflation for these three months and were broad-based across sectors. These data revisions and new data for January have led to a reassessment of the estimated inflation persistence as measured by the MCT. While the dynamics of the trend remain roughly the same as estimated prior to the current release—the trend peaks in May/June of 2022 and then declines throughout the third quarter—the MCT level is now higher. What is more, the decline from the mid-year peak is not as pronounced, and rather than plateauing at roughly 3¾ percent, as we reported in February, the trend picked up again in the last two months. What explains this overall increase?
Data Revisions and January Spike Pushed Up the MCT
The new MCT estimates reflect two factors: upward revisions of the fourth-quarter price data and the higher inflation in January. To disentangle the two effects, we compute the MCT estimates that would have been obtained for all the months up to and including December if revised PCE price data for the fourth quarter had been available at the time. These estimates are shown in the gold line in the next chart, where we also report the MCT estimates obtained with pre-revision data (red line, corresponding to the one we reported in our February post). As the chart shows, purely by effect of data revisions for the fourth quarter, our model would have estimated a higher MCT for several of the previous months. Over the three months of October-December, it would have estimated a slower decline in inflation persistence MCT by an average 0.55 ppt and the December estimate would have been 4.3 percent rather than 3.7 percent, as we reported in February. It is worth noting that the BEA data up to September 2022 have not been revised in this release (they will be in September 2023), so the estimated path of inflation persistence before October 2022 may change further.
Revisions Contributed to the Increase in the Multivariate Core Trend (MCT)
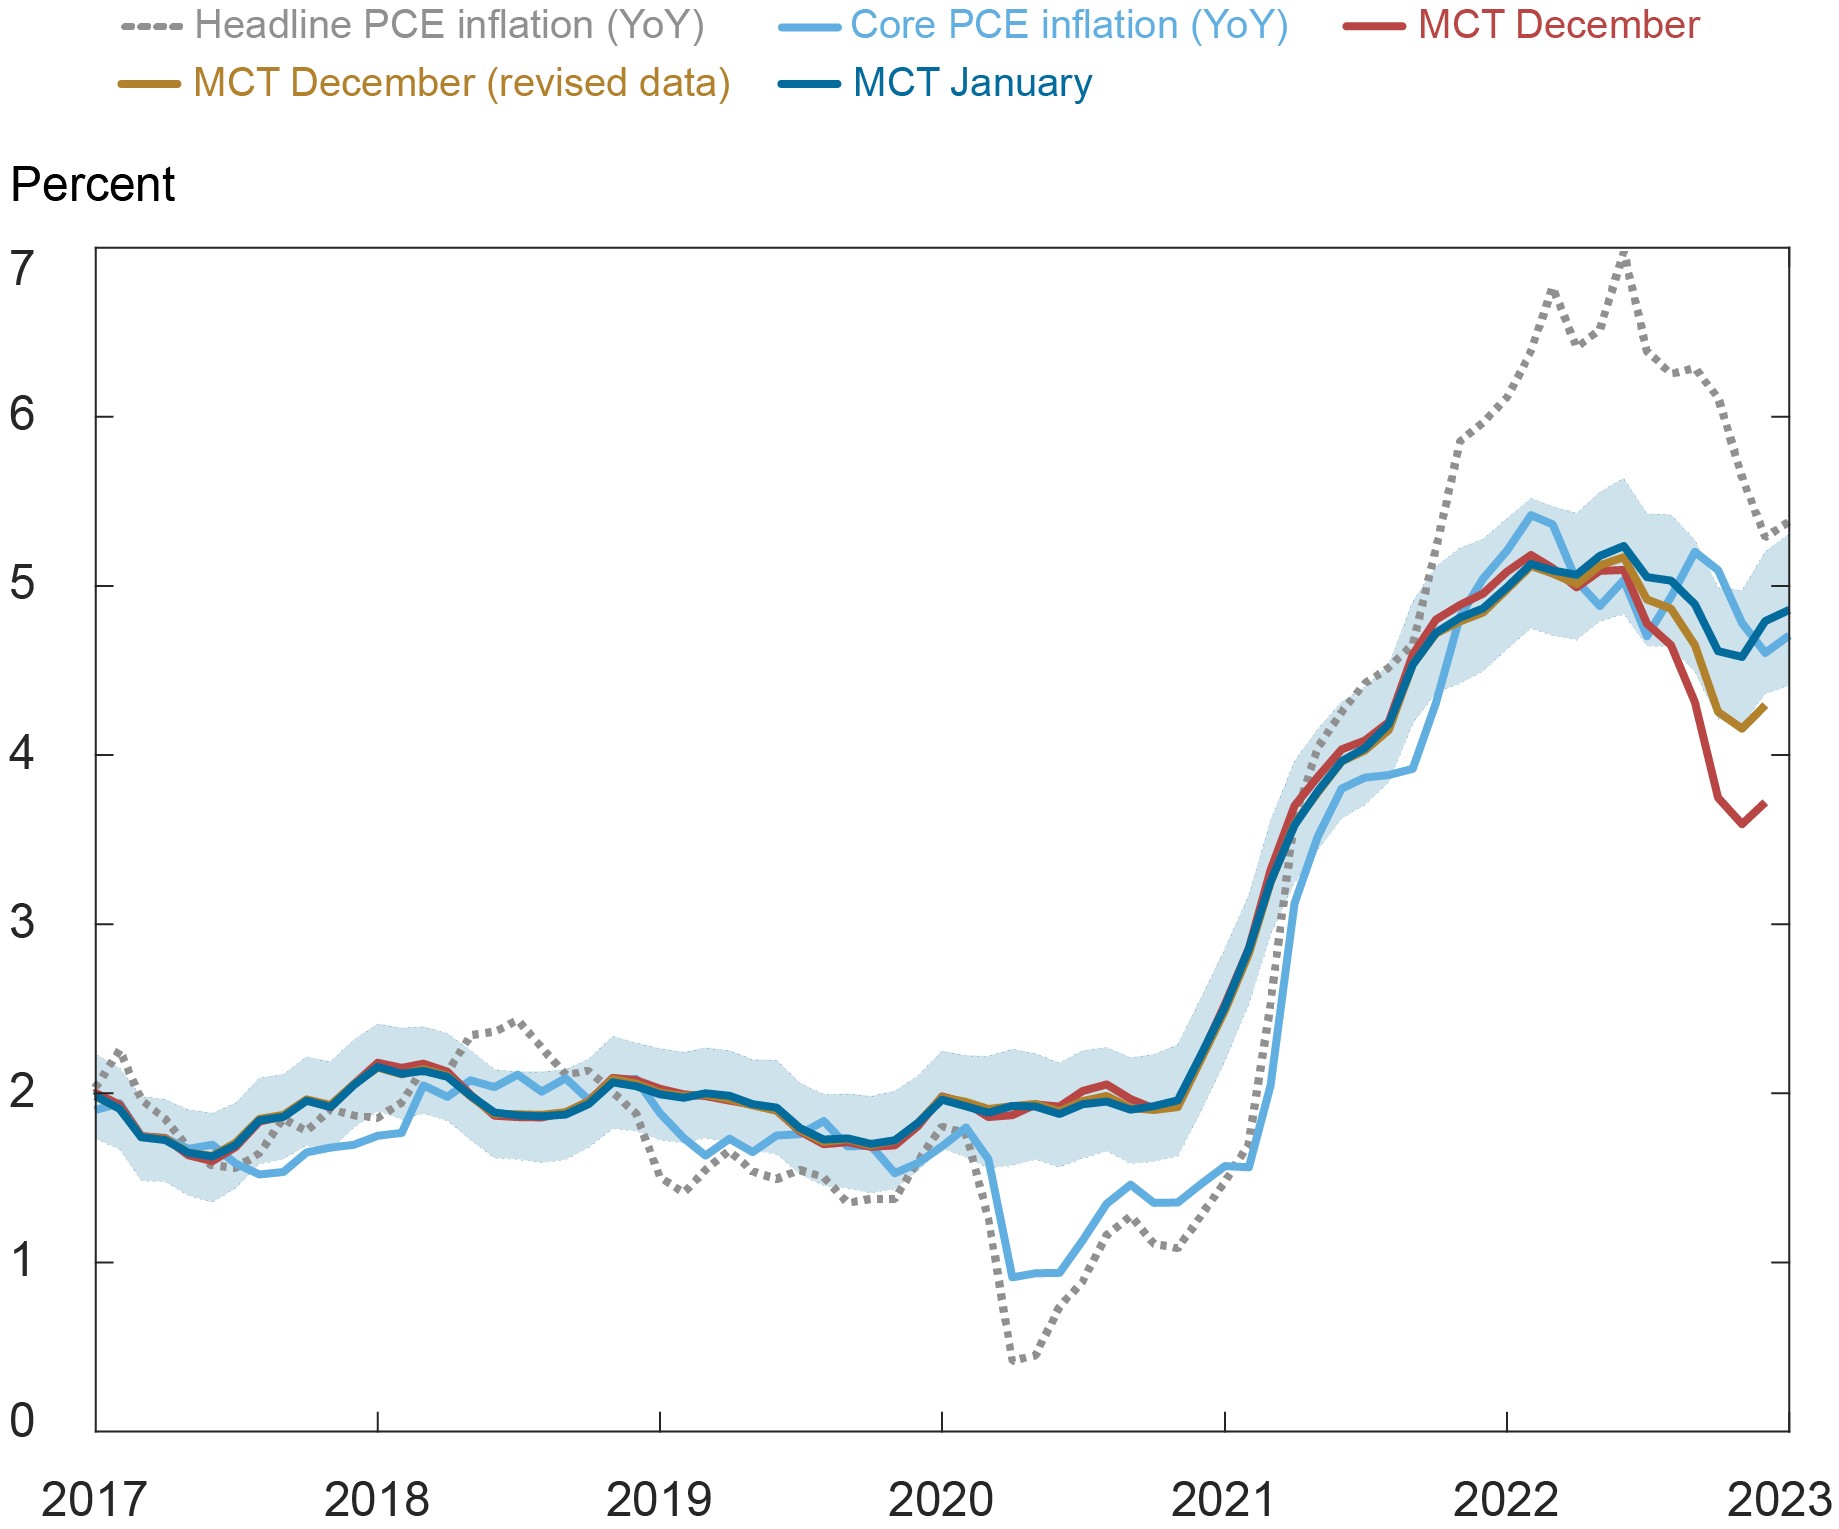
Notes: PCE is personal consumption expenditure. The shaded area is a 68 percent probability band.
In addition to the upward revision of fourth-quarter data, PCE prices accelerated in January, with both headline and core measures up 0.6 percent in the month, moving up further our model’s assessment of inflation persistence. From the chart, the blue line of current MCT lies above the gold line since mid-2022, indicating that January’s inflation reading led to firmer estimated inflation persistence beyond what can be attributed to fourth-quarter data revisions alone. Quantitatively, over the October-December 2022 period, the MCT is higher by about 0.42 ppt on average. The January MCT is 4.9 percent, 0.1 ppt higher than the December estimate.
Moreover, the recent increase in inflation persistence is driven primarily by the common trend component, with the sector-specific trend even down a bit in January, as we discuss next.
A Sectoral Lens: A Broad-Based Rise among Core Goods and Non-Housing Services
Looking at the sectors, the January MCT provides a quite different narrative for the recent dynamics of inflation persistence relative to what we had prior to the new release. The pickup in the MCT in the last two months has been driven in roughly equal parts by the core goods and core services ex-housing components: relative to their pre-pandemic averages, core goods trend is about 0.9 ppt higher and core services ex-housing is 1.1 ppts higher, as shown in the next chart. By contrast, the contribution of housing inflation, while still elevated, appears to have stabilized in the more recent months at around 1 ppt above the pre-pandemic average. For the month of January, core goods and core service ex-housing added 0.14 ppt to the MCT while housing subtracted 0.07 ppt.
Inflation Trend Decomposition: Sector Aggregates
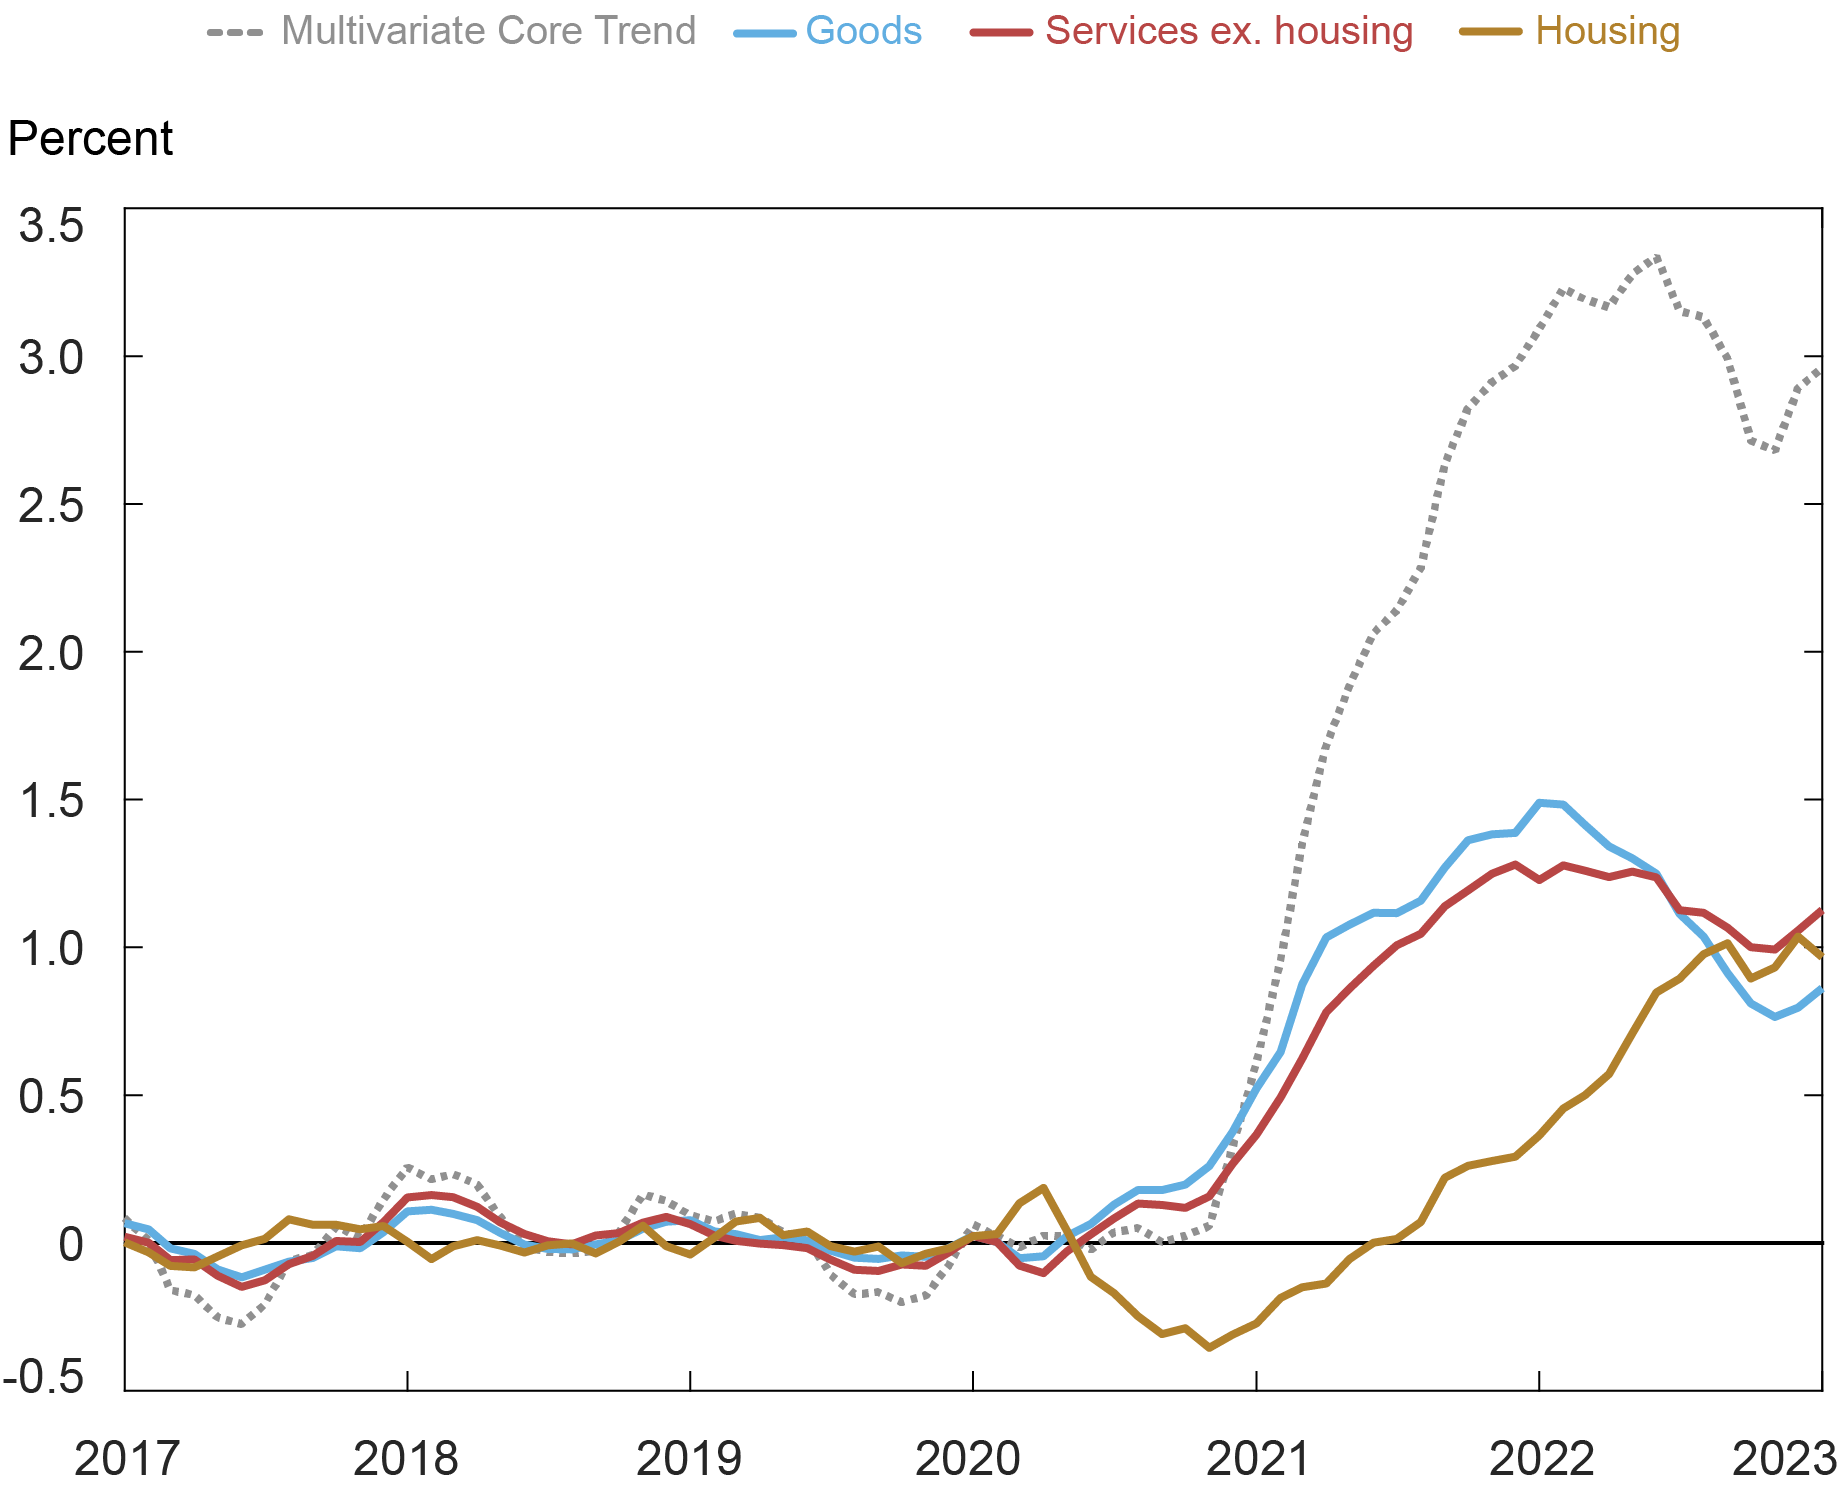
Note: The base for the calculations of the contributions to the change in the Multivariate Core Trend is the average over the period January 2017-December 2019.
On a finer detail, the source of inflation persistence continues to be almost all sector-specific for the housing sector, while core goods and services ex-housing are dominated by the common component, with their sector-specific components playing a small role and moving in opposite directions, as shown in the chart below.
Finer Inflation Trend Decomposition
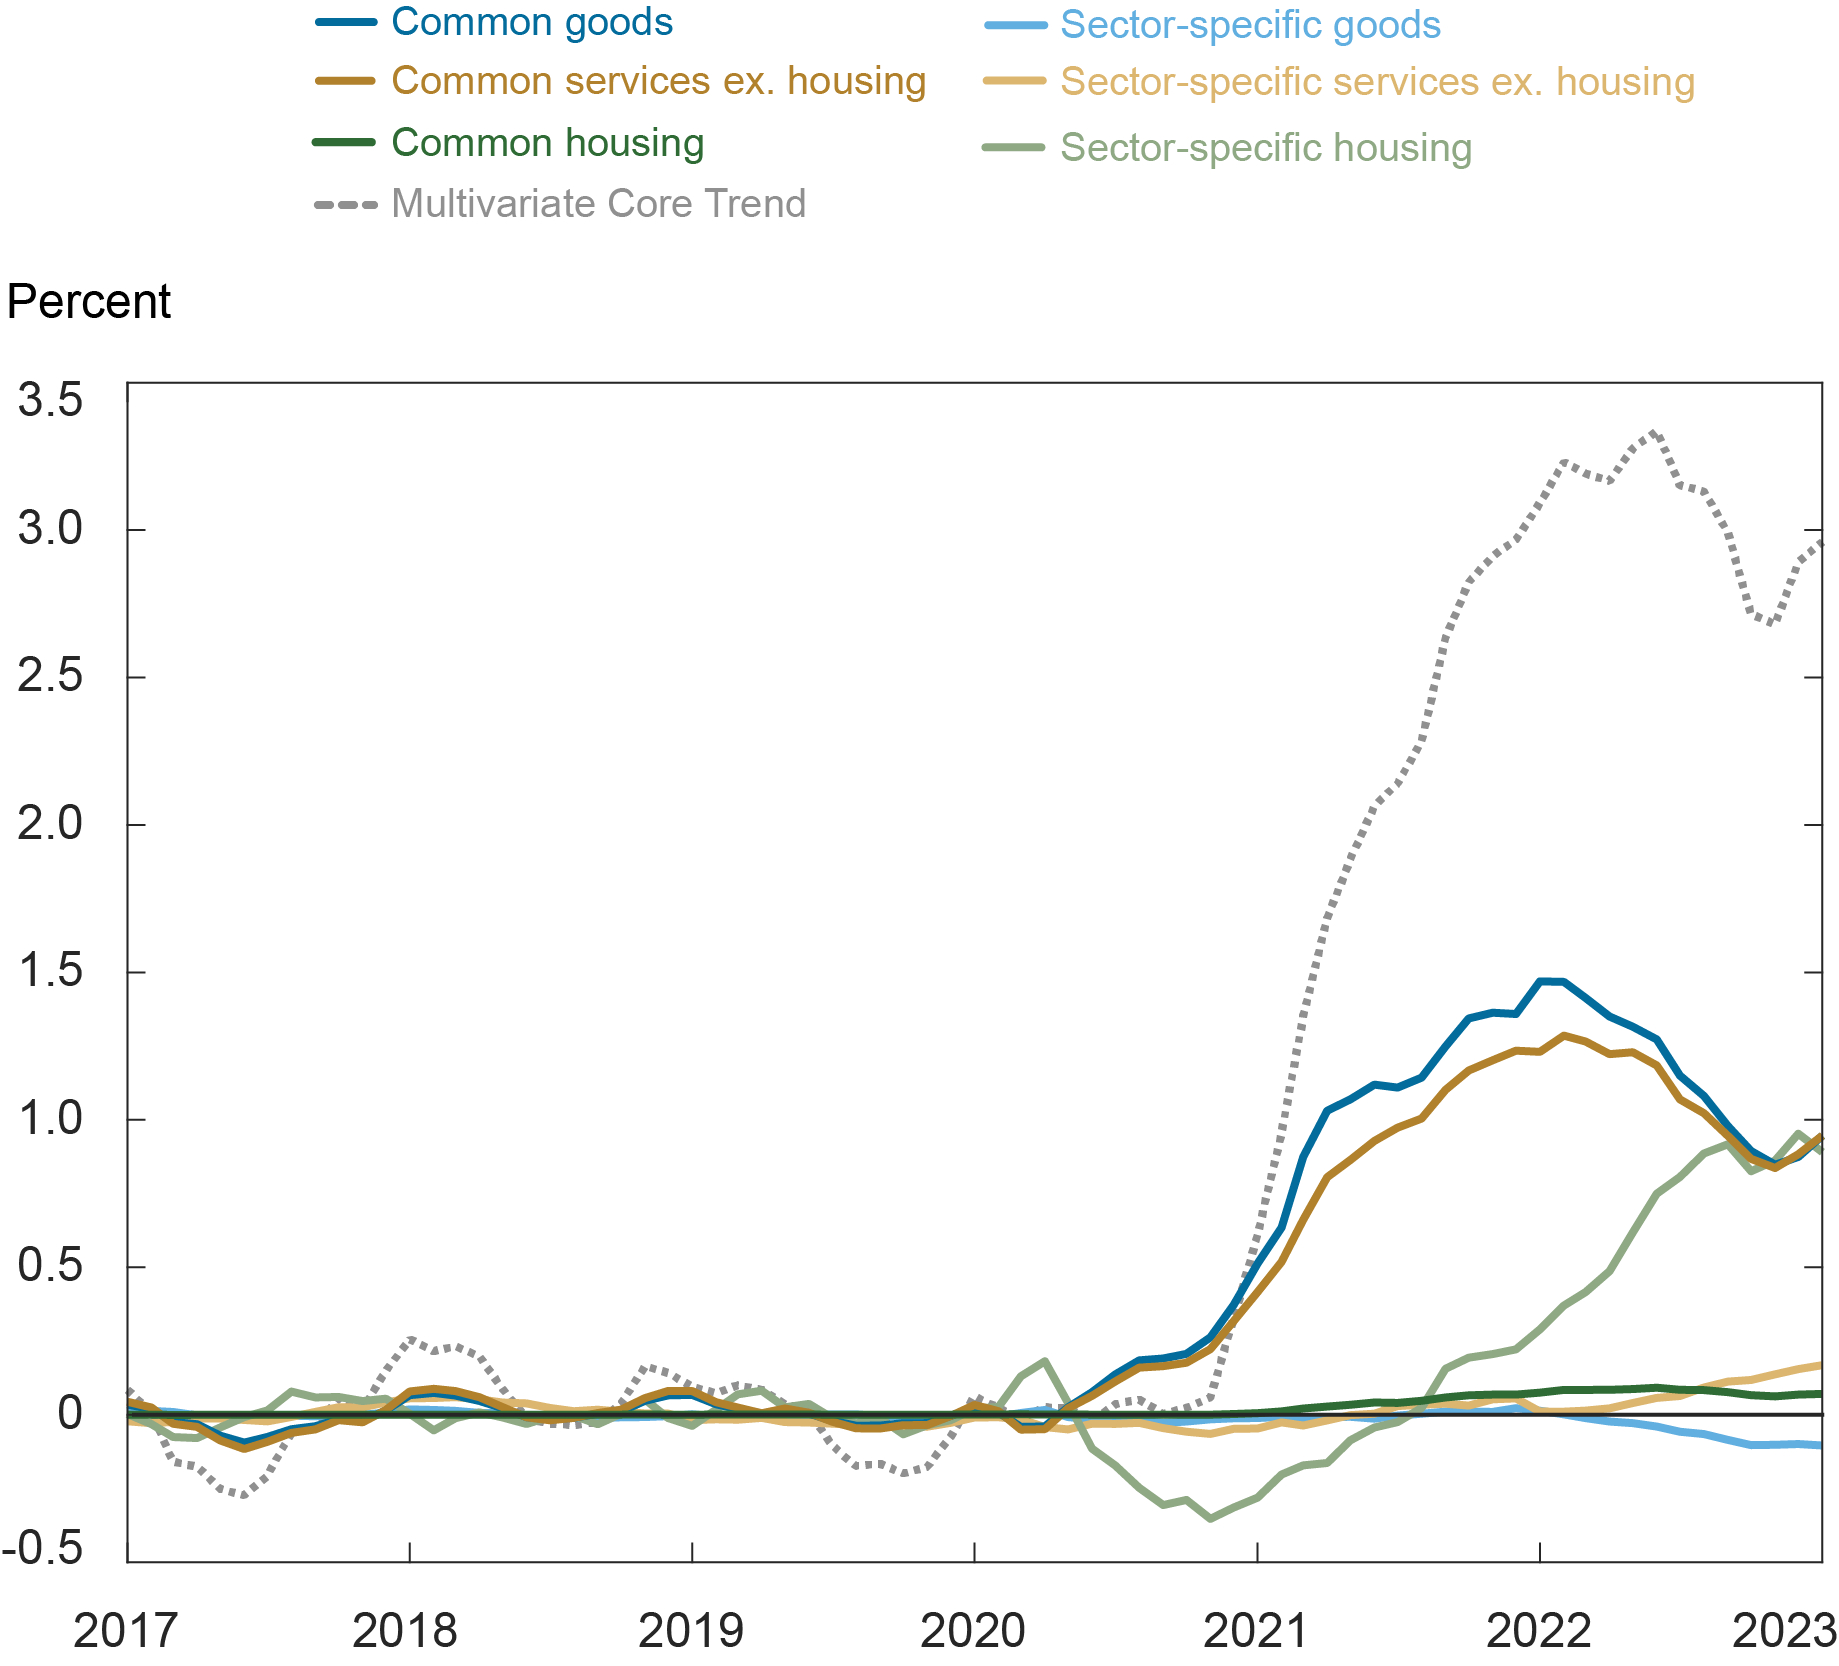
Note: The base for the calculations of the contributions to the change in the Multivariate Core Trend is the average over the period January 2017-December 2019.
Conclusion
To sum up, the PCE price data released for January have shown a broad-based resilience in inflation persistence. We will provide a new update of the MCT and its sectoral insights after the release of February PCE price data.

Martín Almuzara is a research economist in Macroeconomic and Monetary Studies in the Federal Reserve Bank of New York’s Research and Statistics Group.

Argia Sbordone is the head of Macroeconomic and Monetary Studies in the Federal Reserve Bank of New York’s Research and Statistics Group.
How to cite this post:
Martin Almuzara and Argia Sbordone, “Inflation Persistence: Dissecting the News in January PCE Data,” Federal Reserve Bank of New York Liberty Street Economics, March 9, 2023, https://libertystreeteconomics.newyorkfed.org/2023/03/inflation-persistence-dissecting-the-news-in-january-pce-data/
BibTeX: View |


Disclaimer
The views expressed in this post are those of the author(s) and do not necessarily reflect the position of the Federal Reserve Bank of New York or the Federal Reserve System. Any errors or omissions are the responsibility of the author(s).
 RSS Feed
 Follow Liberty Street Economics