


Thirty-one percent of housing units in the United States are rental units, and rental housing is unique because unlike in the case of homeownership, renters rely on the property owner for maintenance spending. From the property owner’s perspective, building maintenance is an important investment necessary to keep the asset in good condition. However, like all investments, it is only possible to maintain a building with sufficient financial resources. In a recent staff report, I examine the relationship between a building’s financing constraints and its maintenance. I find that financially constrained buildings, colloquially “broke,” tend to be less well maintained.
Measuring Building Maintenance
To identify poor building maintenance, I rely on the fact that most American cities legally require property owners to provide their tenants with a minimal quality of property maintenance, known as the “warrant of habitability.” To enforce this standard, cities create housing codes detailing the minimally acceptable maintenance standards for an apartment. If the city learns a building does not abide by these standards, it issues the building a housing code violation. For this reason, code violations can be seen as an indication of poor building maintenance. I exploit hand-collected data on housing code violations from forty-five cities throughout the United States. Additionally, some cities data provide a description of each violation, allowing me to separately analyze violations requiring repairs. Examining the violations requiring repairs provides extra assurance that the violations I measure capture the owner’s failure to properly maintain a building.
These data are combined with information on apartment buildings’ mortgage loan-to-value (LTV) ratios at origination. These ratios are highly correlated with how high an apartment building’s debt payments are relative to the asset’s value and are therefore an informative proxy for the existence of financing constraints at the apartment-building level.
Correlation between Building Financing Constraints and Maintenance
Using these data, I conduct two tests to understand whether financing constraints drive building owners to maintain their buildings less. First, I ask whether buildings with higher LTV ratios at mortgage origination tend to have more code violations than very similar buildings located in the same zip code. Ultimately, I find that they do. Specifically, I find that a one standard deviation increase in a building’s LTV ratio at issuance is associated with a 9.7 percentage point increase in violations relative to the sample mean, or 0.1 more code violations, for that building. Even when only looking at violations requiring repairs, buildings with higher LTV-ratio mortgages also tend to have more violations, providing reassurance that the analysis truly captures a failure to maintain the building.
While these initial tests provide evidence that buildings with higher LTV-ratio mortgages have more code violations, these results are not causal. There are significant differences in LTV ratios by zip code across New York City, illustrated in the chart below. This is because these different zip codes have traits making it more or less likely for owners of properties in those zip codes to take on large mortgages. These traits may also simultaneously make property owners more or less likely to maintain their buildings. Because of these unobservable characteristics, I need a natural experiment that changes building financing constraints while not affecting the other traits the building has that could affect their maintenance spending.
Mortgage LTV Ratios Differ Significantly across Zip Codes
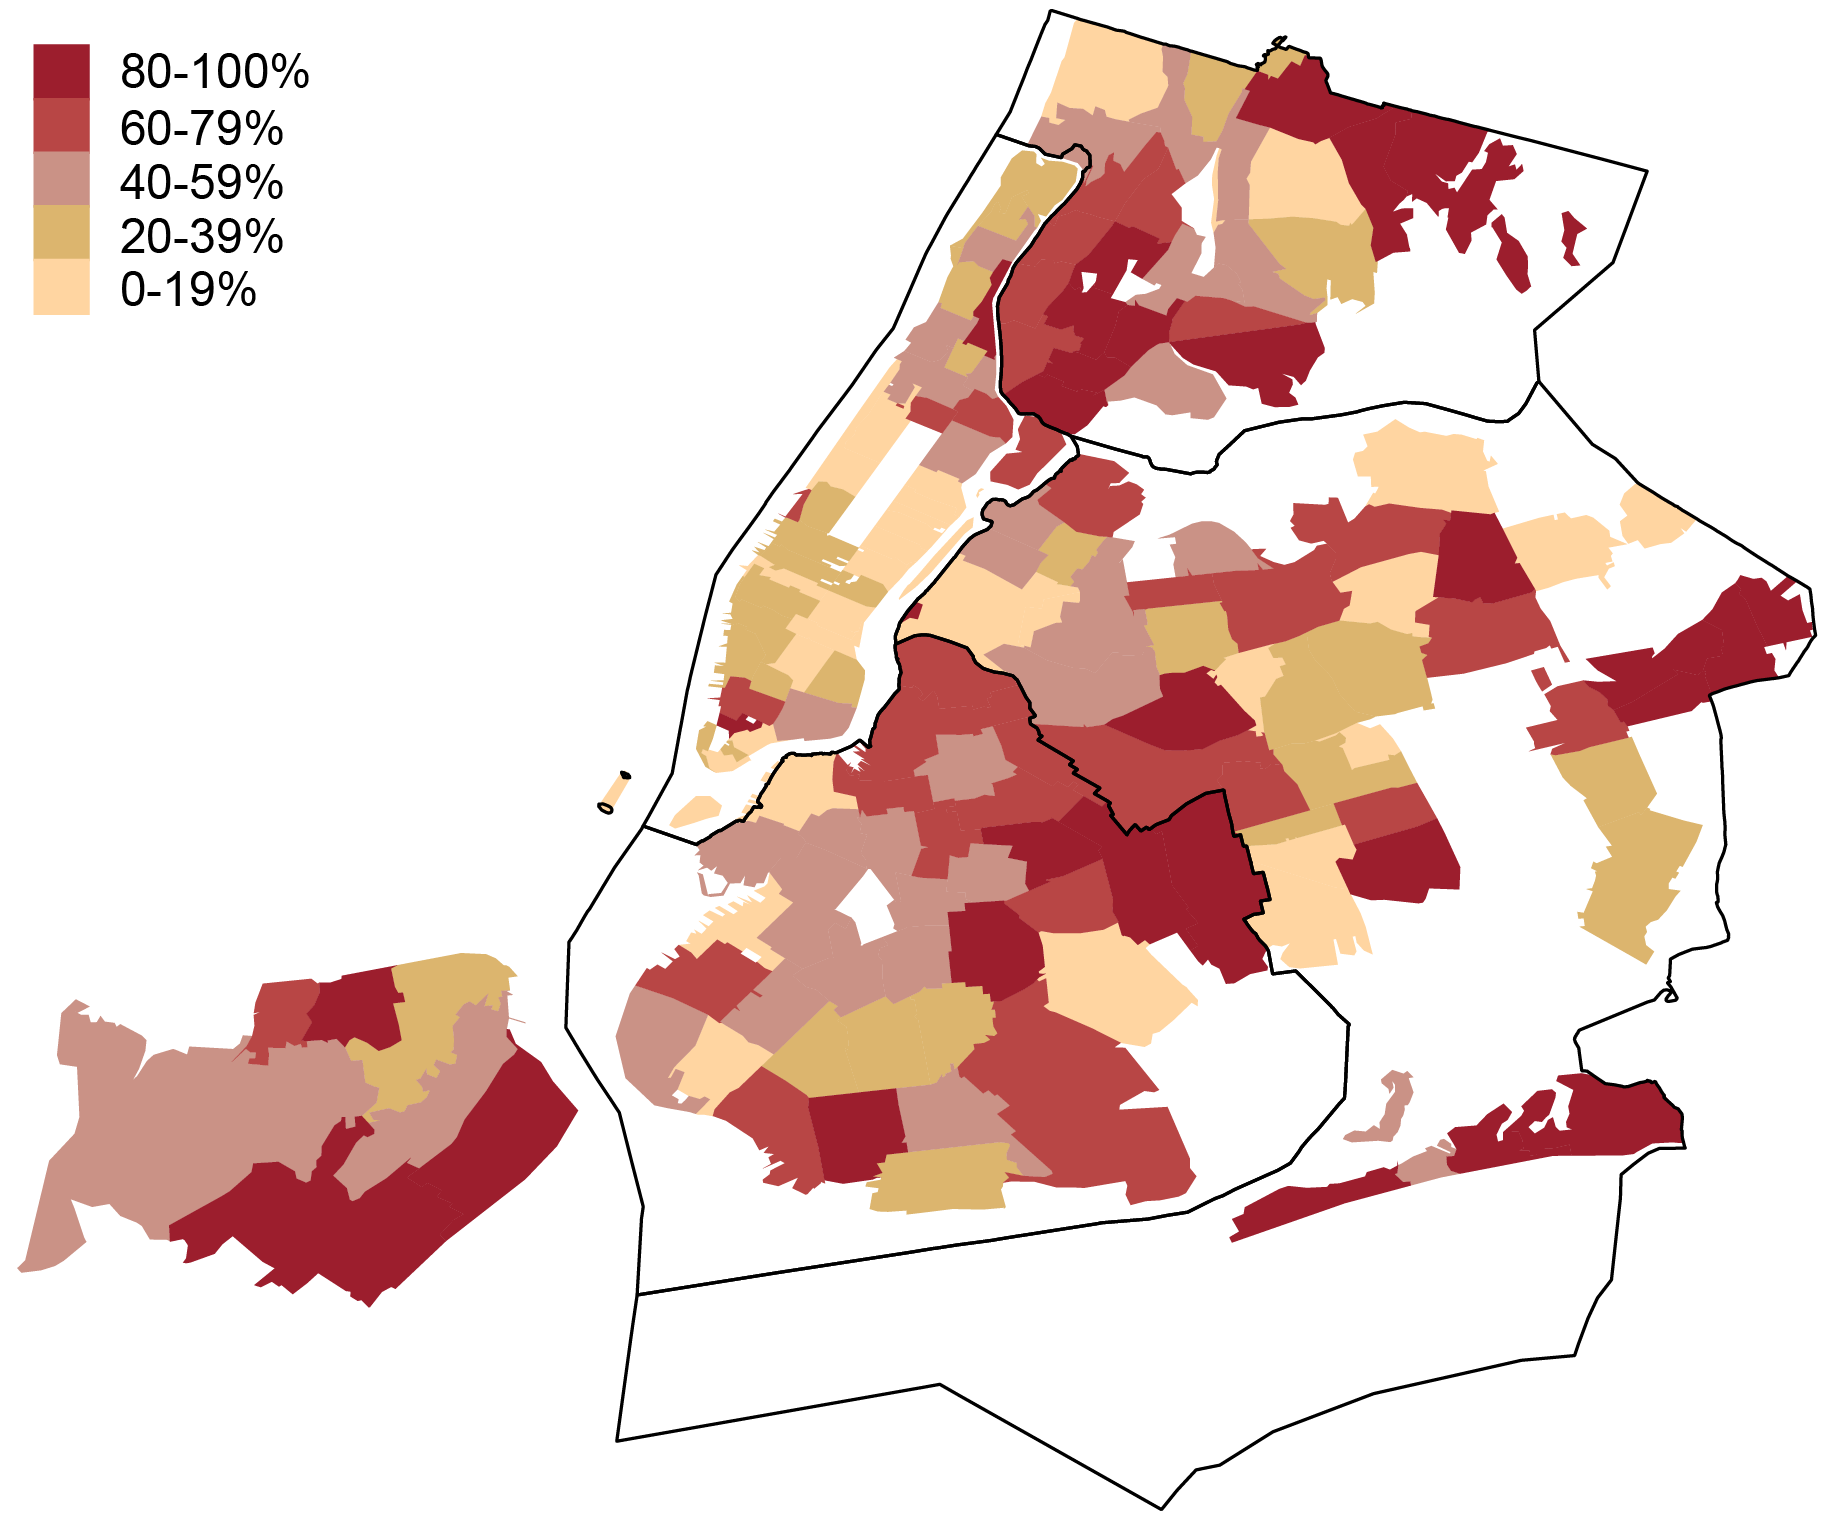
Note: Values are average mortgage loan-to-value (LTV) ratios within each zip code.
A Natural Experiment Arises
Such an experiment is available in a change to New York City rent laws from 2011. About 1 million buildings in New York City are rent-stabilized, meaning the building owner can only increase rents as high as the Rent Stabilization Board allows. However, landlords are allowed to increase their rent more when they make major improvements that could increase the value of the building. Before 2011, landlords could increase their monthly rents by one-fortieth of the value of the improvements. However, the New York Rent Act of 2011 decreased this amount to one-sixtieth of the value of the improvements, reducing the cash available to affected landlords to make repairs. Interestingly, this law only applied to rent-stabilized buildings with more than thirty-five units, allowing me to compare changes in code violations after the law passed for buildings above and below that threshold.
Indeed, I find that code violations increased for buildings with more than thirty-five units relative to those with thirty-five or fewer. Specifically, after the law passed, the average rent-stabilized building with more than thirty-five units had an increase of 3.76 code violations relative to the control group (rent-stabilized buildings with thirty-five or fewer units). I separately examine buildings that had high levels of debt prior to the passage of the law, and find that the effect is strongest for buildings with high levels of debt. At the same time, there was almost no effect for buildings with very little debt. Based on these findings, it appears that the Rent Act led to an increase in housing code violations, which was driven by the reduction in financial resources for building owners after the law passed.
Key Implications
To summarize, the findings in this paper show that financially constrained apartment buildings tend to be less well maintained. This analysis highlights that when building owners don’t have sufficient access to financing, there can be negative consequences for renters. These consequences can be especially acute since it is often not ideal for a tenant to move to a new unit, as that may mean changing school districts and losing access to neighborhood amenities and social-network ties. This makes it likely that renters bear much of the costs from building financing constraints in the form of worse building maintenance.

Lee Seltzer is a financial research economist in Climate Risk Studies in the Federal Reserve Bank of New York’s Research and Statistics Group.
How to cite this post:
Lee Seltzer, “Is Your Apartment Breaking because Your Landlord Is Broke?,” Federal Reserve Bank of New York Liberty Street Economics, March 10, 2023, https://libertystreeteconomics.newyorkfed.org/2023/03/is-your-apartment-breaking-because-your-landlord-is-broke/
BibTeX: View |

Disclaimer
The views expressed in this post are those of the author(s) and do not necessarily reflect the position of the Federal Reserve Bank of New York or the Federal Reserve System. Any errors or omissions are the responsibility of the author(s).
 RSS Feed
 Follow Liberty Street Economics