


Editor’s note: We have updated the “date of forecast” row in the forecast comparison table to display the correct year (2023, not 2024). (September 25, 2023, 5:01 p.m.)

This post presents an update of the economic forecasts generated by the Federal Reserve Bank of New York’s dynamic stochastic general equilibrium (DSGE) model. We describe very briefly our forecast and its change since March 2023.
As usual, we wish to remind our readers that the DSGE model forecast is not an official New York Fed forecast, but only an input to the Research staff’s overall forecasting process. For more information about the model and variables discussed here, see our DSGE model Q & A.
The New York Fed model forecasts use data released through 2023:Q1, augmented for 2023:Q2 with the median forecasts for real GDP growth and core PCE inflation from the Survey of Professional Forecasters (SPF), as well as the yields on 10-year Treasury securities and Baa-rated corporate bonds based on 2023:Q2 averages up to May 26. Moreover, starting in 2021:Q4, the expected federal funds rate between one and six quarters into the future is restricted to equal the corresponding median point forecast from the latest available Survey of Primary Dealers (SPD) in the corresponding quarter. The current projection can be found here.
The change in the forecast relative to March is very substantial. Output growth is projected to be much higher throughout the forecast horizon than in March (1.0, 0.7, and 0.4 percent in 2023, 2024, and 2025 versus 0.2, 0.0, and 0.0 in March, respectively). The probability of a not-so-soft landing, defined as four-quarter GDP growth dipping below -1 percent, by the end of 2023 has declined to 26 percent from 41 percent in March and 70 percent last September. Inflation projections are a bit higher in 2023, due to the fact that inflation in Q1 has once more surprised to the upside relative to the SPF forecasts in February but is otherwise considerably lower than projected in March: 2.5 percent in 2024 and 2.2 percent in 2025 versus 3.0 and 2.9 in March. According to the new forecast, inflation returns close to the FOMC’s long-run goal by the end of 2025.
This fairly dramatic change in the forecasts is mostly due to one new piece of information: SPF long-term inflation expectations have dropped by about 45 basis points in 2023:Q1 relative to 2022:Q4, a very large change by historical standards. The model interprets this change in long run inflation expectations as resulting from higher expected total factor productivity (TFP) growth, which rationalizes both the lower inflation and the higher output projections. Were it not for this data point, output and inflation projections would be a lot closer to those in March, with inflation actually a bit stronger throughout the horizon and output growth higher only in the short term. While the dependence of the forecast on one data point makes us uncomfortable, we chose to follow standard practice and incorporate it in the projections. Nonetheless, this dependence should be kept in mind.
While output is now expected to grow more rapidly than was projected in March, it fails to keep pace with the even more rapid growth in potential output due to stronger TFP growth. As a result, the output gap falls from a positive value in 2023 (1.3 percent) to -0.4 percent in 2025. Not surprisingly, the real natural rate of interest is also projected to be higher than in March, reaching 2.2 percent in 2023 and declining to 1.8 in 2024 and 1.5 in 2025.
| Forecast Period | 2023 | 2024 | 2025 | 2026 | ||||
|---|---|---|---|---|---|---|---|---|
| Date of Forecast | Jun 23 | Mar 23 | Jun 23 | Mar 23 | Jun 23 | Mar 23 | Jun 23 | Mar 23 |
| GDP growth (Q4/Q4) | 1.0 (-1.9, 4.0) | 0.2 (-3.7, 4.1) | 0.7 (-4.2, 5.7) | 0.0 (-5.0, 4.9) | 0.4 (-4.7, 5.5) | 0.0 (-5.2, 5.2) | 0.9 (-4.5, 6.3) | 0.5 (-5.1, 6.2) |
| Core PCE inflation (Q4/Q4) | 3.7 (3.3, 4.2) | 3.5 (2.9, 4.1) | 2.5 (1.6, 3.3) | 3.0 (2.2, 3.9) | 2.2 (1.2, 3.1) | 2.9 (2.0, 3.9) | 2.1 (1.1, 3.2) | 3.0 (1.9, 4.1) |
| Real natural rate of interest (Q4) | 2.2 (1.0, 3.5) | 2.0 (0.7, 3.3) | 1.8 (0.3, 3.2) | 1.7 (0.1, 3.2) | 1.5 (-0.1, 3.0) | 1.4 (-0.2, 3.0) | 1.3 (-0.4, 3.0) | 1.3 (-0.4, 2.9) |
Notes: This table lists the forecasts of output growth, core PCE inflation, and the real natural rate of interest from the June 2023 and March 2023 forecasts. The numbers outside parentheses are the mean forecasts, and the numbers in parentheses are the 68 percent bands.
Forecasts of Output Growth
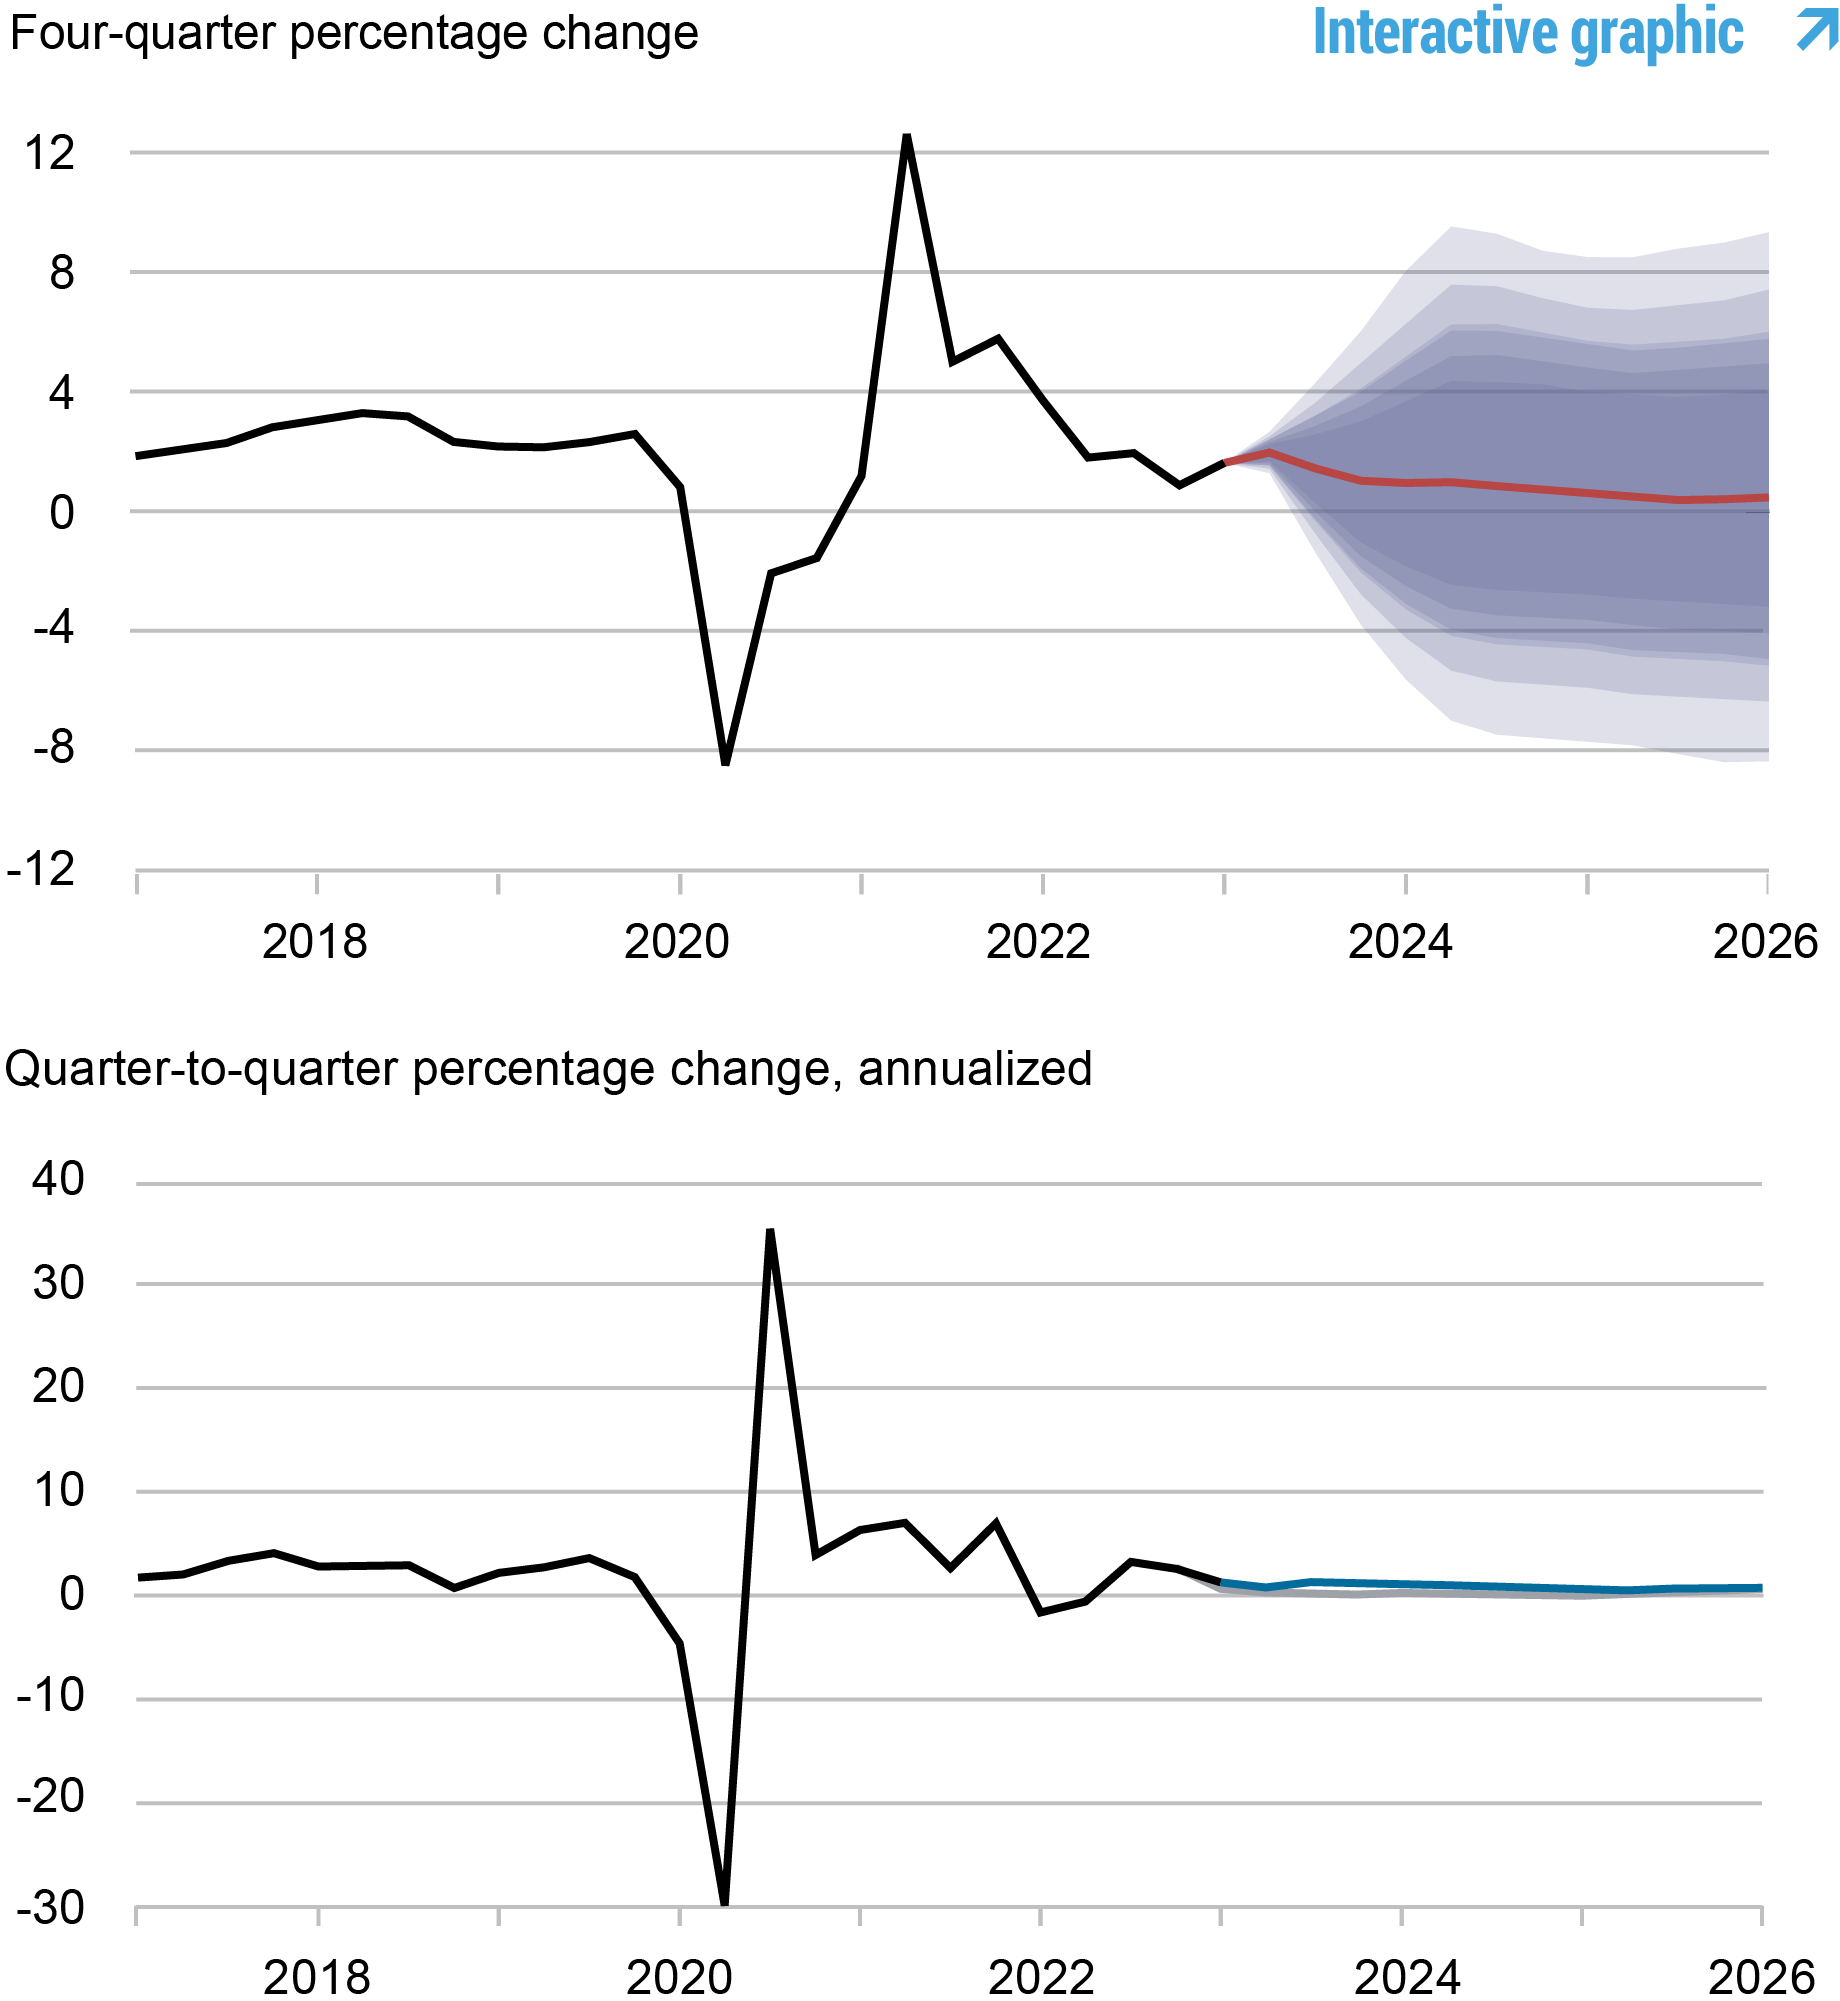
Source: Authors’ calculations.
Notes: These two panels depict output growth. In the top panel, the black line indicates actual data and the red line shows the model forecasts. The shaded areas mark the uncertainty associated with our forecasts at 50, 60, 70, 80, and 90 percent probability intervals. In the bottom panel, the blue line shows the current forecast (quarter-to-quarter, annualized), and the gray line shows the March 2023 forecast.
Forecasts of Inflation
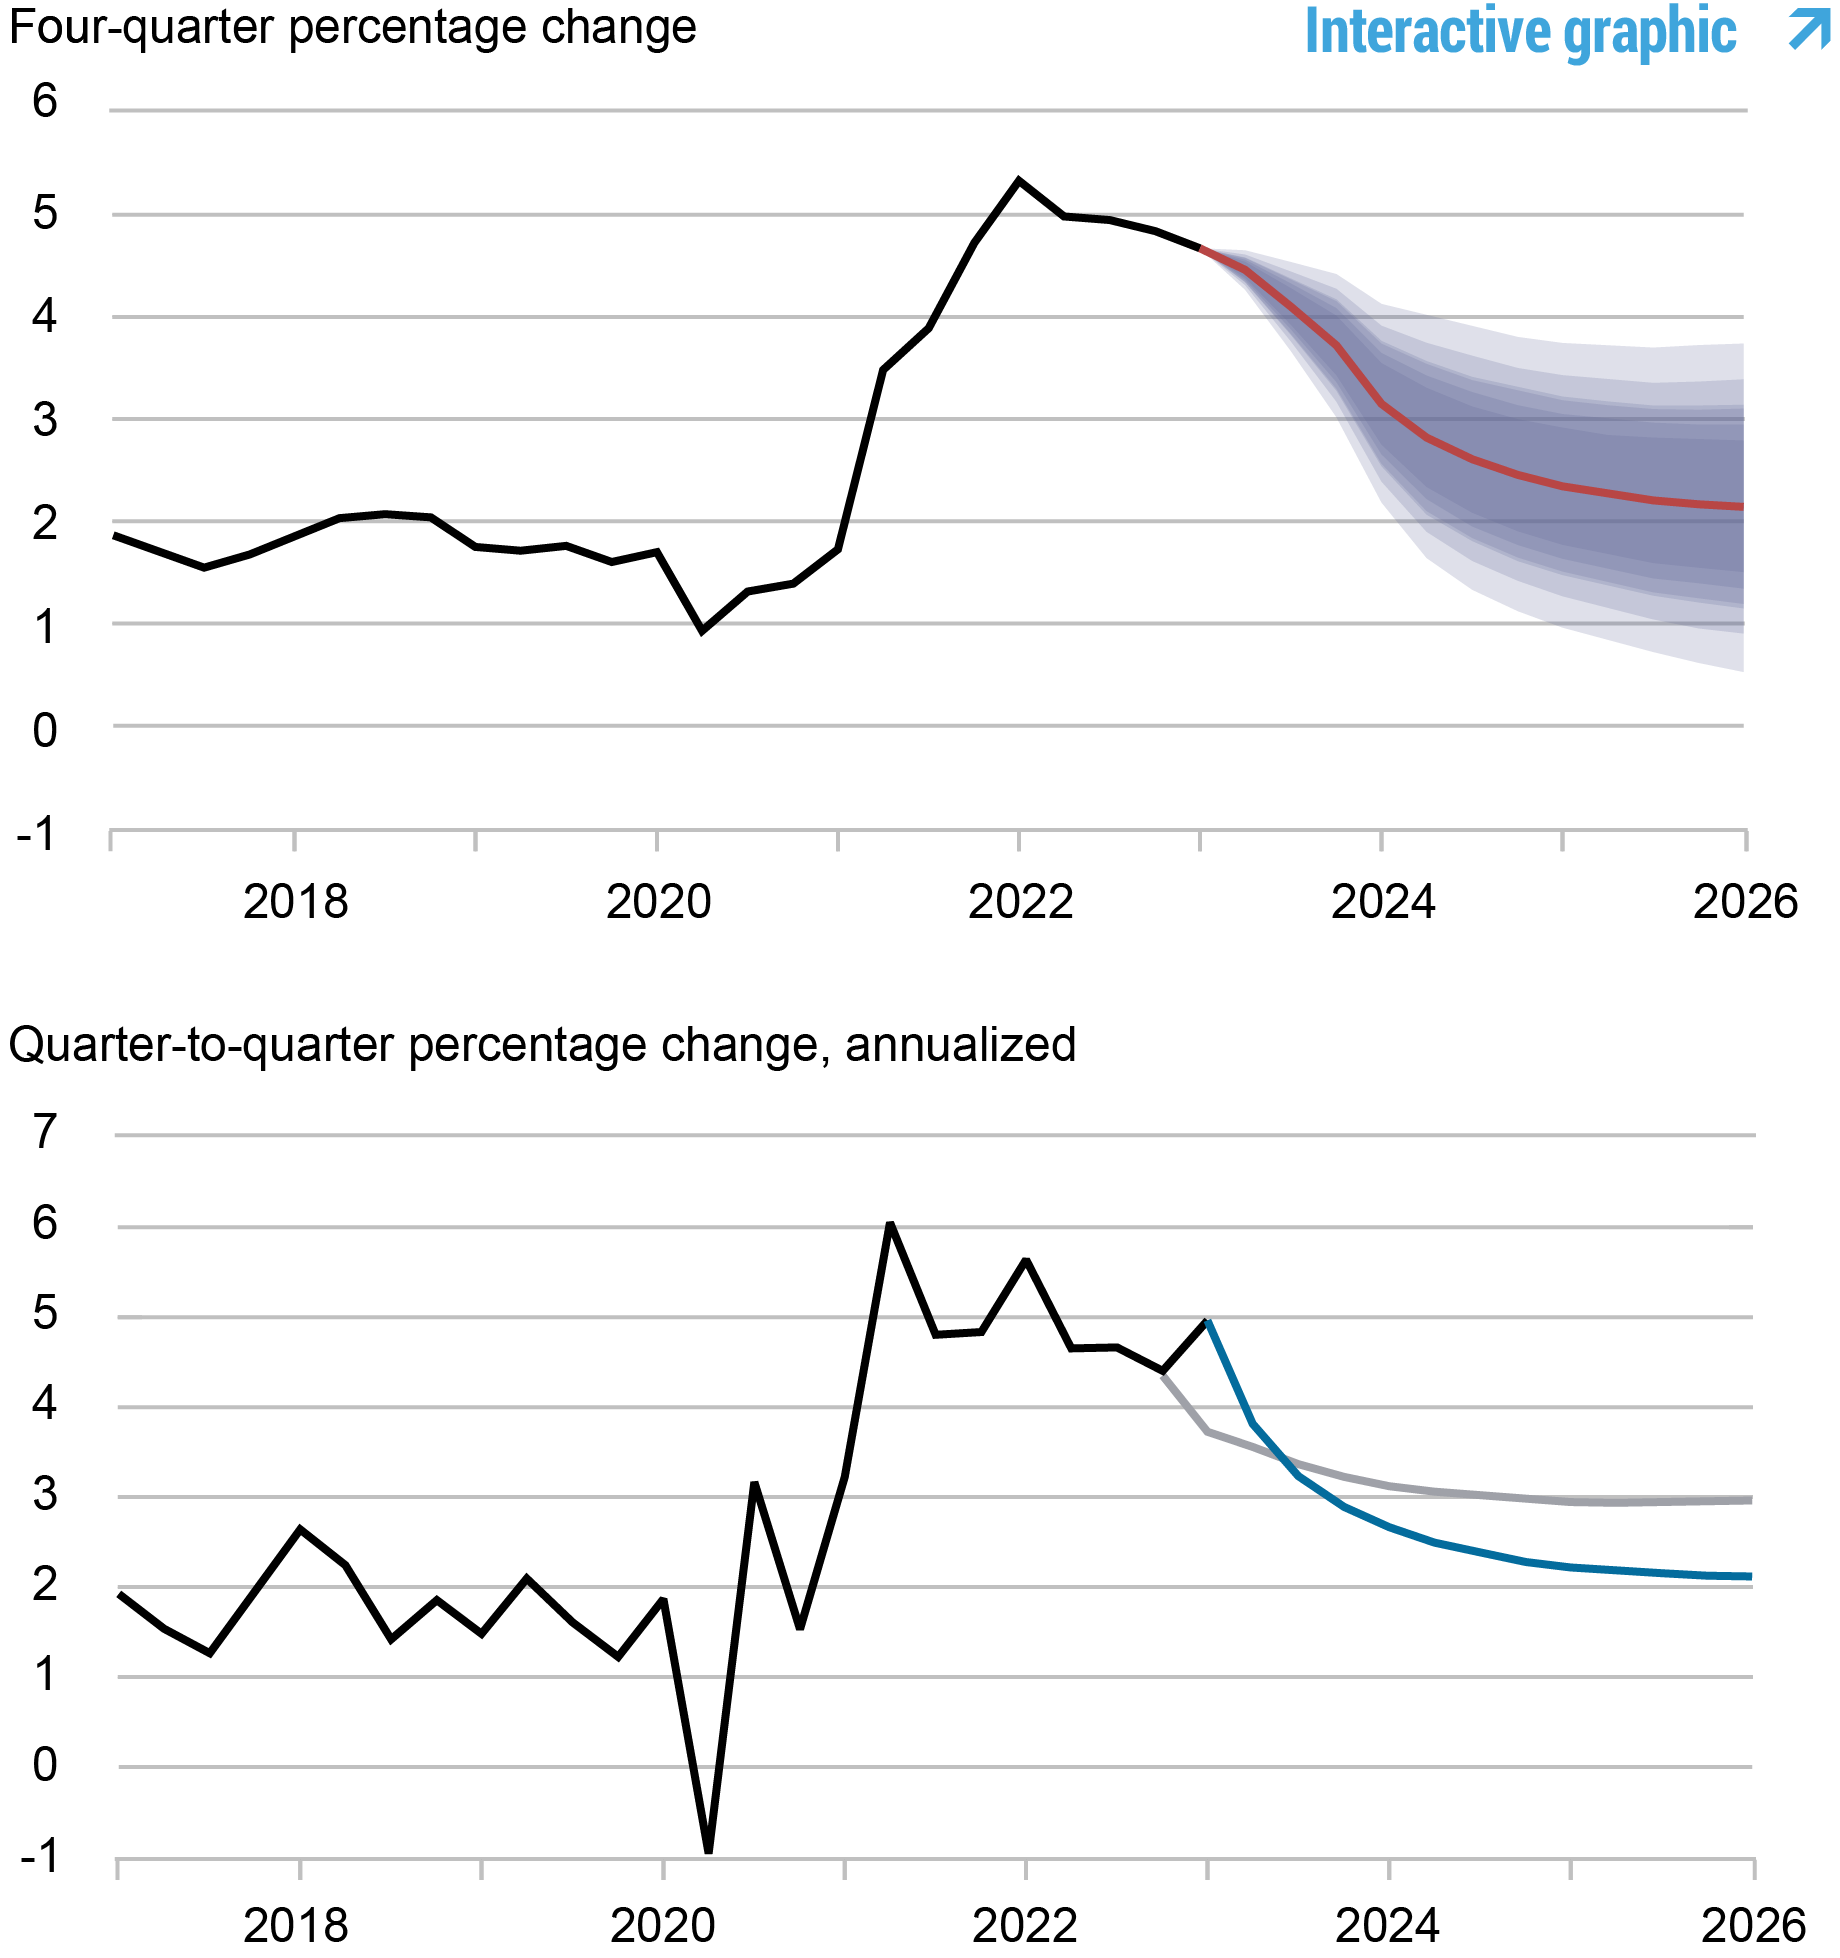
Source: Authors’ calculations.
Notes: These two panels depict core personal consumption expenditures (PCE) inflation. In the top panel, the black line indicates actual data and the red line shows the model forecasts. The shaded areas mark the uncertainty associated with our forecasts at 50, 60, 70, 80, and 90 percent probability intervals. In the bottom panel, the blue line shows the current forecast (quarter-to-quarter, annualized), and the gray line shows the March 2023 forecast.
Real Natural Rate of Interest
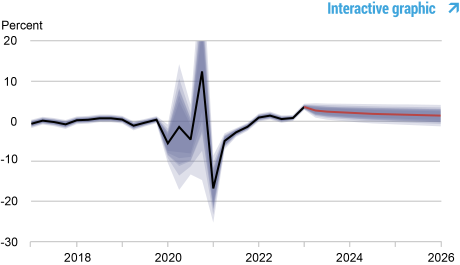
Source: Authors’ calculations.
Notes: The black line shows the model’s mean estimate of the real natural rate of interest; the red line shows the model forecast of the real natural rate. The shaded area marks the uncertainty associated with the forecasts at 50, 60, 70, 80, and 90 percent probability intervals.

Marco Del Negro is an economic research advisor in Macroeconomic and Monetary Studies in the Federal Reserve Bank of New York’s Research and Statistics Group.

Aidan Gleich is a senior research analyst in the Bank’s Research and Statistics Group.

Donggyu Lee is a research economist in Macroeconomic and Monetary Studies in the Federal Reserve Bank of New York’s Research and Statistics Group.

Ramya Nallamotu is a senior research analyst in the Bank’s Research and Statistics Group.

Sikata Sengupta is a senior research analyst in the Bank’s Research and Statistics Group.
How to cite this post:
Marco Del Negro, Aidan Gleich, Donggyu Lee, Ramya Nallamotu, and Sikata Sengupta, “The New York Fed DSGE Model Forecast— June 2023,” Federal Reserve Bank of New York Liberty Street Economics, June 16, 2023, https://libertystreeteconomics.newyorkfed.org/2023/06/the-new-york-fed-dsge-model-forecast-june-2023/
BibTeX: View |


Disclaimer
The views expressed in this post are those of the author(s) and do not necessarily reflect the position of the Federal Reserve Bank of New York or the Federal Reserve System. Any errors or omissions are the responsibility of the author(s).
 RSS Feed
 Follow Liberty Street Economics