


After a sharp decline in the first few months of the COVID-19 pandemic, inflation rebounded in the second half of 2020 and surged through 2021. This post analyzes the drivers of these developments through the lens of the New York Fed DSGE model. Its main finding is that the recent rise in inflation is mostly accounted for by a large cost-push shock that occurred in the second quarter of 2021 and whose inflationary effects persist today. Based on the model’s reading of historical data, this shock is expected to fade gradually over the course of 2022, returning quarterly inflation to close to 2 percent only in mid-2023.
Before delving into the analysis, we wish to remind our readers that the DSGE model forecast is not an official New York Fed forecast, but only an input to the Research staff’s overall forecasting process.
The Surge in Inflation
The chart below shows in red the evolution of the 12-month inflation rate in the Personal Consumption Expenditures (PCE) price index excluding food and energy (core PCE) since 2000. Its recent increase is especially striking against the backdrop of extremely stable inflation around 2 percent in the previous two decades. The chart also reports the measure of inflation that the rest of this post focuses on: the quarterly annualized percentage change in the core PCE price index. This is the measure of core inflation used in the estimation of the New York Fed DSGE because this model is devised to account for data, such as GDP growth, which are only available at a quarterly frequency. The rise in inflation over the past year is equally evident in our quarterly measure as in the more familiar 12-month change.
Two Measures of Core PCE Inflation
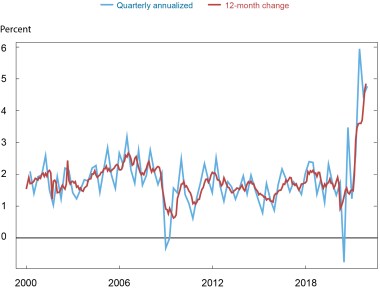
Source: Bureau of Economic Analysis (BEA).
The Role of Cost-Push Shocks
What factors underlie this surge in inflation? DSGE models are especially useful tools to address this type of question because their structure enables economists to decompose the evolution of key macroeconomic variables, such as inflation in this case, in terms of underlying driving forces, as discussed in some detail in this Liberty Street Economics post focused on the Great Recession. The chart below shows such a decomposition, focusing on core PCE inflation in deviation from 2 percent. Together with data from 2017 to the fourth quarter of 2021, the chart also displays the model’s forecast of this variable through the end of 2024. This decomposition highlights the contribution to the movements in inflation coming from five groups of shocks: 1) cost-push shocks that hit the economy before 2020; 2) cost-push shocks that hit the economy in 2020; 3) cost-push shocks that hit the economy in 2021; 4) transitory price level shocks; and 5) COVID-19-related shocks. By cost-push shocks, we mean shocks to the price Phillips curve that determines inflation in the model, as opposed to shocks that move inflation through their effect on marginal costs. In our model, marginal costs depend on productivity, real wages, and the cost of capital. Therefore, any disturbance that affects inflation other than directly through these channels represents a cost-push shock. For instance, shocks to the price of energy or other intermediate inputs, including those due to bottlenecks in the supply chain, would be captured by this shock.
The Impact of Cost-Push Shocks on Core PCE Inflation and Its Forecast
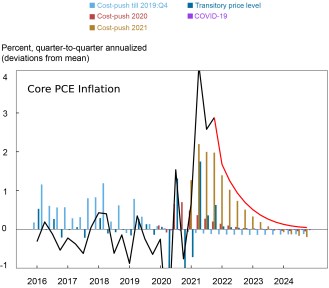
Source: Authors’ calculations.
The key distinction between cost-push shocks and transitory price level shocks in our model is that the effects of the former on inflation are persistent. This persistence is partly endogenous, since the model’s Phillips curve includes lagged inflation, and partly due to the fact that cost-push factors follow an autocorrelated process, whose persistence is estimated using data since 1964. In contrast, transitory price level shocks have stationary effects on the price level, which impart negative auto-correlation to inflation. Following one such shock, inflation is above average at first, but eventually falls below average, as prices return to their original level before the shock. COVID-19 shocks are additional temporary shocks added to the model to account for the very extreme dynamics observed in most real variables at the outset of the pandemic.
Two Inflation Narratives
By including both transitory and persistent pricing shocks, the model encompasses two key narratives that have animated the debate on the sources of inflation over the past year. The first narrative saw inflationary pressures as largely transitory, while the second suggested that they might persist in the medium term.
The shock decomposition presented in the chart above points in the direction of this second narrative, with cost-push shocks driving inflation steadily higher over the course of 2021 and then fading only gradually over the subsequent two years. Several other aspects of this shock decomposition are worth noting. Transitory shocks dominated the movements of inflation early in the pandemic, as it first plunged in the second quarter of 2020 and subsequently rebounded in the third quarter as the economy shut down and the re-opened. Persistent cost-push shocks were virtually absent in that first phase of the pandemic economy.
The picture changes drastically in 2021, especially in the second quarter, when the model attributes about 2.5 percentage points of the surge in inflation to new cost-push shocks. The temporary price level shock contributes another 1.5 percentage point to inflation in the second quarter, with a much smaller contribution in the third quarter. But this moderating effect is swamped by the size and persistence of the cost-push shocks hitting in the first half of the year. These shocks dominate the current inflation picture, imparting significant persistence to the forecast.
The contrast between the model-based decomposition of the drivers of inflation in 2020 and 2021 suggests that the model can distinguish between different sources of inflation. Persistent cost-push shocks are an important source of inflation variation in the model, as also shown by the bars in the period up to 2019. But they are far from able to explain all its fluctuations. They account for about half of the variance of inflation at high frequencies and far less at lower frequencies. Overall, cost-push shocks are responsible for about 20 percent of its unconditional variance. Yet, the model ignores cost-push shocks almost entirely in 2020, while they dominate the scene in 2021. This contrast between the inflation drivers identified by the model in 2020 and 2021 suggests that its conclusion regarding the expected persistence of the current inflation shock is not hardwired into its assumptions.
COVID-19 shocks have negligible effects on inflation, for two reasons. First, according to the model’s New Keynesian Phillips curve, inflation depends on the present discounted value (PDV) of future marginal costs, rather than on their current level alone. Transitory shocks to those marginal costs, even if large, have limited effect on their PDV. Second, the Phillips curve in the model is estimated to be very flat. Therefore, even large movements in the PDV of marginal costs have a small impact on inflation. This low estimated pass-through from real economic developments to inflation explains why, pre-COVID, inflation barely moved even in the face of large business cycle shocks, such as during the Great Recession.
What About Other Shocks?
We have argued above that our model does not attribute all notable movements in inflation to cost-push shocks by construction. In fact, other drivers, including aggregate demand shocks, are on average more important sources of inflationary pressures in the model than cost-push shocks and also play an important role in the model’s decomposition presented above. Before 2020, cost-push shocks tend to push inflation above 2 percent, as shown by the positive light blue bars. Yet, inflation hovers below 2 percent in that period, indicating that other factors are restraining it. After 2020, this restraining force is mostly gone: inflation is higher than the sum of the bars, suggesting that the other shocks are now pushing it up. However, this shift is gradual and it does not explain the spike in inflation in 2021. This is partly because of the model’s flat Phillips curve, which implies that the boost to aggregate demand must be high and/or persistent to have a sizable effect on inflation.
Caveats and Conclusions
The identification of the factors driving inflation is only as good as the model that produces it, and our model is omitting many relevant aspects of reality. A potentially important one is fiscal policy. In our model, the large fiscal transfers enacted during the pandemic have no direct effect on consumption because its representative household anticipates the increase in taxes that will eventually be necessary to pay for them. This would not be the case in a model with heterogenous agents, some of whom are hand-to-mouth and thus exhibit high marginal propensities to consume, for instance. In such a model, the boost to consumption demand from fiscal stimulus would be larger than in our framework.
The model also abstracts from another much-discussed feature of the current environment: the imbalance between the demands of goods, especially durables, and services. Qualitatively, this gap in the model should not significantly affect our conclusions because sectoral shocks have very similar effects to cost-push shocks in models similar to ours, as shown most recently here. Quantitatively, though, the extreme sectoral imbalances observed during the pandemic might result in more persistent cost-push shocks than those observed historically and that inform the model’s estimates.
In sum, the model’s assessment is that the elevated inflation observed over the past year is mostly driven by persistent cost-push factors. In our next post, we discuss how alternative monetary policy strategies contribute to shape the response of the economy to these shocks.

Marco Del Negro is a vice president in the Bank’s Research and Statistics Group.

Aidan Gleich is a senior research analyst in the Bank’s Research and Statistics Group.

Shlok Goyal is a senior research analyst in the Bank’s Research and Statistics Group.

Alissa Johnson is a senior research analyst in the Bank’s Research and Statistics Group.

Andrea Tambalotti is a vice president in the Bank’s Research and Statistics Group.
Disclaimer
The views expressed in this post are those of the authors and do not necessarily reflect the position of the Federal Reserve Bank of New York or the Federal Reserve System. Any errors or omissions are the responsibility of the authors.
 RSS Feed
 Follow Liberty Street Economics