


Yesterday’s post analyzed the drivers of the surge in inflation over the course of 2021 through the lens of the New York Fed DSGE model. In today’s post, we use the model to study how alternative monetary policy strategies might contribute to bringing inflation back down to 2 percent. Our main finding is that there is no monetary silver bullet. Due to a flat Phillips curve—a well–documented feature of the economic environment of the last three decades—monetary policy can only achieve faster disinflation at a considerable cost in terms of forgone economic activity. This is true regardless of the systematic approach followed by the central bank in the model to pursue its objective.
Monetary Policy and Cost-Push Shocks
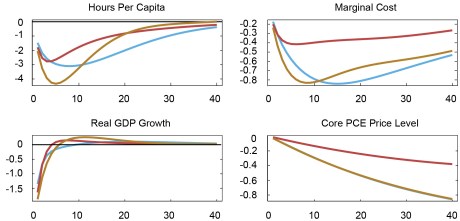
Yesterday’s post highlighted that inflation is currently elevated due to cost-push shocks. How does the model economy respond to such shocks? And how does this response change with different monetary policy reaction functions? The chart below answers these questions. It shows how several macroeconomic variables respond to a cost-push shock of the same size as that estimated to have hit the U.S. economy in the second quarter of 2021. A shock of this size leads to a surprise increase in inflation of roughly 1 percent. This impact effect is lower than the overall increase in inflation in that quarter because cost-push shocks in that quarter are the most prominent, but not the only factor behind high inflation. Earlier cost-push shocks, as well as demand and other shocks hitting the economy in the second quarter also contribute to the inflation increase.
To illustrate how alternative monetary policy strategies might contribute to bring inflation down, the chart includes three lines corresponding to different interest rate rules. In blue (“Historical FIT”) is the path of the economy when monetary policy follows the flexible inflation-targeting interest rate rule that was in place before the summer of 2020, as estimated by the model. The red lines show the responses under a rule that captures some of the features of flexible average inflation targeting (FAIT). This rule differs from FIT mainly because it responds to an average of inflation over time, rather than to current inflation alone. The details of its implementation in our model are described in more detail here. We will discuss the gold line shortly.
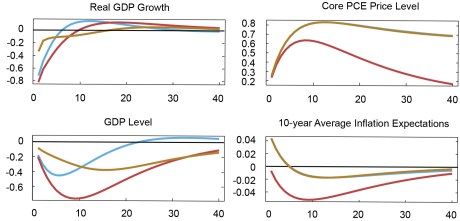
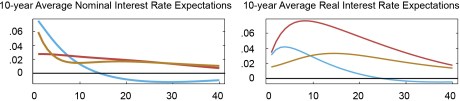
The first striking feature of this comparison is that the response of inflation to the cost-push shock is very similar regardless of the policy rule in place. The FAIT rule reduces inflation a bit faster than the historical FIT rule, but this small benefit in terms of inflation control comes at a very large real cost. The recession that monetary policy must engineer to achieve this negligible reduction in inflation is deeper and more protracted under the FAIT than the FIT policy, as judged by any of the real variables in the model: hours worked, GDP growth, the level of GDP, and (real) marginal costs. This very unfavorable sacrifice ratio reflects the extreme flatness of the estimated Phillips curve. FAIT “gets the job done” with minimal movements in the policy rate because the stance of policy is expected to remain tight for (much) longer than under the estimated FIT rule. This tighter-for-longer policy implies that the 10-year average expected interest rate rises less on impact than under FIT, but declines more slowly. It also implies that the contraction in economic activity is more protracted, to the point that long-term inflation expectations actually fall, in spite of the inflationary shock. The increase in long-term nominal rates and the fall in inflation expectations result in a larger increase in real long-term rates under FAIT than under FIT, making the former rule more contractionary than the latter, even if it implies a smaller increase in the nominal short-term interest rate. This explains why the recession is more severe, and lasts longer, under FAIT than under FIT.
Impulse Responses to a Cost-Push Shock under Alternative Monetary Policy Strategies
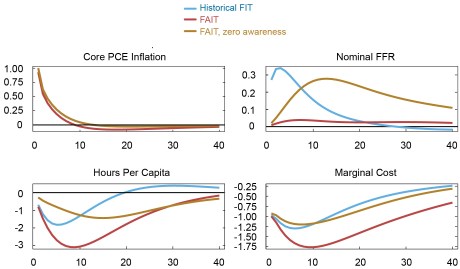
In the red impulse responses, the FAIT rule is assumed to be perfectly understood by private agents immediately upon its adoption. But there is some evidence that expectation formation by households and firms may adjust slowly to the introduction of the new policy strategy. To capture this possibility, the gold lines (“FAIT, zero awareness”) reflect the assumption that private agents are not aware of the introduction of the new framework and thus form expectations as if the historical FIT rule were still in place. Both assumptions—full and partial awareness—are extreme. Reality is probably somewhere in the middle, but the extreme cases help to highlight the importance of expectations in shaping the response of the economy to the shock. When agents are not aware of its introduction, FAIT achieves the same inflation outcome as the historical FIT policy, even if the policy rate increases much more in the gold than in the red simulation. This is because, with a flat Phillips curve, the effect of current conditions on inflation is minimal and its dynamics are mostly shaped by expectations. Without credibility, FAIT leads to movements in the policy rate and the real variables that are smaller on impact than under FIT, but more drawn out. But if this increase in persistence does not alter expectations, its effects on inflation are minimal.
Monetary Policy and Demand Shocks
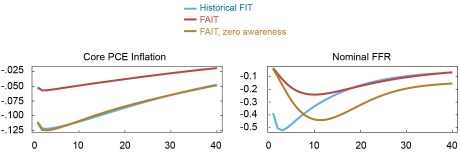
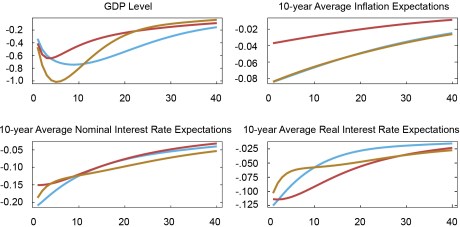
The chart above illustrates the role of alternative monetary policy rules in shaping the response of the economy to a cost-push shock. But what if high inflation is due to strong aggregate demand instead? In this case, the inflation fighting properties of FAIT and FIT are notably different. This is demonstrated in the chart below, where we plot the response of the same variables considered above to a negative risk premium shock of the same size as that faced by the U.S. economy in the fourth quarter of 2008, in the midst of the financial crisis. This shock generates economic dynamics of the kind typically associated with shifts in aggregate demand, with declines in both inflation and real activity, as discussed here for instance. In response to a negative risk premium shock, perfectly credible FAIT stabilizes inflation and the real economy more effectively than the historical FIT policy, and with less policy effort, as measured by the movements in the nominal interest rate. This is the textbook case in favor of policies that feature more history dependence.
Why is FAIT so successful when faced with demand shocks? Because it keeps long-run inflation expectations “anchored”. As FAIT promises long lasting accommodation, 10-year inflation expectations decline by less than half than with the FIT policy. In turn, this implies that the decline in long run real rates is larger under FAIT, even if nominal rates fall less on impact. In turn, lower real rates boost demand, effectively counteracting the consequences of the risk premium shock. A flat Phillips curve is less of an issue when the economy is facing demand rather than cost-push shocks. In the former case, the source of the problem is a decline in aggregate demand, rather than an exogenous increase in inflation. Therefore, policy is better equipped to deliver a solution by reversing the reduction in demand through a low-for-longer strategy. In addition, monetary policy is in a better position to affect economic activity when the Phillips curve is flat, because the economy is “more Keynesian,” as discussed in this Liberty Street Economics post. These simulations help to understand why history dependent policies like FAIT have gained such prominence over the course of the past two decades, a period in which demand shocks—including those associated with an often-binding ELB in a low r* environment—have dominated the macroeconomic landscape.
The key role of expectations in the success of the FAIT strategy is highlighted by the fact that FIT is less effective at stabilizing the economy. FIT relies less on future promises and therefore does not anchor inflation expectations as much. For this same reason, FAIT is far less successful when private agents are not aware of its adoption, as under the gold responses.
Impulse Responses to a Demand Shock
Conclusions and Some Caveats
This post showed that, in the New York Fed DSGE model, monetary policy faces an unfavorable trade-off when attempting to stabilize inflation in response to cost-push shocks, due to an extremely flat Phillips curve. Lowering inflation requires a deep and protracted contraction, regardless of the policy strategy underlying the pursuit of this objective. One silver lining in this pessimistic conclusion is that, if the model is right and cost-push shocks are the main reason behind inflation, their effect should dissipate over time, at least according to historical patterns. If the model is wrong and inflation is driven instead by demand shocks, monetary policy is well-positioned to reduce their inflationary effects.
The analysis that leads to these conclusions is subject to several caveats. First, agents in our model are forward-looking and understand the structure of the economy, including the systematic response of monetary policy to economic developments. As a result, the model does not include any of the mechanisms that the literature has identified as potential sources of drift in inflation expectations. The potential for such drift might change the cost-benefit analysis of alternative monetary policy approaches, as illustrated in this paper for instance.
Second, the Phillips curve may be—or may have recently become—steeper than estimated in the model. However, our calculations suggest that it would need to be even steeper than the one estimated with data up to 1990—a period in which the connection between inflation and real activity was arguably tighter than in the more recent past—for higher interest rates to make a sizable dent in inflation.
More in general, the fact that a flat Phillips curve is a reason for monetary policy to be less aggressive in stabilizing inflation, everything else being equal, is reminiscent of the work of Primiceri and Sargent, Williams, and Zha on the causes of the Great Inflation of the 1970s. In their models, policymakers do not fully understand the structure of the economy and must learn it as they conduct policy. In particular, they hold the (mistaken) belief that the Phillips curve is flat. As a result, they opt for a less contractionary policy, thus feeding the upward inflation spiral. One important difference between our current belief that the Phillips curve is flat and that held by policymakers in the late 1960s and early 1970s is that they were not yet fully aware of the importance of expectations in the dynamics of inflation. In contrast, the models used today to infer the slope of the Phillips curve, including ours, all incorporate that important lesson from the experience of the 1970s, even if we have no guarantee that they do so correctly.

Marco Del Negro is a vice president in the Bank’s Research and Statistics Group.

Aidan Gleich is a senior research analyst in the Bank’s Research and Statistics Group.

Shlok Goyal is a senior research analyst in the Bank’s Research and Statistics Group.

Alissa Johnson is a senior research analyst in the Bank’s Research and Statistics Group.

Andrea Tambalotti is a vice president in the Bank’s Research and Statistics Group.
Disclaimer
The views expressed in this post are those of the authors and do not necessarily reflect the position of the Federal Reserve Bank of New York or the Federal Reserve System. Any errors or omissions are the responsibility of the authors.
 RSS Feed
 Follow Liberty Street Economics