


Supply chain disruptions continue to be a major challenge as the world economy recovers from the COVID-19 pandemic. In a January post, we presented the Global Supply Chain Pressure Index (GSCPI) as a parsimonious global measure that encompasses several indicators used to capture supply chain disruptions. The main purpose of this post is to provide an update of the GSCPI through February 2022. In addition, we use the index’s underlying data to discuss the drivers of recent moves in the GSCPI. Finally, these data are used to create country-specific supply chain pressures indices.
Updated GSCPI
The chart below shows the GSCPI through February 2022, and it points to an easing in global supply chain pressures since December 2021 even though they remain at historically high levels (download data).
While Global Supply Chain Pressures Are Decreasing, Pressure Still Remains High
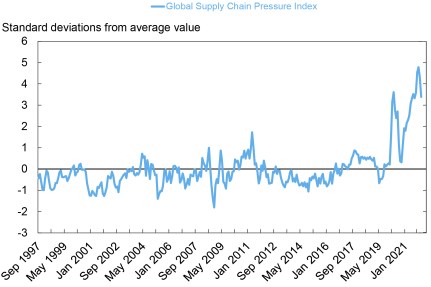
Note: Each index is scaled by its standard deviation.
To see what drove this recent easing in supply chain pressure, it may be useful to summarize how the GSCPI is built. As detailed in our original post, the GSCPI is based on two sets of data. Global transportation costs are measured by using data on sea shipping costs, for which we employ data from the Baltic Dry Index (BDI) and the Harpex index, as well as BLS airfreight cost indices for freight flights between Asia, Europe, and the United States. We also use three supply chain-related components— “delivery times,” “backlogs,” and “purchased stocks”—from the Purchasing Managers’ Index (PMI) surveys for manufacturing firms across seven interconnected economies: China, the euro area, Japan, South Korea, Taiwan, the United Kingdom, and the United States.
Before we combine these within the GSCPI by means of principal component analysis, we strip out demand effects from the underlying data series by projecting the PMI supply chain components on the “new orders” component from the corresponding PMI surveys and, in a similar vein, we do that for the global transportation cost measures that are projected onto the GDP-weighted “new orders” and “inputs purchased” components across the seven PMI surveys. This attempt at isolating supply side moves is very much reminiscent of similar approaches that have been proposed by the International Monetary Fund (see the latest World Economic Outlook, page 47) and the Bank of England (see the Monetary Policy Report, page 28), although we exploit more information by allowing for cross-country linkages and by including various measures of transportation costs.
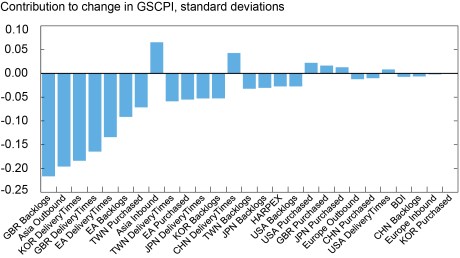
So, what has driven the easing of global supply chain pressures observed since December? In the next chart, we focus on the decline between January and February. Each column represents the contribution in standard deviation of each component of our index toward its overall change. Note that the lessening of supply chain pressures has been widespread among the various components, which is a welcome development in terms of reducing global supply chain disruptions.
Most GSCPI Components Decreased in February 2022
The careful reader may have noticed some numerical differences between the current vintage of the GSCPI and those published earlier. Although we construct the GSCPI between 1997 and the present, we noted in our original post that some of our underlying data start later than 1997, whereas other series are published with a one-month lag. Consequently, we have data gaps both early in the sample as well as at the end. We take that into account when estimating the common component across the series by means of principal component analysis and in the process impute estimated values into these data gaps, as suggested by Stock and Watson (2002). Therefore, GSCPI levels of the most recent months can be revised as realized data become available and replace these imputed values. In addition, for some of the series, mainly the BLS airfreight cost indices, each new release comes with revisions to up to twelve months of previous data. The chart below compares the current release of the GSCPI with the previous three releases, and it shows that revisions can have an impact up to a year back in time. The chart furthermore shows that the current vintage of the GSCPI suggests that global supply chain pressures peaked in December, whereas the previous vintage had pressures reaching the highest levels in November. Both vintages suggests that 2022, at least up to February, has seen a decrease in global supply chain disruptions.
Revised and Realized Data Can Alter Previous Supply Chain Pressure Readings
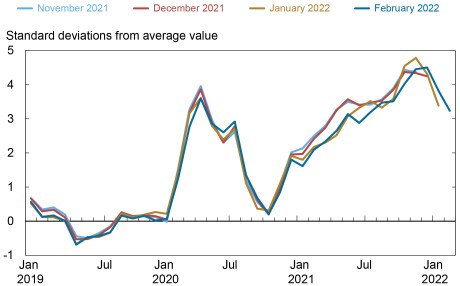
Note: Each index is scaled by its standard deviation.
Country-Specific Supply Pressure Indices
The data set for our GSCPI includes PMI data for seven countries: China, the euro area, Japan, Korea, Taiwan, the United Kingdom, and the United States. We can utilize these data in conjunction with our global transportation measures to approximate supply chain pressures in these economies. This entails taking the “delivery times,” “backlogs,” and “purchased stocks” components of a specific country’s PMI survey and adding the transportation cost measures, transformed into local currency terms. In relation to these transportation cost series, the shipping cost proxies are global and thus always considered for a country, whereas only the relevant regional airfreight cost measures are used—that is, the cost of airfreight between the U.S. and Asia for China, Japan, South Korea, and Taiwan, the cost of airfreight between the U.S. and Europe for the euro area and the U.K., and all airfreight costs measures for the U.S.
We therefore have six series per country, except for the United States, where we have seven. In a similar vein as in case of the GSCPI, we use regressions based on PMI demand proxies and their lags to cleanse each country’s data set as much as possible from demand effects. The cleansed series are then included in a principal component analysis at the country level, where for each country a common component is estimated while data gaps are simultaneously imputed with preliminary estimates.
In the two charts below, we plot our constructed indices for our seven economies. The first chart depicts our country-specific supply chain proxies for the euro area, Japan, the U.K., and the U.S. Supply chain pressures reach new highs in recent months for these economies but started to ease moving into 2022. In the cases of China, South Korea, and Taiwan, as shown in the second chart below, we also notice some easing in supply chain pressures heading into February after coming off fresh peaks on the back of COVID-related lockdowns in the region, with China lagging somewhat relative to South Korea and Taiwan.
Local Supply Chain Pressure Indices Remain Above Average Levels for Advanced Economies
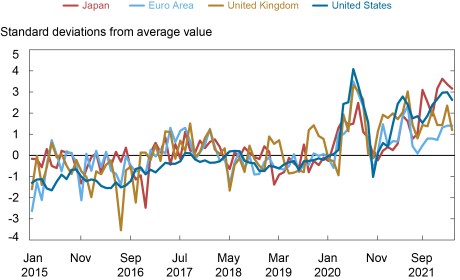
Note: Each index is scaled by its standard deviation.
Local Supply Chain Pressure Are Beginning to Decline in Emerging Markets
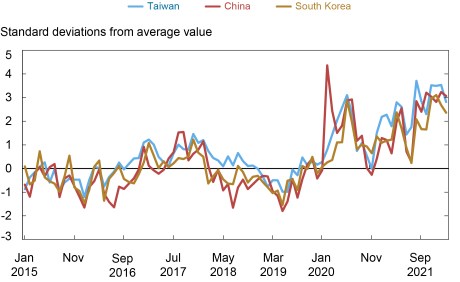
Note: Each index is scaled by its standard deviation.
We note that while there are co-movements among the regional indices, idiosyncratic fluctuations in these measures do occur, reflecting country-specific factors. For example, we observe an increase in the Chinese index during the so-called trade war tensions with the U.S. Interestingly, the post-Brexit period does not seem to have resulted in a notable increase in the U.K. pressure index. A notable caveat with these country-specific indices is that they can be noisier and thus less precise in measuring supply chain pressures than the GSCPI, as they are based on a smaller set of inputs that limit the scope to “diversify away” noisy features in the underlying data and they ignore cross-country linkages that are at the heart of the supply chain connections among manufacturing firms.
Conclusions
In this post, we provide an update of the GSCPI and introduce proxies for country-specific supply chain pressures. Overall, we note that supply chain pressures have moderated relative to the peak reached in December 2021, but these pressures have remained at historically elevated levels through February. Going forward, there is the possibility that the current heightened geopolitical tensions might lead to more elevated supply chain pressures in the near future.

Gianluca Benigno is an assistant vice president in the Federal Reserve Bank of New York’s Research and Statistics Group.

Julian di Giovanni is an assistant vice president in the Bank’s Research and Statistics Group.

Jan Groen is a research officer in the Bank’s Research and Statistics Group.

Adam Noble is a senior research analyst in the Bank’s Research and Statistics Group roup
How to cite this post:
Gianluca Benigno, Julian Di Giovanni, Jan Groen, and Adam Noble, “Global Supply Chain Pressure Index: March 2022 Update,” Federal Reserve Bank of New York Liberty Street Economics, March 3, 2022, https://libertystreeteconomics.newyorkfed.org/2022/03/global-supply-chain-pressure-index-march-2022-update.
Disclaimer
The views expressed in this post are those of the authors and do not necessarily reflect the position of the Federal Reserve Bank of New York or the Federal Reserve System. Any errors or omissions are the responsibility of the authors.
 RSS Feed
 Follow Liberty Street Economics
Great work. Thank you for doing the work to compile the index and publish it.