


Comparing our financial stability real interest rate, r** (“r-double-star”) with the prevailing real interest rate gives a measure of how vulnerable the economy is to financial instability. In this post, we first explain how r** can be measured, and then discuss its evolution over the last fifty years and how to interpret the recent banking turmoil within this framework.
Background and Approach
To define the financial stability real interest rate, we build upon a banking model as in the seminal work of Gertler and Kiyotaki in which financial stress arises endogenously. Banks are subject to a constraint on their leverage (assets relative to equity) that becomes more severe when the banks’ portfolio becomes riskier. The gap between r** and the prevailing real interest rate is inversely related to how binding the constraint is, and in this way measures how vulnerable the economy is to any shock.
We do not observe r**. Instead, we use the model just outlined to estimate the relationship between r** and other variables that we do actually observe. An important feature of the model is that the relationships between variables differ depending on whether the economy is in a tranquil or financially vulnerable state. To fully capture the complexity of these relationships we exploit the flexibility of machine learning techniques.
We start by searching for two variables in the model that do the best in tracking financial (in)stability. The best, based on out-of-sample fit, are leverage and the ratio of safe assets to total assets held by financial intermediaries. The second-best variables are credit spreads and the level of the real interest rate. We opted to go with the second-best fit given the difficulty in measuring leverage, but our staff report provides an alternative measure of r** based on leverage and the safe asset ratio, which is highly correlated with our baseline measure.
r** In the Data
The next chart reports the evolution of our baseline r** measure from the early 1970s to the end of 2022. The blue line shows the real rate, as measured by the ex-post real federal funds rate. The red line shows our estimate of r**. Vertical shaded gray areas indicate financial stress episodes identified by high volatile credit spreads that persists for at least two quarters.
Financial Stability Rate vs. Real FFR, Data
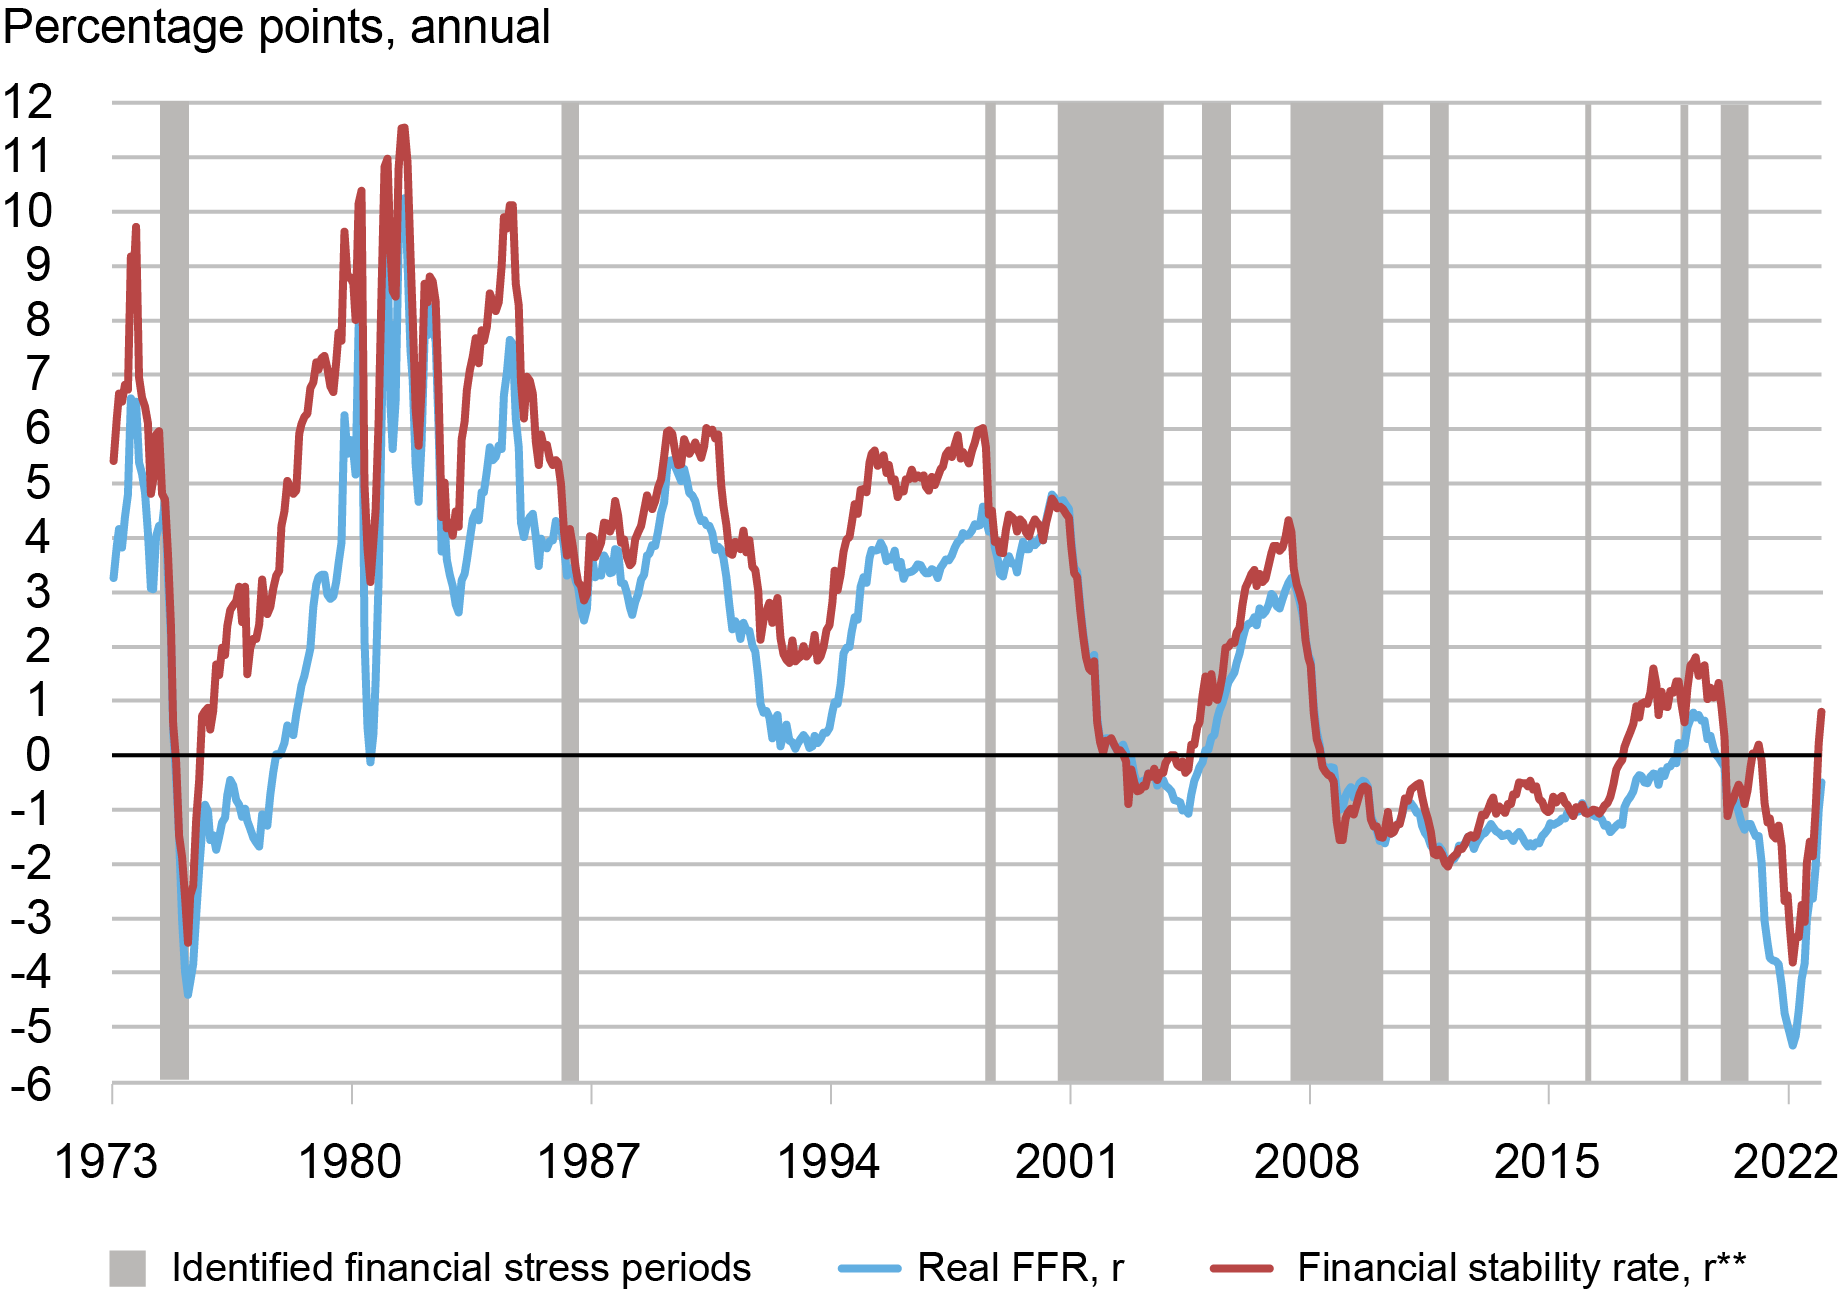
Sources: Board of Governors of the Federal Reserve System; Federal Reserve Bank of St. Louis, FRED database; authors’ calculations.
Notes: r**-r is calculated using real federal funds rate and Gilchrist and Zakrajšek (2012) spread. The real federal funds rate is the effective rate minus twelve-month core inflation according to the price index for Personal Consumption Expenditures.
Broadly speaking, it appears that during the first part of the Great Moderation period, in the mid to late 80s and the 90s, r** was significantly above r except for short-lived episodes of stress such as the Long-Term Capital Management (LTCM) crisis. In the 2000s and right after the Great Recession, the gap between r** and r was close to zero. In the mid to late 2010s, r** was generally well above r, except again for a couple of very short-lived periods of stress, until the COVID pandemic hit the economy in March 2020.
As an illustration, we zoom in to one episode of financial stress during the Great Recession. In the next chart we report spreads (left panel, red line), the fed funds rate (middle panel, black line) and the implied real rate (right panel, blue line) and r** (right panel, red line). As the global financial crisis unfolded, spreads increased and therefore our measured r** declined. In the initial period the real rate tracked r** but as the crisis deepened with the collapse of Lehman Brothers the increase in spreads opened a negative gap between r** and the real rate that lasted well into 2009.
Financial Crisis Episode
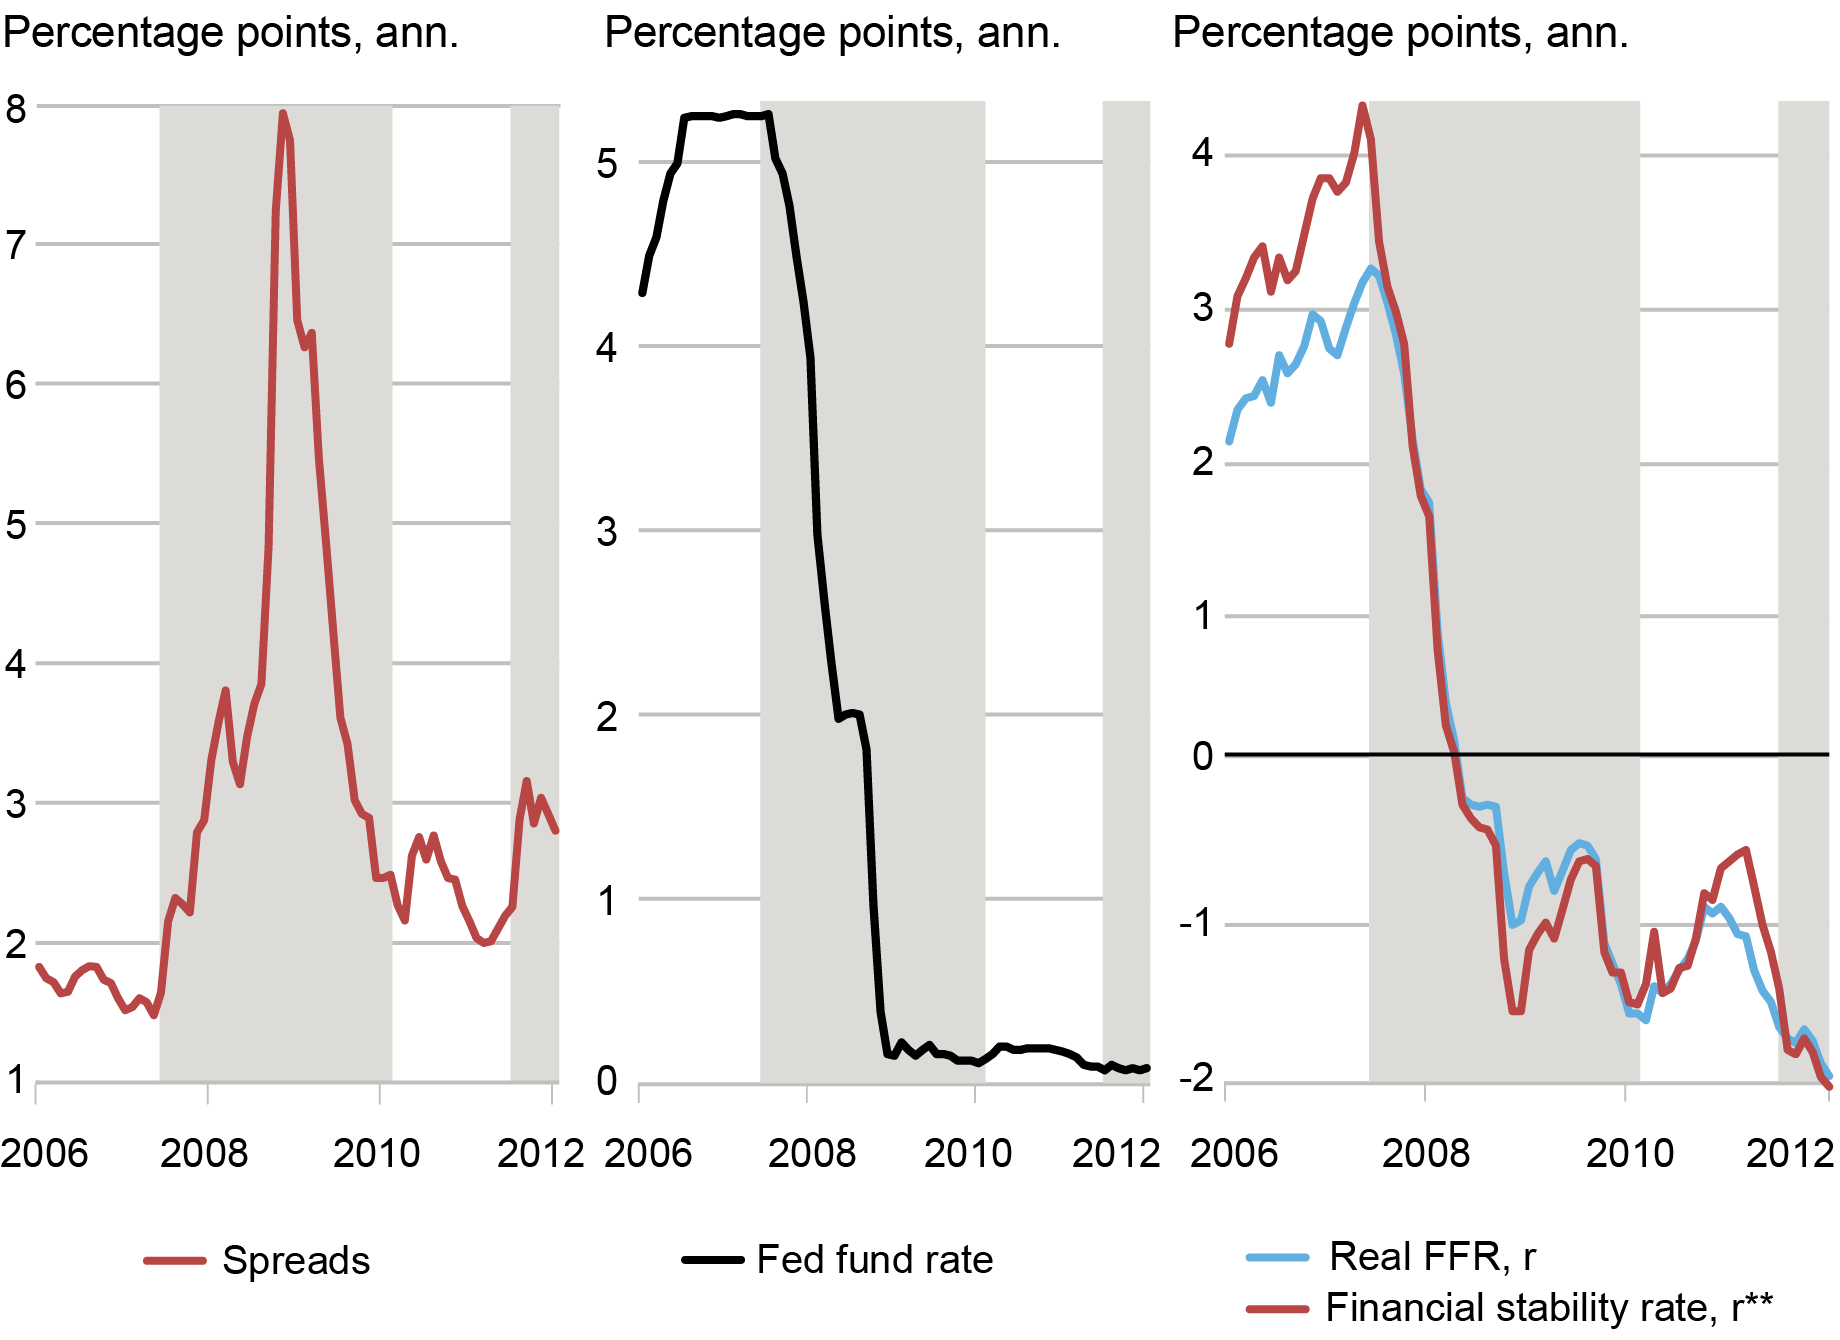
Sources: Board of Governors of the Federal Reserve System; Federal Reserve Bank of St. Louis, FRED database; authors’ calculations.
Notes: r**-r is calculated using real federal funds rate and Gilchrist and Zakrajšek (2012) spread. r** is calculated by adding r**-r to the real federal funds rate. The real federal funds rate is the effective rate minus twelve-month core inflation according to the price index for Personal Consumption Expenditures.
The Banking Turmoil and r**
Finally, we provide a narrative of how our framework can be used to interpret the banking turmoil associated with the collapse of Silicon Valley Bank. As discussed above, there are two key elements that characterize financial vulnerabilities. The first one is the leverage ratio and the second one is the ratio of safe assets over total assets. Both lower leverage and a higher safe asset ratio contribute to making the banking sector less vulnerable. The rapid increase in the Fed funds rate combined with quantitative tightening has reduced the amount of reserves (that is, safe assets from a banking sector point of view) and generated potential unrealized losses in long-term Treasuries. In particular, unrealized losses lead to higher effective leverage and thus raise financial vulnerabilities. As uninsured depositors began to take note, the sales of such securities to meet deposit withdrawals would augment those vulnerabilities.
Our analysis would suggest that the double effect coming from lower reserves and declining net worth would reduce r** putting pressure on the financial system. In this sense, the new Bank Term Funding Program that allows selected financial institutions to exchange Treasuries at par could be interpreted as a policy intervention that make Treasuries more liquid, that in the context of our model-based approach could lead to an increase in r**.
Conclusions
In this post we have illustrated our approach to measuring a financial (in)stability real interest rate. We stress that our r** should be interpreted as a current indicator of financial stress as opposed to a predictor of future vulnerabilities, and that our relatively simple framework constitutes a first step in developing more refined and accurate measures of the financial stability real interest rate.

Ozge Akinci is an economic research advisor in International Studies in the Federal Reserve Bank of New York’s Research and Statistics Group.

Gianluca Benigno is a professor of economics at the University of Lausanne.

Marco Del Negro is an economic research advisor in Macroeconomic and Monetary Studies in the Federal Reserve Bank of New York’s Research and Statistics Group.

Ethan Nourbash is a research analyst in the Federal Reserve Bank of New York’s Research and Statistics Group.

Albert Queralto is chief of the Global Modeling Studies Section in the Federal Reserve Board’s Division of International Finance.
How to cite this post:
Ozge Akinci, Gianluca Benigno, Marco Del Negro, Ethan Nourbash, and Albert Queralto, “Measuring the Financial Stability Real Interest Rate, r**,” Federal Reserve Bank of New York Liberty Street Economics, May 24, 2023, https://libertystreeteconomics.newyorkfed.org/2023/05/measuring-the-financial-stability-real-interest-rate-r/
BibTeX: View |


Disclaimer
The views expressed in this post are those of the author(s) and do not necessarily reflect the position of the Federal Reserve Bank of New York or the Federal Reserve System. Any errors or omissions are the responsibility of the author(s).
 RSS Feed
 Follow Liberty Street Economics
This is brilliant -but it misses the fact that the distribution of FI’s over the two state variables is really the key. You need a heterogeneous-fi model to really nail it. I mean, SVB was way out in the tail in many dimensions, many of which were key to its collapse.
A HA model would also need a mechanism for the failure of a bank to cause a contagion of fear. Some kind of epidemiological model of expectations. My understanding is that there are actually data about how the news of the SVB failure spread on social media. We need formal models of that process.
Will you publish a method to replicate the regression model for r** to measure its current value?