


Editor’s note: Since this post was first published, the authors updated their analysis to focus on the household level of wealth rather than the aggregate level. Please refer to the new blog post and findings here Racial and Ethnic Inequalities in Household Wealth Persist. (June 28, @ 7:19am)

Wealth is unevenly distributed across racial and ethnic groups in the United States. In this first post in a two-part series on wealth inequality, we use the Distributional Financial Accounts (DFA) to document these disparities between Black, Hispanic, and white households from the first quarter of 2019 to the third quarter of 2023 for wealth and a variety of asset and liability categories. We find that these disparities have been exacerbated since the pandemic, likely due to rapid growth in the financial assets more often held by white individuals.
The quarterly demographic wealth distributions published in the DFA by the Board of Governors of the Federal Reserve System are estimated using microdata from the Survey of Consumer Finances and aggregate financial data from the Fed’s Financial Accounts series. Sample size concerns lead us to omit Asians, Pacific Islanders, and other smaller groups from this analysis, so references hereafter to the “study population” refer to Hispanic, non-Hispanic Black and non-Hispanic white adults. We refer to non-Hispanic Blacks and non-Hispanic whites as Blacks and whites below respectively. We define wealth as net worth (assets less liabilities).
At the beginning of 2019, Hispanic and Black individuals constituted 18 percent and 13 percent of the study population, respectively, yet they held just 2.7 percent and 4.9 percent of total net worth of this population. Meanwhile, 69 percent of the population was white and held 92.4 percent of U.S. net worth.
Racial and Ethnic Wealth Inequalities Have Deepened since the Pandemic
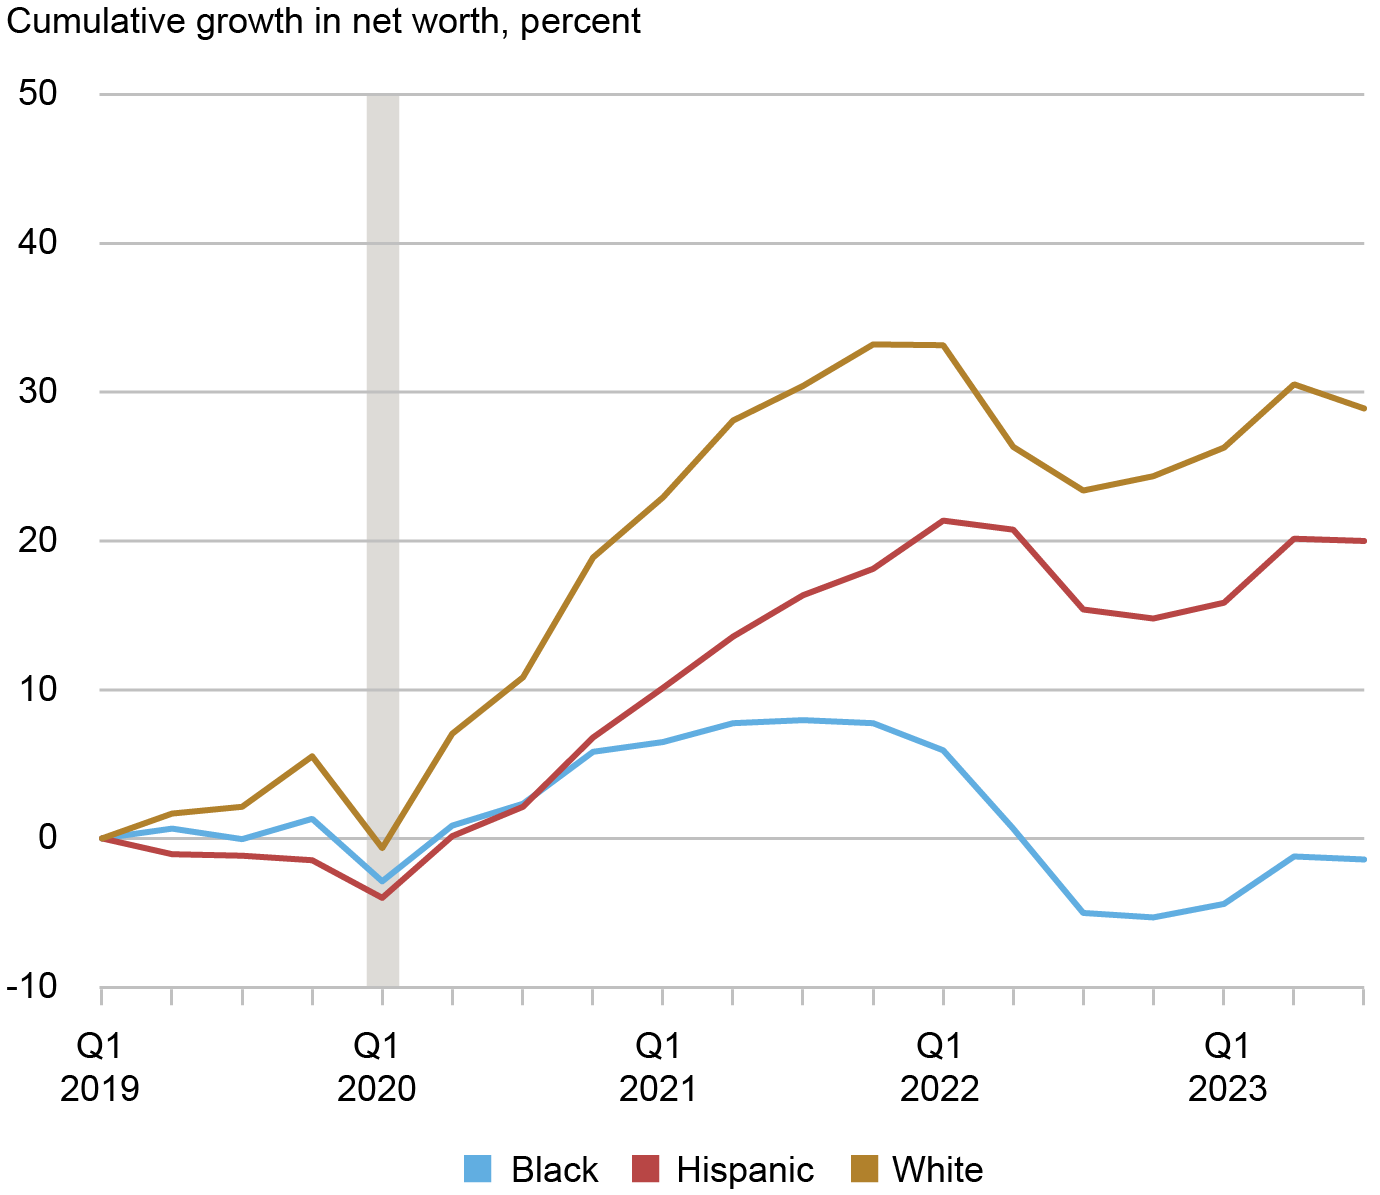
We find that 2019-2023 growth in real net worth was greater for white individuals than for Black and Hispanic individuals. We calculate real wealth growth using the race and ethnicity specific price indices presented in the inflation inequality section of the Equitable Growth Indicators series. The chart above shows that growth in the real net worth of white individuals since 2019 outpaced growth in the real net worth of Black and Hispanic individuals. The cumulative growth by 2023:Q3 relative to 2019:Q1 for white individuals exceeded that for Black and Hispanic individuals by 30 and 9 percentage points, respectively. Real Black wealth fell below its 2019:Q1 level in 2022:Q3 and remains below its 2019 level despite some recovery.
Non-White Financial Wealth Faltered While Real Estate Kept Pace
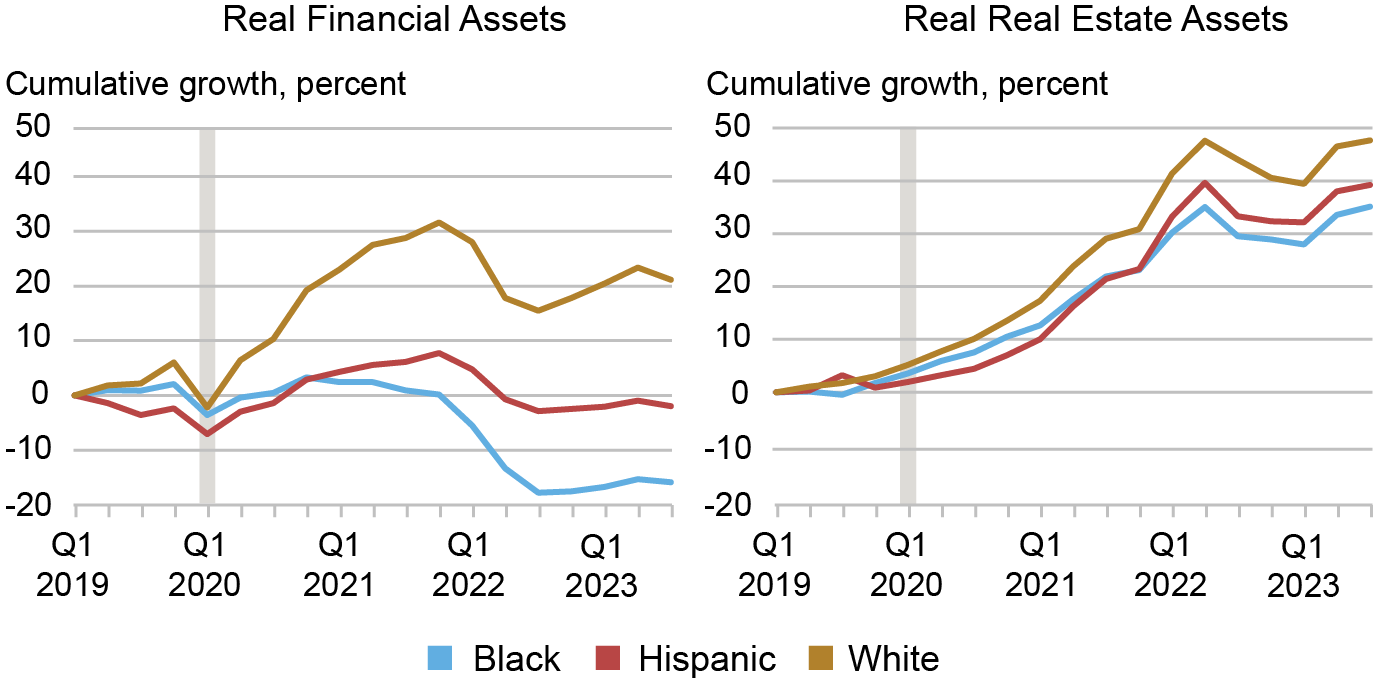
Next, we explore to what extent the differential growth in wealth during this period is owing to differences in the growth of its components—financial assets and real estate assets. White, Black, and Hispanic households invest their total assets in financial and real estate assets at different rates: total white assets in 2019:Q1 were about 70 percent finanical and 20 percent real estate assets, total Black assets were about 65 percent financial and 25 percent real estate, and total Hispanic assets were 50 percent financial and 40 percent real estate. We find much of the divergence in net worth by race and ethnicity since 2019 can be attributed to divergence in the real values of financial asset holdings (left panel above). It is worth noting here that our data do not allow us to separate changes in investments from changes in returns. So the results we identify here are a combination of both.
As the official sector moved to provide accommodation to combat the COVID recession, financial asset prices rose with the reopening of the economy through 2021. While financial asset prices fell notably alongside the rapid policy rate hikes in 2022, those declines did not fully offset the earlier rises. White-held real financial assets grew by 21 percent from 2019:Q1 to 2023:Q3, outpacing Black and Hispanic real finanical growth by 23 and 37 percentage points, respectively. The real value of Black-held financial assets dropped below its 2019:Q1 level after 2022:Q1 and continued to decline steadily, while the real value of Hispanic-held financial assets dipped below its 2019:Q1 level in 2022:Q2 and stagnated. Neither group’s real financial assets have recovered to their 2019:Q1 values as of 2023:Q3.
In contrast, there is minimal dispersion in the demographic growth rates of real liabilities and real real estate assets, even though white individuals experienced sharper increases in the value of real estate assets between 2023:Q3 and 2019:Q1 (right panel above). Additionally, the growth in the real net worth gap and real asset gap by race and ethnicity above are mostly contributed by growth in the gap of the corresponding nominal values rather than differences in inflationary experiences faced by these groups during this period. Below we try to understand the reasons behind the markedly sharper growth in financial assets of white individuals.
Financial Asset Porfolios Differ Starkly By Race and Ethnicity
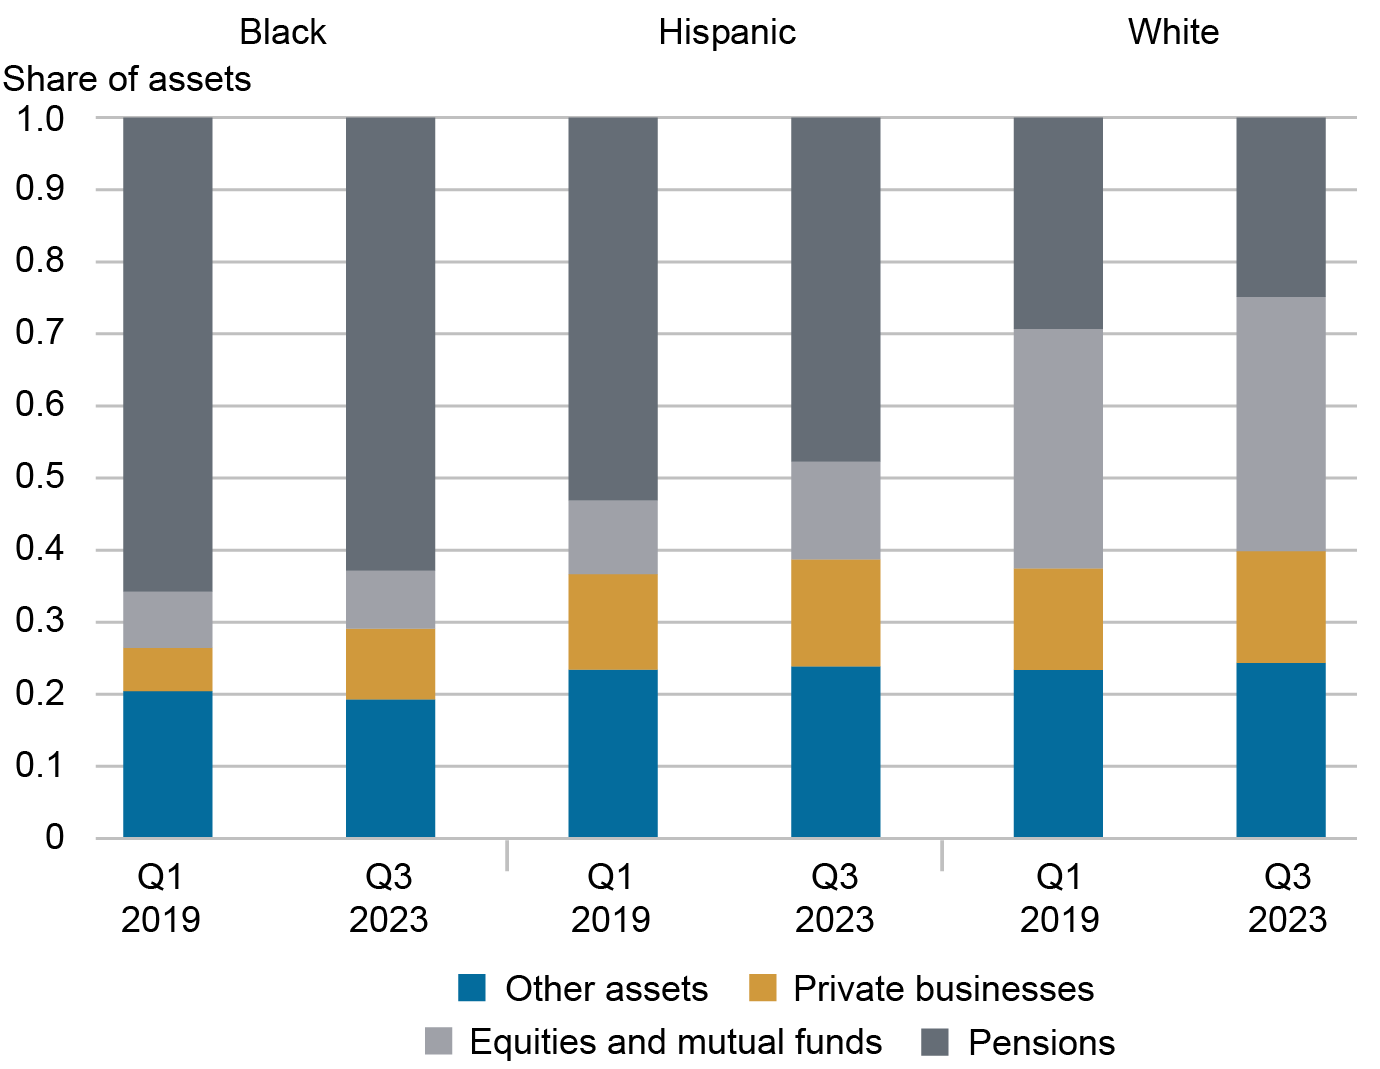
The chart above depicts the asset classes each racial and ethnic group held in 2019:Q1 and 2023:Q3. All three groups allocate similar shares of their financial asset portfolios to “other assets”—composed of insurance payouts, mortgage assets, and other small, miscellaneous assets—but exhibit differences across the other categories. More than 50 percent of Black financial wealth is in pensions (which includes both defined benefit and defined contribution pensions) and less than 20 percent is stored in private businesses, corporate equities, and mutual funds while less than 30 percent of white finanical wealth is invested in pensions and about 50 percent is in businesses, equities, and mutual funds. Hispanic financial asset allocations are similar to those of Black individuals but with slightly more investment in businesses, equities, and mutual funds and slightly less in pensions.
The groups with more exposure to businesses, equities, and mutual funds experienced much faster financial asset growth since the first quarter of 2019 as much of the period was associated with substantive appreciation of these specific asset values. In the next post in this two-part series on wealth inequality, we present differences in wealth growth by age groups during the 2019:Q1 to 2023:Q3 period.
Chart data ![]()
Net Worth by Race and Age data ![]()
Pension data ![]()

Rajashri Chakrabarti is the head of Equitable Growth Studies in the Federal Reserve Bank of New York’s Research and Statistics Group.

Natalia Emanuel is a research economist in Equitable Growth Studies in the Federal Reserve Bank of New York’s Research and Statistics Group.

Ben Lahey is a research analyst in the Federal Reserve Bank of New York’s Research and Statistics Group.
How to cite this post:
By Rajashri Chakrabarti, Natalia Emanuel, and Ben Lahey, “Racial and Ethnic Wealth Inequality in the Post‑Pandemic Era,” Federal Reserve Bank of New York Liberty Street Economics, February 7, 2024, https://libertystreeteconomics.newyorkfed.org/2024/02/racial-and-ethnic-wealth-inequality-in-the-post-pandemic-era/
BibTeX: View |

Disclaimer
The views expressed in this post are those of the author(s) and do not necessarily reflect the position of the Federal Reserve Bank of New York or the Federal Reserve System. Any errors or omissions are the responsibility of the author(s).
 RSS Feed
 Follow Liberty Street Economics
Thank you for your question! The DFA are created using two Federal Reserve Board data sets: the Survey of Consumer Finances (SCF) and the Financial Accounts. The SCF provide distributional information about wealth and sampled about 6,500 households in the last release – you can find more information about the SCF at https://www.federalreserve.gov/econres/aboutscf.htm. The Financial Accounts leverage many administrative and survey datasets to generate aggregate wealth estimates by sector. You can find more general information about the Financial Accounts at https://www.federalreserve.gov/releases/z1/ or read about how the Financial Accounts (formerly the US Flow of Funds Accounts) are constructed at https://www.federalreserve.gov/pubs/bulletin/2001/0701lead.pdf.
Great research, and thank you for voicing these inequalities. Question, what was the sample size of the DFA data you used?