


After forty-three months of forbearance, the pause on federal student loan payments has ended. Originally enacted at the onset of the COVID-19 pandemic in March 2020, the administrative forbearance and interest waiver lasted until September 1, 2023, and borrowers’ monthly payments resumed this month. As discussed in an accompanying post, the pause on student loan payments afforded borrowers over $260 billion in waived payments throughout the pandemic, supporting borrowers’ consumption and savings over the last three years. In this post, we analyze responses of student loan borrowers to special questions in the August 2023 SCE Household Spending Survey designed to gauge the expected impact of the payment resumption on future spending growth, the risk of credit delinquency for borrowers, and the economy at large. The findings suggest that the payment resumption will have a relatively small overall effect on consumption, on the order of a 0.1 percentage point reduction in aggregate spending from August levels, and a (delayed) return of student loan delinquency rates back to pre-pandemic levels. Across groups, we see little variation in spending responses but find that low-income borrowers, female borrowers, those with less than a bachelor’s degree, and those who were not in repayment before the pandemic expect the highest likelihood of missed student loan payments.
The SCE Household Spending Survey is fielded every four months as a rotating module of the Survey of Consumer Expectations (SCE), which itself is a monthly, nationally representative internet-based survey of a rotating panel of household heads conducted by the Federal Reserve Bank of New York since June 2013. Here, we focus on responses by about 1,000 respondents to a special set of questions added to the August 2023 survey. Of these respondents, 225 reported having outstanding student loans, of which a subset of 151 respondents indicated that their federal student loans were previously “paused” but will be entering repayment in October. The remaining group includes those whose payments were never paused or those who are enrolled in school full-time and not resuming repayment. We asked those borrowers entering repayment how they plan to afford their looming monthly student loan payments and how their probability of missing student and non-student-loan payments will change due to the payment resumption.
We begin by briefly discussing our sample. An overwhelming majority of our sample of student loan borrowers held federal loans (with 74 percent reporting they hold federal loans only and 20 percent reporting they hold both federal and private loans). Of the 151 respondents who will be entering repayment, 71 percent were making monthly payments prior to the payment pause; roughly half of the borrowers in repayment were in a standard (ten-year) repayment plan (36 percent) and half were in an income-driven repayment (IDR) plan (35 percent). About 23 percent of our sample entering repayment were in deferment or forbearance prior to the pandemic, most under in-school deferment. Around 6 percent of borrowers were not actively making payments despite payments being required.
Expectations for Income-Driven Repayment Enrollment
We began by asking borrowers if they would enter the standard ten-year repayment plan (the default option) or enroll in an IDR plan. The Biden Administration recently debuted a new IDR plan, the Saving on a Valuable Education (SAVE) plan, that lowered payments for low-income borrowers and has already enrolled over four million borrowers (as of September 5). Our survey results suggest that the appealing terms of the SAVE plan for low-income borrowers will likely increase enrollment in IDR plans. Of those borrowers who were previously in a standard repayment plan, 20 percent expect to enroll in an IDR plan, and 84 percent of those who were previously in an IDR plan expect to remain enrolled in IDR—results that taken together would represent a modest uptick in IDR enrollment among the more seasoned borrowers. Meanwhile, borrowers who were not in repayment prior to the pandemic overwhelmingly favor IDR over the standard payment, with 78 percent of first-time repayers stating an intent to enroll in IDR. As shown by the flows in the chart below, we estimate the IDR enrollment among those in repayment would increase from 50 percent pre-pandemic to 58 percent after payments resume.
The SAVE Plan Will Likely Drive New Interest in Income-Driven Repayment (IDR) for Student Loan Borrowers
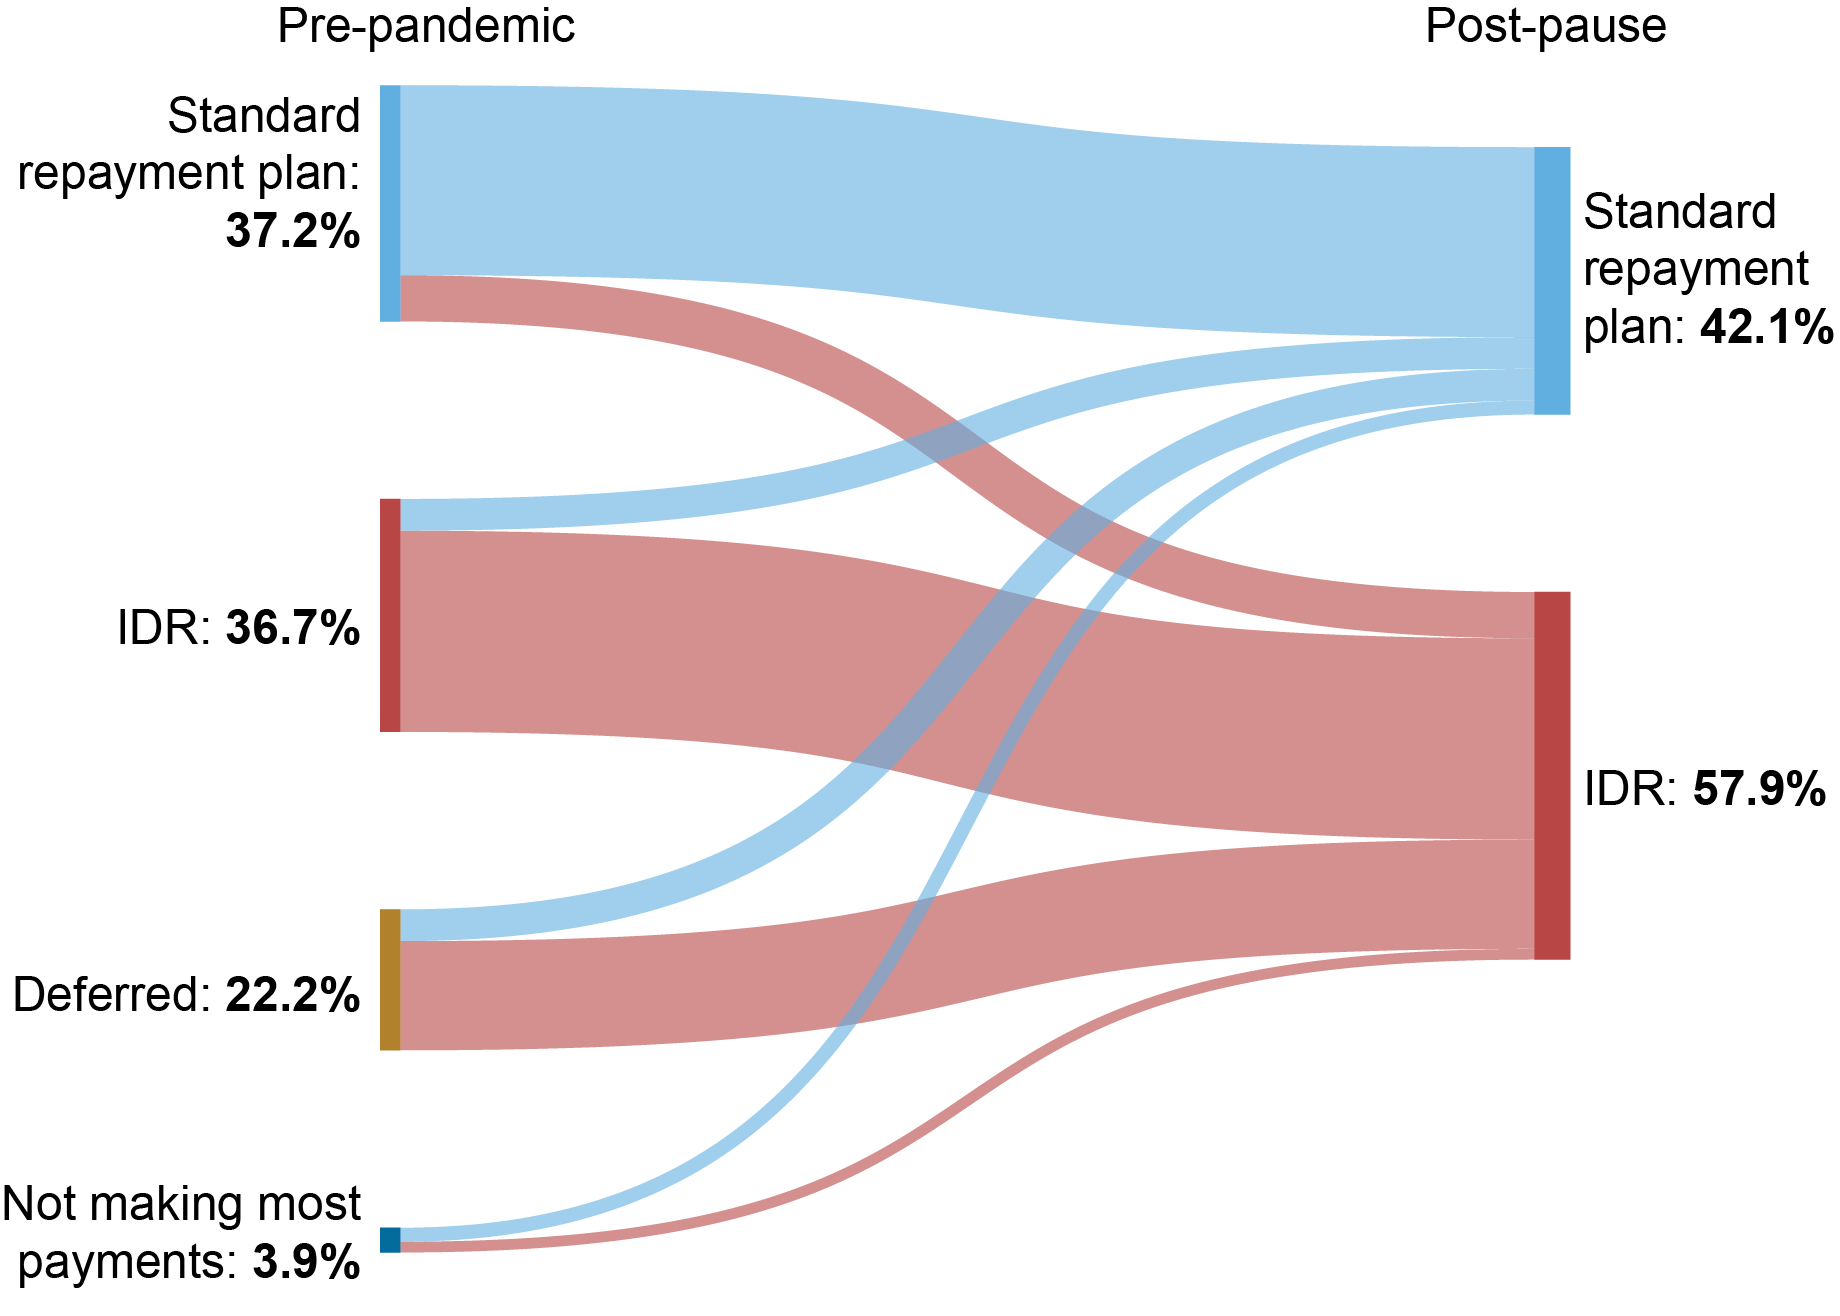
Notes: To classify borrowers into pre-pandemic groups, we asked respondents “Prior to March 2020, were you making most of the payments on these loans?,” with the following options: (a) Yes, I was in a standard repayment plan; (b) Yes, I was in an income-driven repayment plan; (c) No, my payments were deferred (i.e., in-school deferment, military deferment, etc.); or (d) No, payments were required but I was not making most payments. To classify borrowers into post-pause groups, we framed our question in this way: “The automatic forbearance and interest waiver for federal student loans will end after August 2023. In September, interest will begin to accrue, and payments will be due starting in October. What are you planning to do after student loan payment resumes? (select all that apply),” with the following options: (a) Make the standard monthly payments; (b) Enroll in an income-driven repayment plan; (c) Skip some payments; (d) Other (please specify); and (e) Not applicable (I am in school, and payments will not be required). Respondents selecting (e) were excluded from the sample. Borrowers were sorted into “standard repayment plan” or IDR using responses to (a) or (b) and open-ended responses from (d).
Expectations for Changes to Monthly Spending
Next, we turn to borrower’s expectations for changes in monthly spending (separate from student loan payments) due to the resumption of payments. More specifically, we ask borrowers, “When student loan payments resume from October, how do you expect that the payment resumption will affect your average monthly spending in the three months starting with October 2023?” On average, borrowers expect to reduce consumption by around $56 per month from their average monthly spending reported in August. If we scale this monthly decline up to the 28 million borrowers with federally-managed loans currently in forbearance, this would suggest nearly a $1.6 billion decline in monthly spending, or 0.1 percentage point of August 2023 personal consumption expenditures (PCE). For context, average monthly student loan payments for federally-managed loans was around $6 billion prior to the pandemic.
In the chart below, we plot the average reported change in expected October spending for paused borrowers as a share of their August reported average monthly spending. Most groups report relatively small expected reductions in spending while some groups report higher expected future spending despite the resumption of payments (survey panelists without student loans also report higher future spending). These relatively modest consumption declines, although not statistically different from zero, could be because borrowers already began adjusting consumption prior to August or because borrowers plan to reduce and/or deplete savings to make payments. They are also likely to reflect the large share expecting to enroll in the more generous IDR program. Due to our relatively small sample size, 95 percent confidence bands are wide across groups; however, the point estimates with the largest differences are between those with at least a bachelor’s degree (who expect larger spending reductions) and those with less than a bachelor’s degree, potentially reflecting differences in average outstanding student loan balances and payment sizes.
Paused Student Loan Borrowers Only Expect Modest Consumption Declines from August Spending when Payments Resume
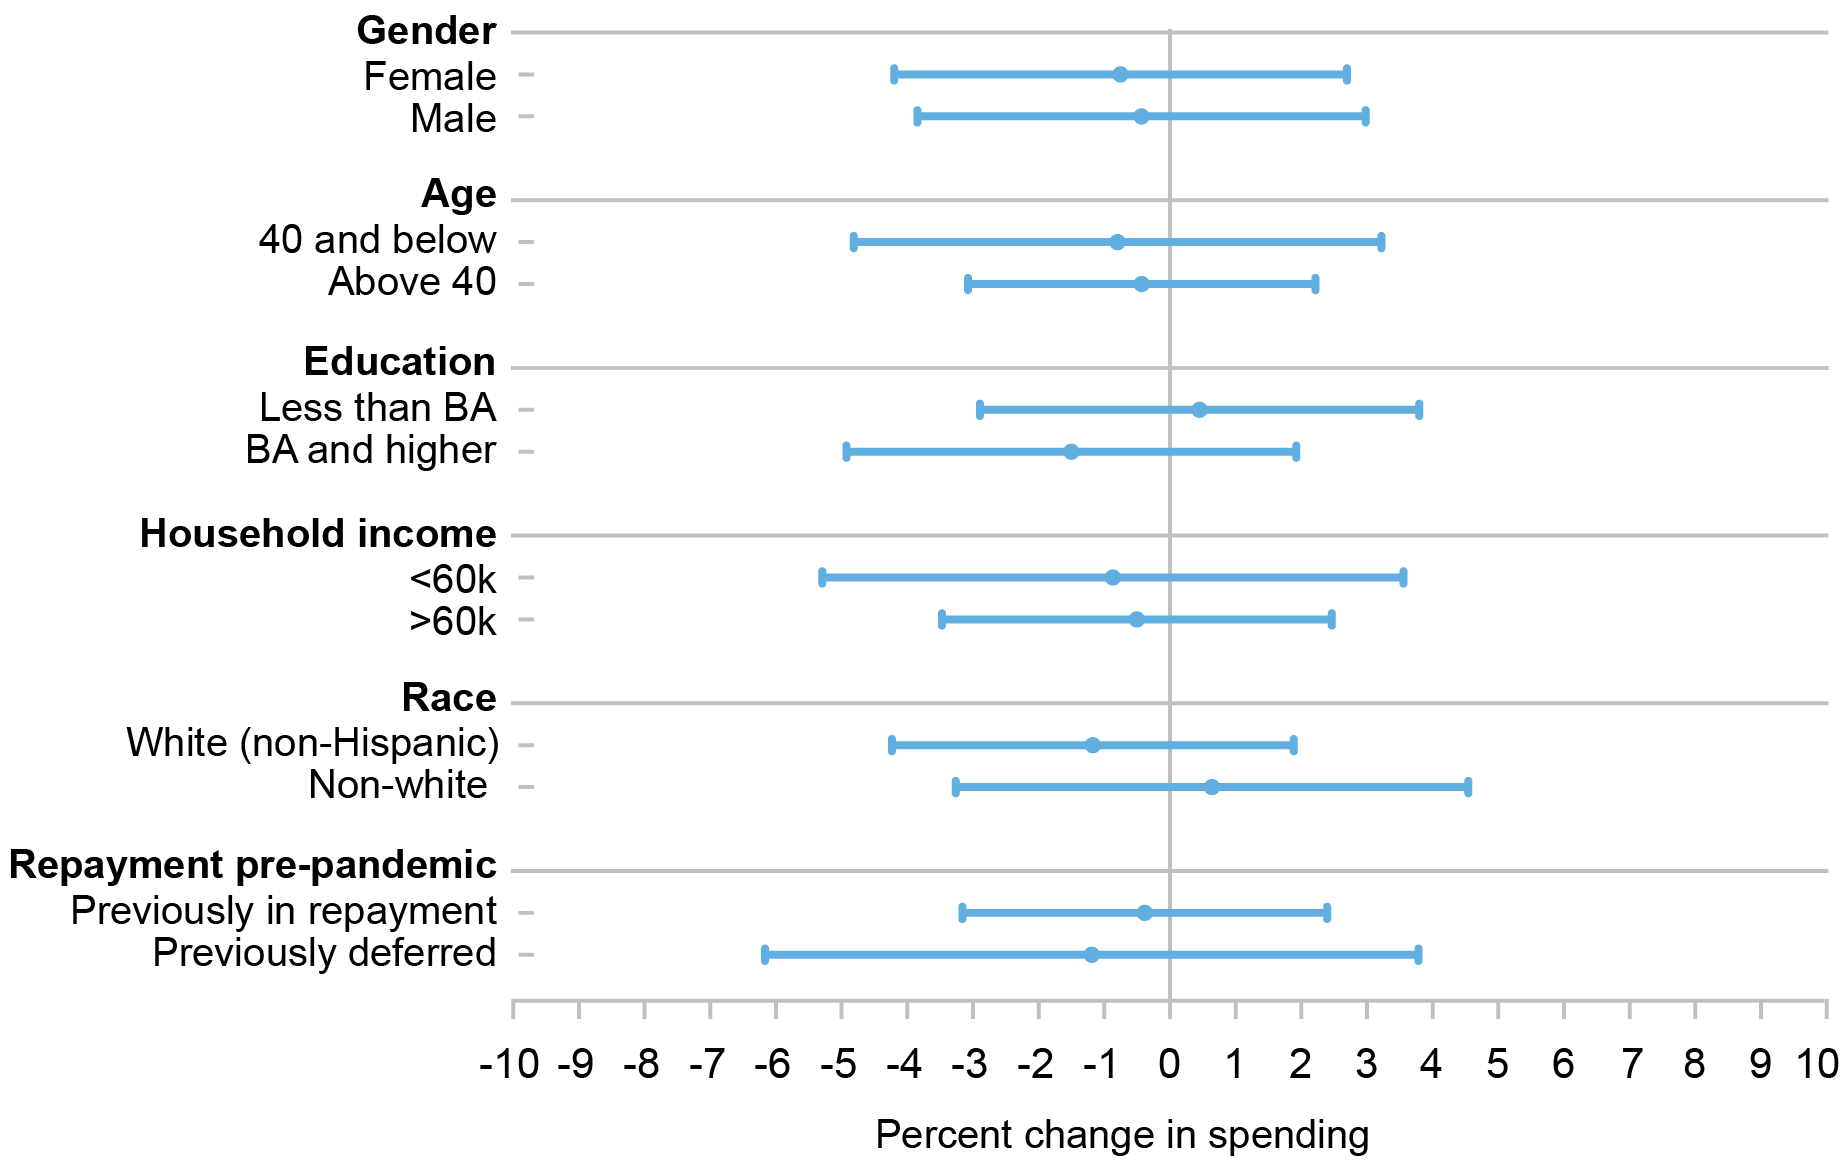
Notes: The chart reports point estimates and 95 percent confidence intervals for the expected change in spending as a share of average monthly spending, split by various groups. To calculate this share, we asked borrowers, “When student loan payments resume from October, how do you expect that the payment resumption will affect your average monthly spending in the three months starting with October 2023? Please exclude loan payments from your estimation of spending. Starting October 2023, I expect my average monthly spending to (increase/decrease) by [ ].” We then asked borrowers for their average monthly spending at the time of survey: “Approximately, what do you think was your average monthly household spending during the past three months? I estimate that my average monthly household spending was [ ].” We compute the percent change in spending for each respondent using a ratio of these two answers.
Expectations for Missing Student Loan Payments
We also asked paused student loan borrowers about the expected probability (“percent chance”) they would miss a student loan payment or a non-student-debt payment in the three months following the payment resumption. Overall, paused borrowers reported an average probability of missing a student loan debt payment of 22.6 percent. Note that this statistic may overstate expected hardship and payment difficulty. Recent guidance from the U.S. Department of Education informs student loan servicers to not report missed payments to credit bureaus. As such, borrowers may be more likely to voluntarily miss payments while consequences are less severe.
In the chart below, we compare the self-reported probability of missing a student loan payment across several groups, finding stark and statistically significant differences across gender and income. Female respondents reported more than twice the probability of missing a student loan payment at 28.9 percent compared to 12.5 percent for males. Additionally, borrowers with household income lower than $60,000 reported an average probability of missing a payment of nearly 39 percent, compared to 14.3 percent for those with household income above $60,000. Although the estimates are not statistically different, non-white borrowers reported a higher average likelihood of missing a payment than white non-Hispanic borrowers and those without a college degree reported a higher likelihood than those with a degree. Lastly, we see a large difference in expectations for missed payments between borrowers who were in repayment prior to the pause and those who are entering repayment for the first time, with first-time repayers expecting more than twice the likelihood of missed student loan payments.
Expectations for Missed Student Loan Payments Are High, but Similar to Pre-Pandemic Levels
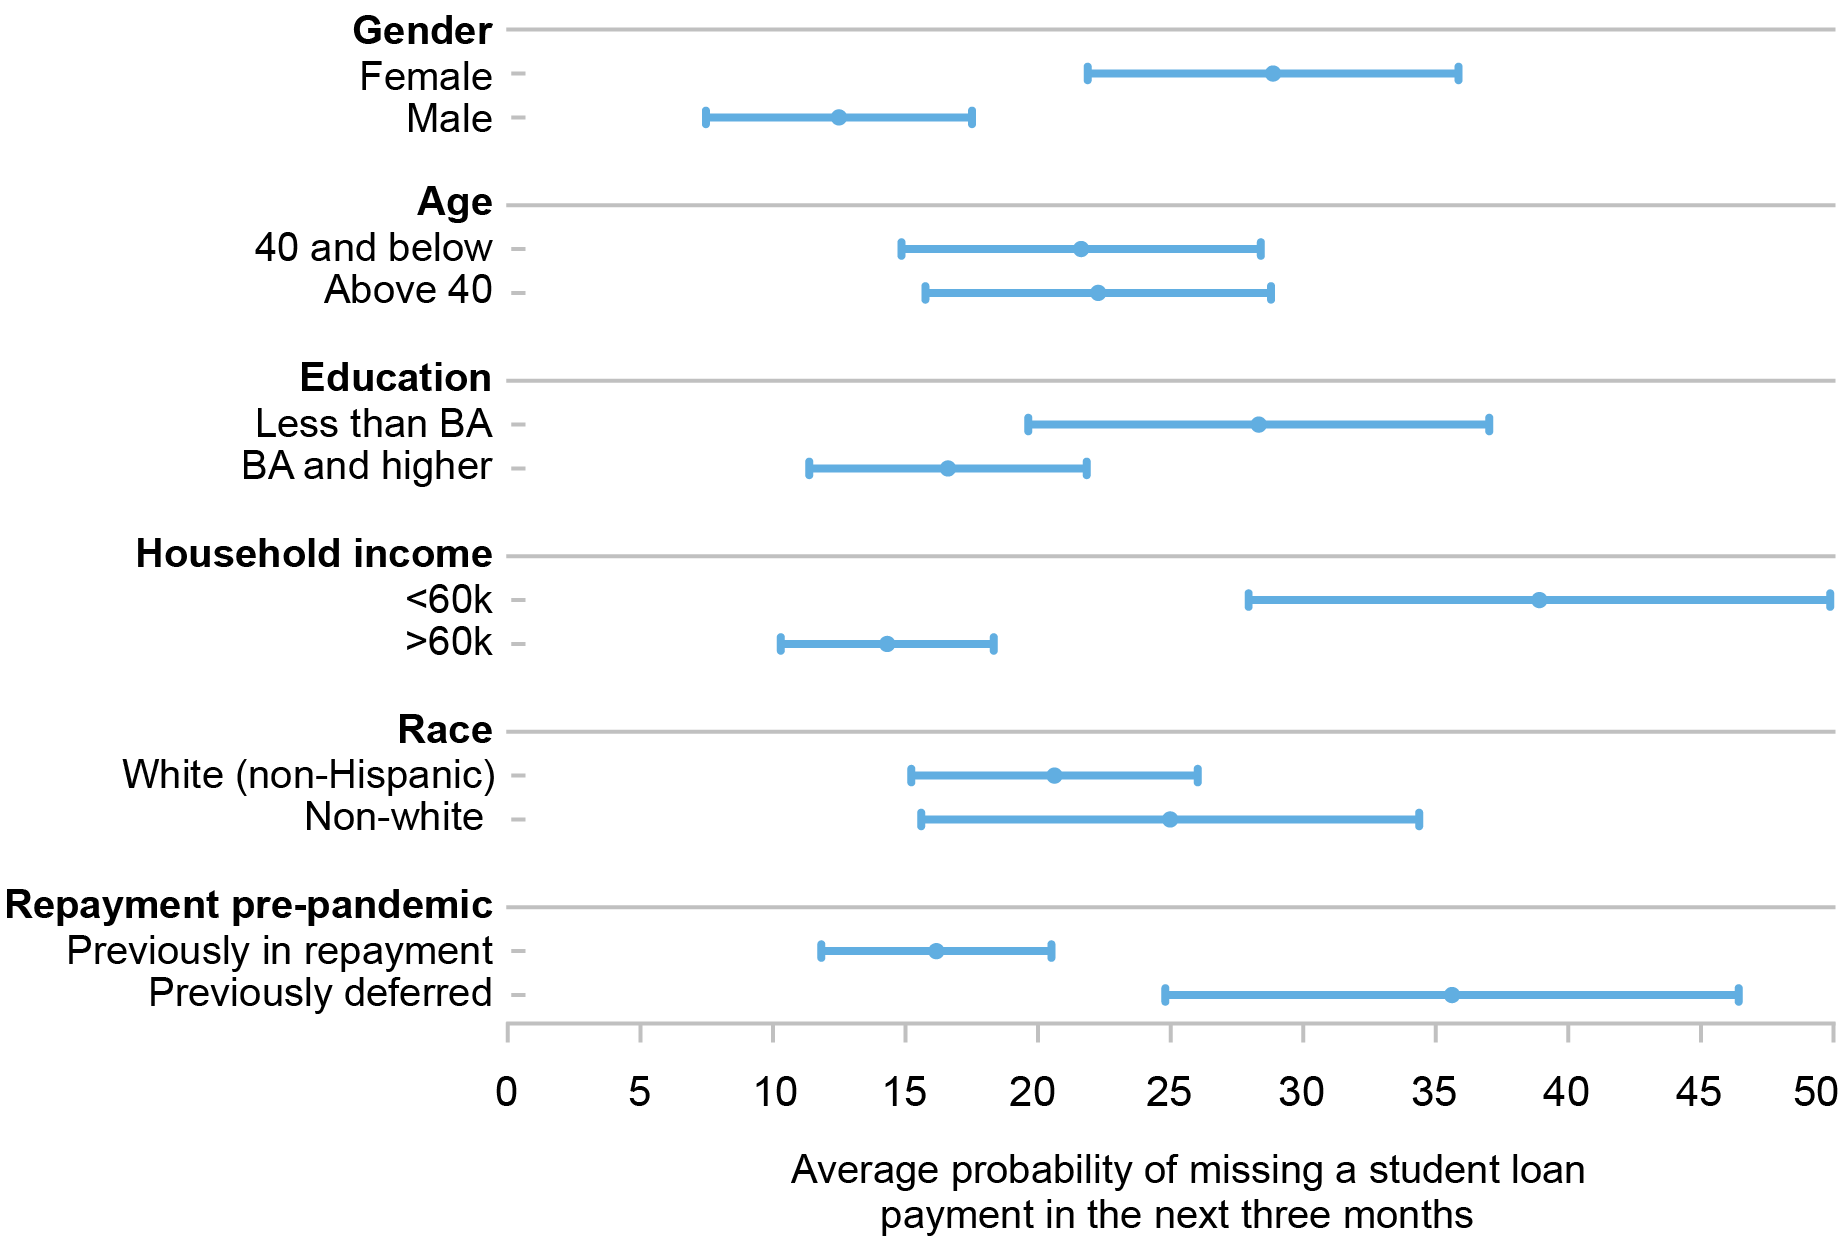
Notes: The chart reports point estimates and 95 percent confidence intervals for the expected likelihood a respondent will miss student loan payments once payments resume, split by various groups. More specifically, we ask, “When student loan payments resume from October, what is the percent chance that you will miss a minimum payment on any of your student loan debt, federal and/or private, in the three months starting with October 2023?”
But how do expectations for missed payments compare to payment delinquency before the payment pause? While we do not have an apples-to-apples, pre-pandemic comparison for expectations of student loan missed payments, we can compare this probability with the borrower delinquency rate from our 2022 Student Loan Update, based on credit report data. As shown in the update, in the fourth quarter of 2019, roughly 15 percent of all student loan borrowers were either ninety or more days delinquent or in default. However, the denominator on this delinquency rate includes borrowers not in repayment, a category of borrowers we exclude from this SCE survey sample. Removing the 15.4 million borrowers reported by the Department of Education as not in repayment (that is, in school, grace, deferment, or forbearance) suggests a pre-pandemic delinquency rate of 23 percent (for those in repayment)—a rate quite similar to the self-reported average probability of missing a student loan payment in the SCE survey of 22.6 percent.
Expectations for Missing Non-Student-Loan Payments
Lastly, we asked student loan borrowers to report the expected increase in the likelihood of missing a non-student-debt monthly obligation (such as a mortgage, credit card, or auto loan payment) due to student loan payments restarting. On average, borrowers reported a 11.8 percent increase in the likelihood of missing a non-student debt payment owing to the student debt payment resumption. Borrowers across groups were also much more similar in their expectations of missing payments for other obligations than for student loans, with no evidence of statistical difference between groups. Interestingly, female respondents reported a lower probability of missing a non-student-loan payment than male respondents (although not statistically different). That female respondents report a far higher likelihood of missing student loan payments than males suggests female borrowers may be more likely than male borrowers to prioritize their non-student-loan obligations ahead of student debt if they face difficulties fulfilling all debt obligations.
Conclusion
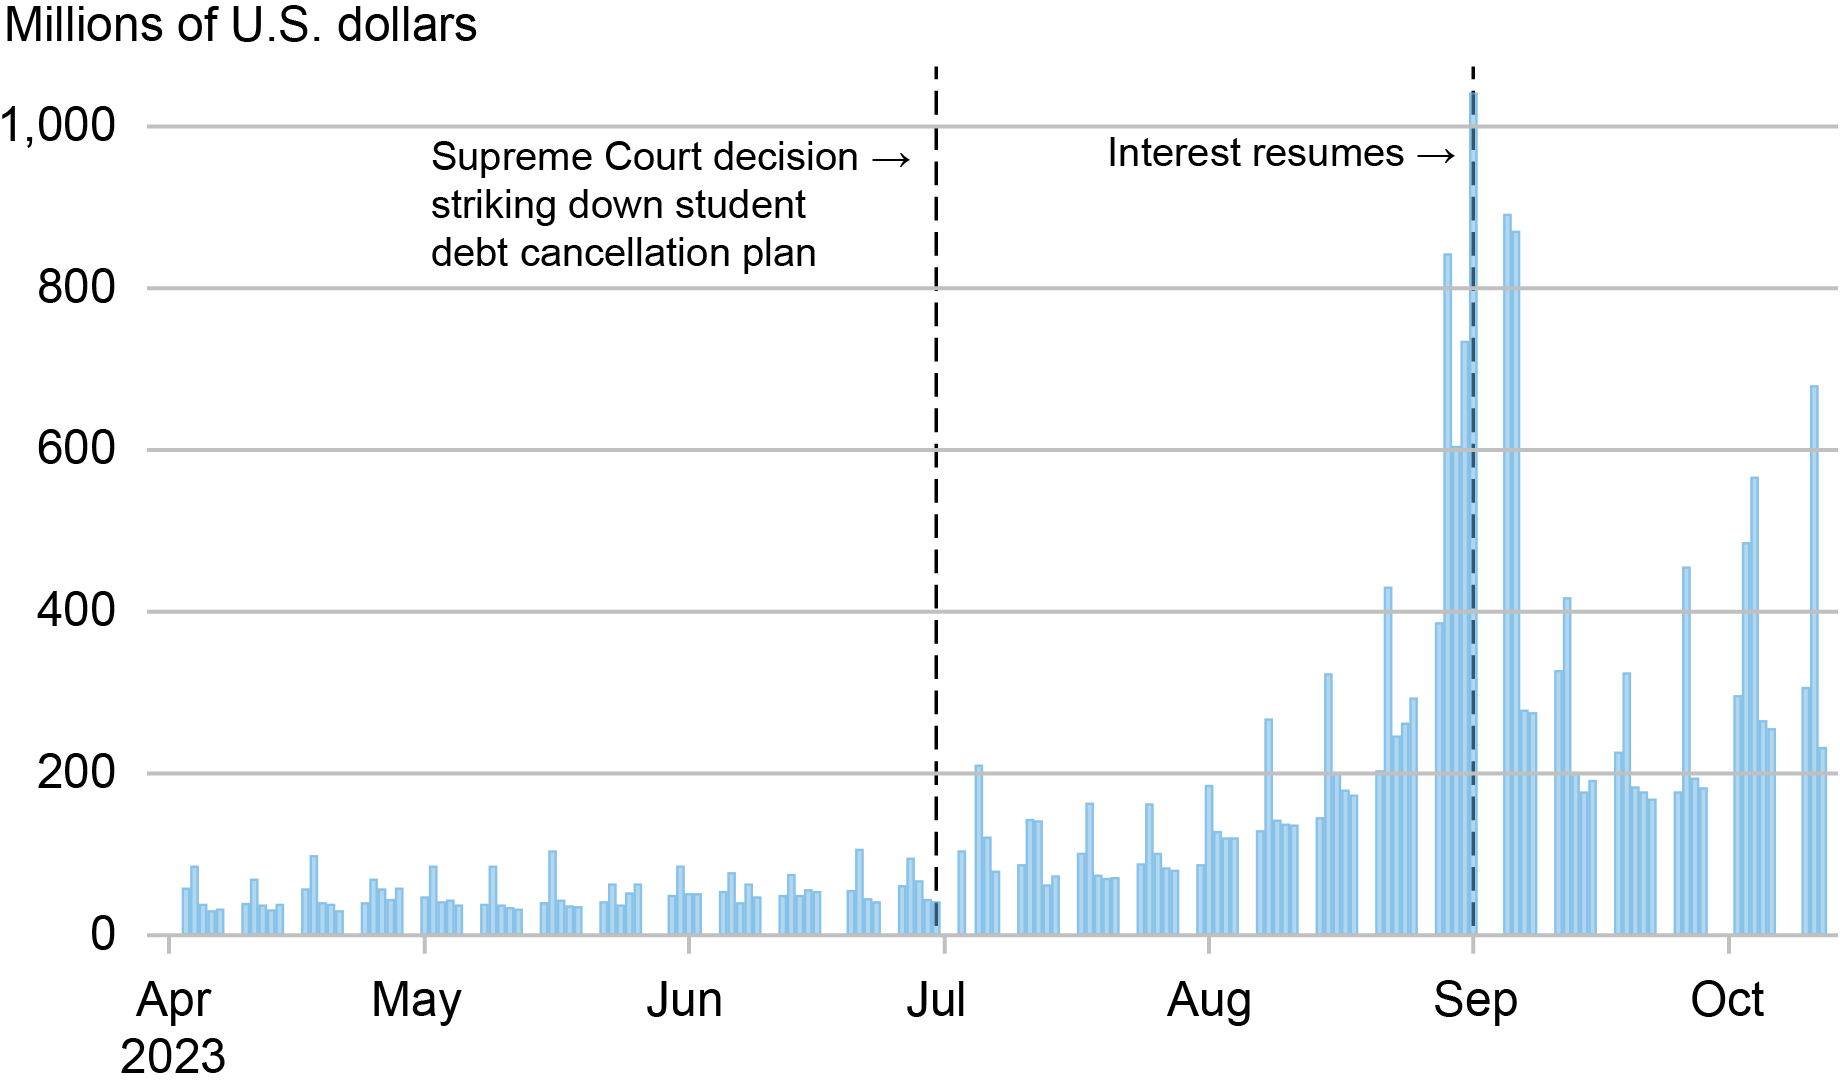
Consumer spending has been surprisingly strong so far in 2023. However, there is considerable concern about the strength of headwinds stemming from the resumption of student loan payments, with some economic forecasters predicting it could lower consumption growth by as much as 0.8 percentage point. There are also concerns about rising delinquencies as payments resume, perhaps to levels higher than before the pandemic. Our findings here based on expectations survey responses suggest only modest reductions in spending for borrowers entering repayment (of approximately 0.1 percentage point of August PCE) and likelihood of missed student loan payments roughly in line with pre-pandemic levels. One reason for these relatively small effects is that potentially many borrowers already made changes to their savings and consumption decisions after learning that payments would certainly resume in October. The chart below shows some evidence for this hypothesis. Here, we plot the daily deposits at the U.S. Treasury by the Department of Education, of which the overwhelming majority are federal student loan payments. We see that deposits increased after the U.S. Supreme Court decision reversing the broad student loan forgiveness program and continued to rise up until the end of the zero percent interest waiver. This pattern seems consistent with some borrowers electing to make bulk payments against their loans after learning that their loans would not be forgiven and before interest resumed.
Total Daily Education Department Deposits at U.S. Treasury
Another likely reason behind the less-than-dire forecast as the payment pause ends is the strength still apparent in the health of the U.S. consumer. Several policy changes by the White House and Department of Education bode well, too. A large take-up of the new SAVE plan would reduce monthly payments and waive unpaid interest for low-income student loan borrowers, and a one-year “on ramp” for borrowers will ignore missed payments for credit reporting purposes. In addition, more than $127 billion in federal student loans across over 3.6 million borrowers was cancelled or forgiven during the pandemic payment pause. While these factors will make the resumption of payments more smooth than otherwise, and lessen the expected decline in consumption growth, some student loan borrowers will surely struggle managing their debt obligations just as before the pandemic forbearance. Nevertheless, we expect the potential spillover to the broader economy to be limited, and we will continue to monitor developments in the coming months.

Rajashri Chakrabarti is the head of Equitable Growth Studies in the Federal Reserve Bank of New York’s Research and Statistics Group.

Daniel Mangrum is a research economist in Household and Public Policy Research in the Federal Reserve Bank of New York’s Research and Statistics Group.

Sasha Thomas is a research analyst in the Federal Reserve Bank of New York’s Research and Statistics Group.

Wilbert van der Klaauw is an economic research advisor on Household and Public Policy Research in the Federal Reserve Bank of New York’s Research and Statistics Group.
How to cite this post:
Raji Chakrabarti, Daniel Mangrum, Sasha Thomas, and Wilbert van der Klaauw, “Borrower Expectations for the Return of Student Loan Repayment,” Federal Reserve Bank of New York Liberty Street Economics, October 18, 2023, https://libertystreeteconomics.newyorkfed.org/2023/10/borrower-expectations-for-the-return-of-student-loan-repayment/
BibTeX: View |

Disclaimer
The views expressed in this post are those of the author(s) and do not necessarily reflect the position of the Federal Reserve Bank of New York or the Federal Reserve System. Any errors or omissions are the responsibility of the author(s).
 RSS Feed
 Follow Liberty Street Economics