


China’s leader Xi Jinping recently laid out the goal of reaching the per capita income of “a mid-level developed country by 2035.” Is this goal likely to be achieved? Not in our view. Continued rapid growth faces mounting headwinds from population aging and from diminishing returns to China’s investment-centered growth model. Additional impediments to growth appear to be building, including a turn toward increased state management of the economy, the crystallization of legacy credit issues in real estate and other sectors, and limits on access to key foreign technologies. Even given generous assumptions concerning future growth fundamentals, China appears likely to close only a fraction of the gap with high-income countries in the years ahead.
Some Unpleasant Growth Arithmetic
While it’s not clear exactly what peer group Xi had in mind in referring to developed countries, those classified as “Advanced Economies” by the IMF seem a natural choice. This group consists of thirty-two economies, with 2022 per capita incomes ranging from $36,900 at the bottom (Greece) to $127,600 at the top (Singapore) measured at purchasing power parity. (Converting dollar incomes to PPP terms corrects for cost-of-living differences across countries.) We define “mid-level” as beginning at the 25th percentile for this group, corresponding to a per capita income of $49,300.
China is currently a middle-income country, with a per capita income of $21,400, placing it just above the 60th percentile of the global income distribution. China has a long way to go to meet our income threshold. Per capita income would need to rise by a factor of 2.3, corresponding to an average growth rate of 6.6 percent to reach the threshold by 2035. Annual income growth would have to be 4.3 percent to match the current level in Greece by that year.
A look at history underscores the daunting nature of this task. Of the forty-three countries that had reached China’s current income level by 2009, not one managed to achieve the growth rate needed to push China to the Advanced Economy 25th percentile over the subsequent thirteen years (see chart below). Indeed, the median thirteen-year income growth rate for this group comes to 3.1 percent, with only five seeing growth above 4 percent. And for the twenty-four countries with incomes above $49,300, it took an average of thirty-two years to make the climb from China’s current income level. Only two did so in less than twenty years.
High-Income Status by 2035 Requires Unprecedented Growth
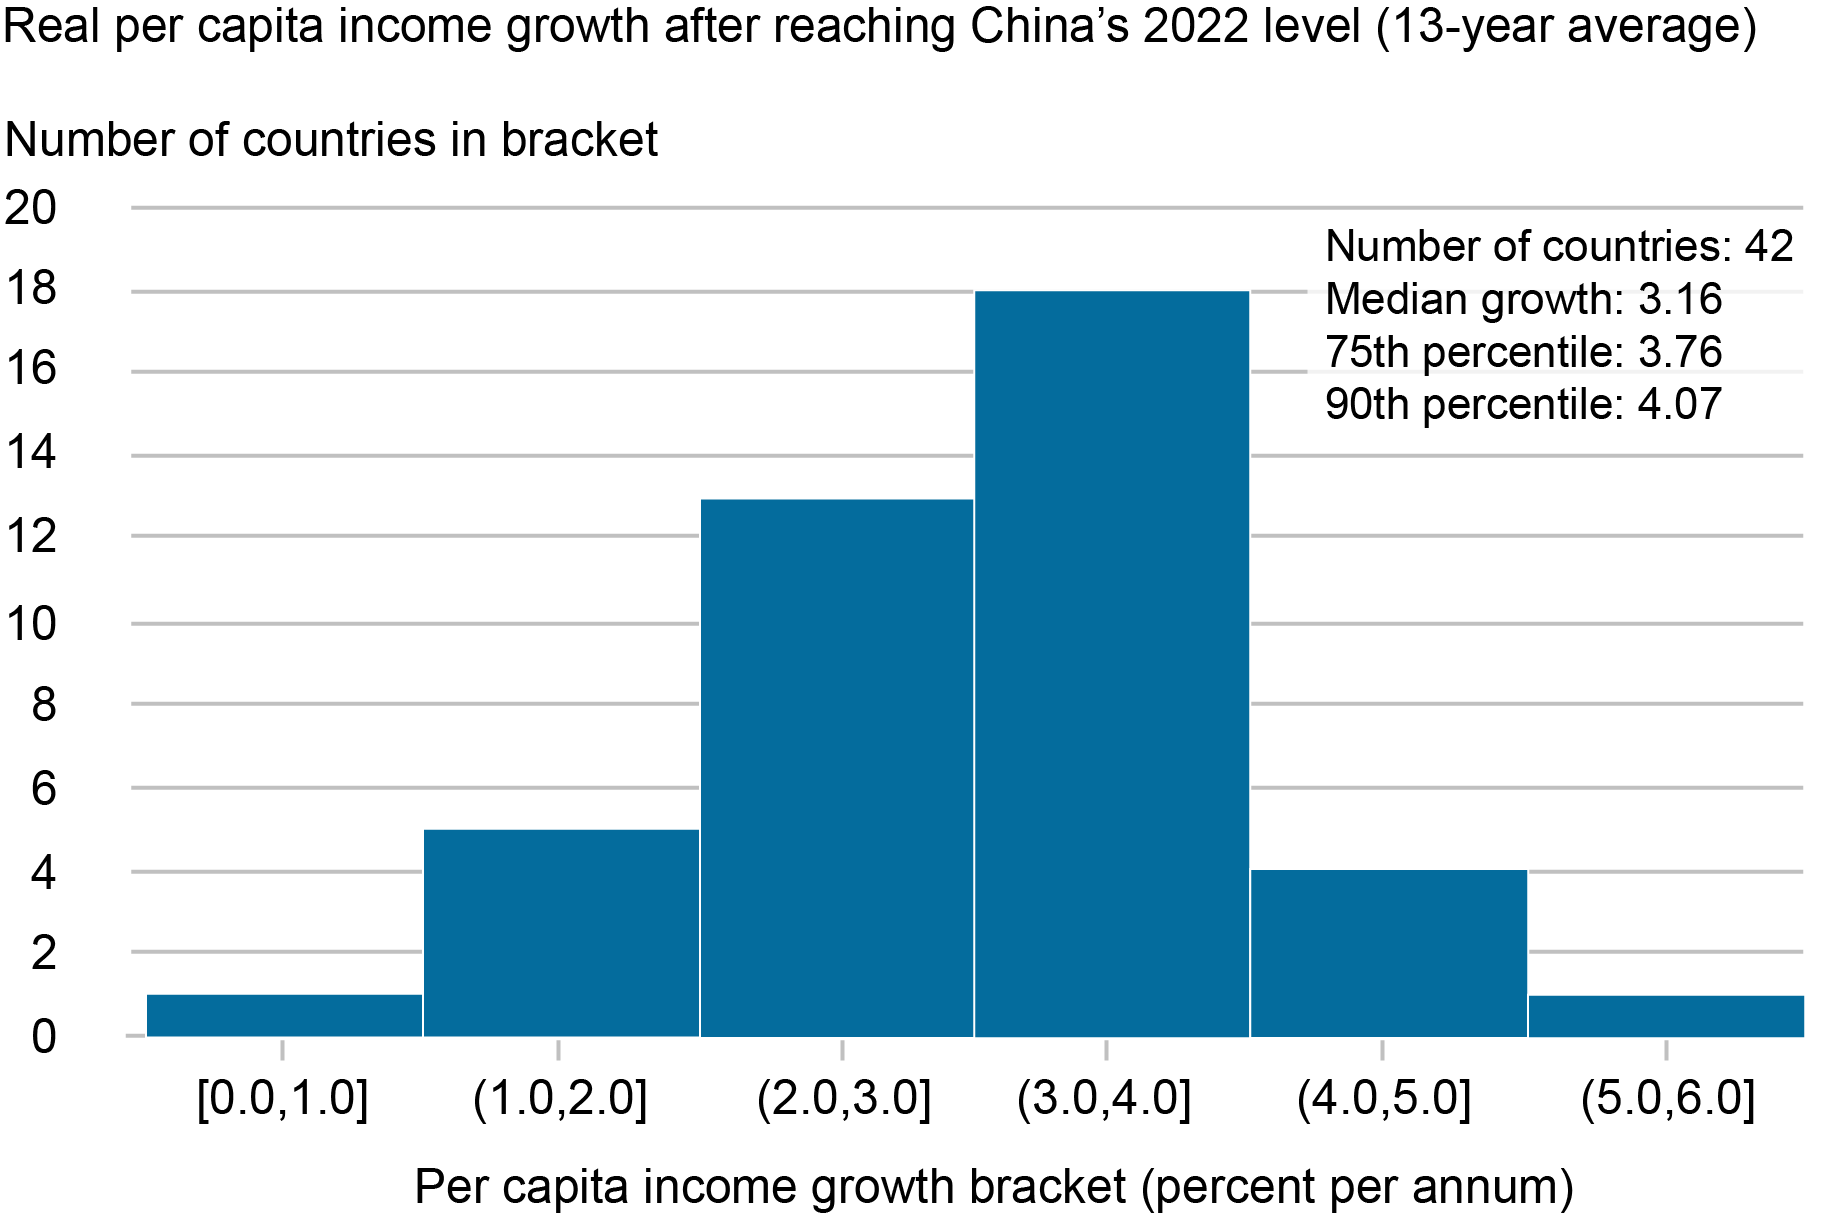
Sources: Penn World Table, version 10.01; IMF WEO database, April 2023; authors’ calculations.
Note: Per capita income growth is GDP growth less population growth.
A growth optimist will no doubt point to China’s robust growth trajectory since market reforms were initiated in the early 1980s. Per capita income growth came to 6.5 percent from 2009 to 2022 and was even faster during the two prior thirteen-year periods (9.4 percent during 1996-2009 and 8.8 percent during 1983—1996). Remarkably, China was the global income growth leader during all three periods.
China’s past growth performance is indeed impressive. Even so, the official data show trend income growth slowing since the mid-2000s (see the blue line in the chart below, which shows five-year growth rates). The authorities’ income goals involve reversing or at least arresting this trend.
Chinese Real Income Growth Has Been Slowing
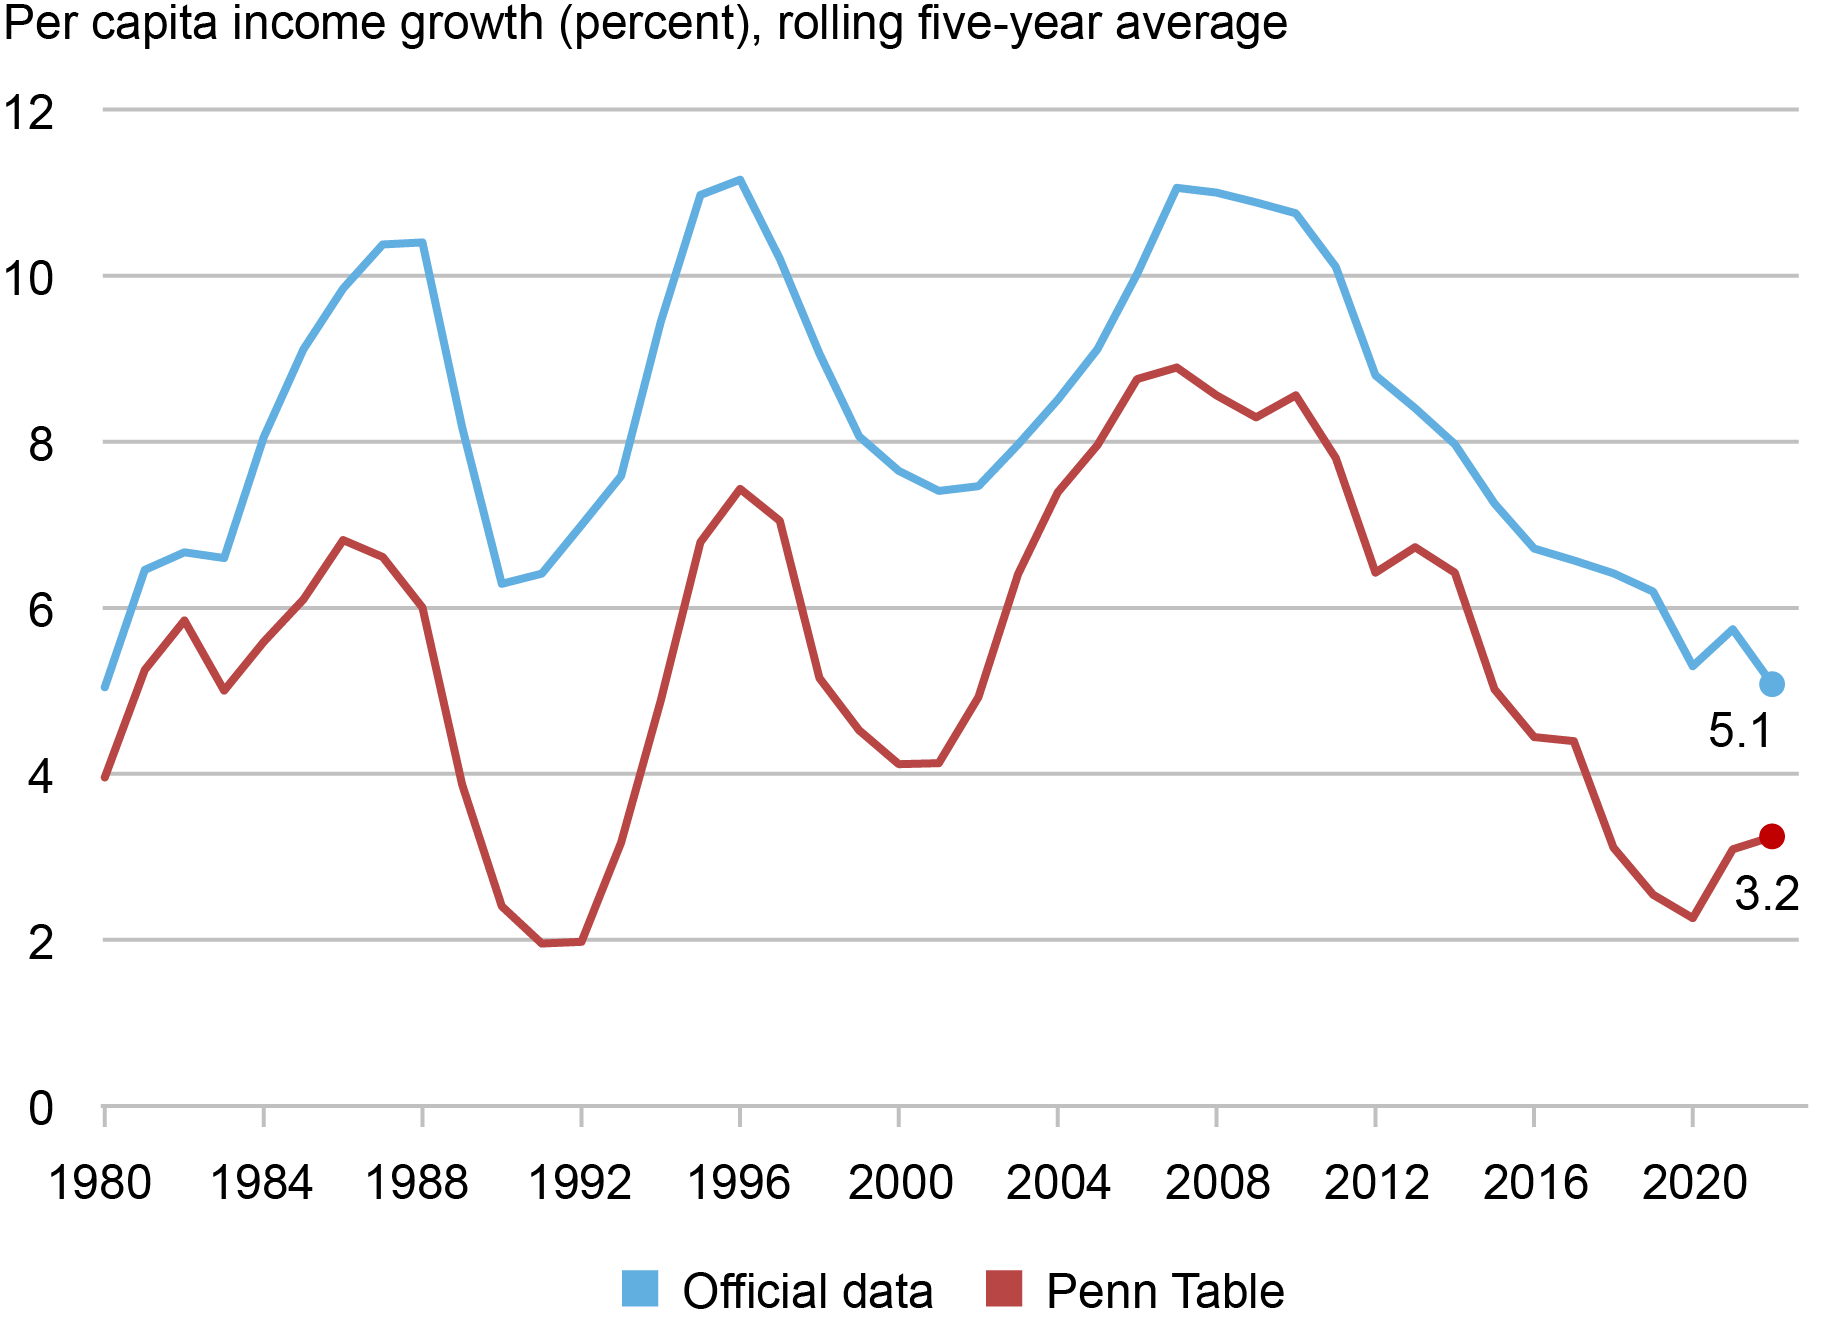
Sources: China National Bureau of Statistics; Penn World Table, version 10.01; Total Economy Database (Conference Board).
Notes: Per capita income growth is GDP growth less population growth. *Growth data for 2020 through 2022 (as part of five-year averages) taken from Total Economy Database.
Moreover, these figures take China’s official growth statistics at face value. There has long been skepticism over the accuracy of China’s statistics, which we have discussed in earlier work, and many analysts believe that growth has been systematically overstated. Economist Harry Wu has given substance to the view, proposing a number of adjustments to the official data. These adjustments provide the basis for alternative series published in leading international datasets such as the Penn World Table and the Conference Board’s Total Economy Database. China’s income growth performance remains exceptional even given these adjustments, placing in the top decile of the global distribution during each of the three recent thirteen-year periods. But these data show growth already slowing to “only” at 4.4 percent from 2009 to 2022—barely fast enough to climb to the bottom of the Advanced Economy ranks by 2035—and to a still slower pace for the last five years (the red line in the chart above).
The debate over China’s true growth rate remains unsettled. Fortunately, we don’t need to settle it. As we’ll see, a look at the evolving sources of growth in China suggests that it will fall below our benchmarks even if the official data are correct.
Lessons from the Neoclassical Growth Model
The standard neoclassical growth model provides a useful framework for assessing China’s growth prospects. Under the model, economic growth comes from two basic sources: increases in labor and capital inputs, and improvements in technology. Growth contributions from labor and capital are equal to the growth rates of these inputs, weighted by their shares in the value of production. The growth contribution from technology (termed “total factor productivity” or TFP) is calculated as a residual, as the increase in output not explained by higher inputs.
A neoclassical perspective reveals two fundamental constraints on China’s future growth performance. Labor inputs are set to decline under the weight of population aging. According to projections from the United Nations, China’s working age (20-64) population will fall by 6 percent by 2035. In principle, increases in labor force participation or hours per worker could offset some of the decline in the working age population. But China already ranks high on both these measures. At best, moves higher could offset only a fraction of the demographic drag.
China’s high share of investment spending in GDP—consistently above 40 percent since the mid 2000s—has supported a rapid buildup in the country’s capital stock. Indeed, China’s capital-output ratio is now among the highest in the world in PPP terms. But capital accumulation is subject to diminishing returns: A given increment makes a smaller contribution to growth when capital is abundant than it does when capital is scarce. Moreover, as the capital stock rises relative to output, a higher share of new investment must go to offset ongoing depreciation. The impact of diminishing returns is already in evidence. According to our estimates, increased capital inputs contributed an average of 3.4 percentage points to GDP growth in 2018-22, versus 4.3 percentage points for 2013-17.
In earlier work based on the neoclassical framework, we found that the growth contribution from capital will continue to fade in the years ahead, even given favorable assumptions. Updated projections taking in new data reinforce this conclusion, implying a contribution of 1.4-1.9 percentage points for the period through 2035. (For details, see our appendix on China growth scenarios.) Taken together, we expect reduced contributions from labor and capital to hold income growth below 4 percent absent an offsetting acceleration in TFP growth.
A surge in TFP growth, however, seems unlikely, since productivity growth in China is already quite high, averaging 1.8 percent since 2009. Only five of the forty-three countries that reached China’s current income level in the past saw TFP growth that high over the subsequent thirteen years (see chart below). Not one managed to exceed this pace by more than a few tenths of a percentage point. In short, China will need to achieve TFP growth in excess of the fastest historical precedents to meet official income goals. Moreover, these estimates assume that the official growth figures are accurate. If the lower growth rates of Wu’s work are correct, TFP growth has already fallen to about zero.
Productivity Growth of 2 Percent Is Rare
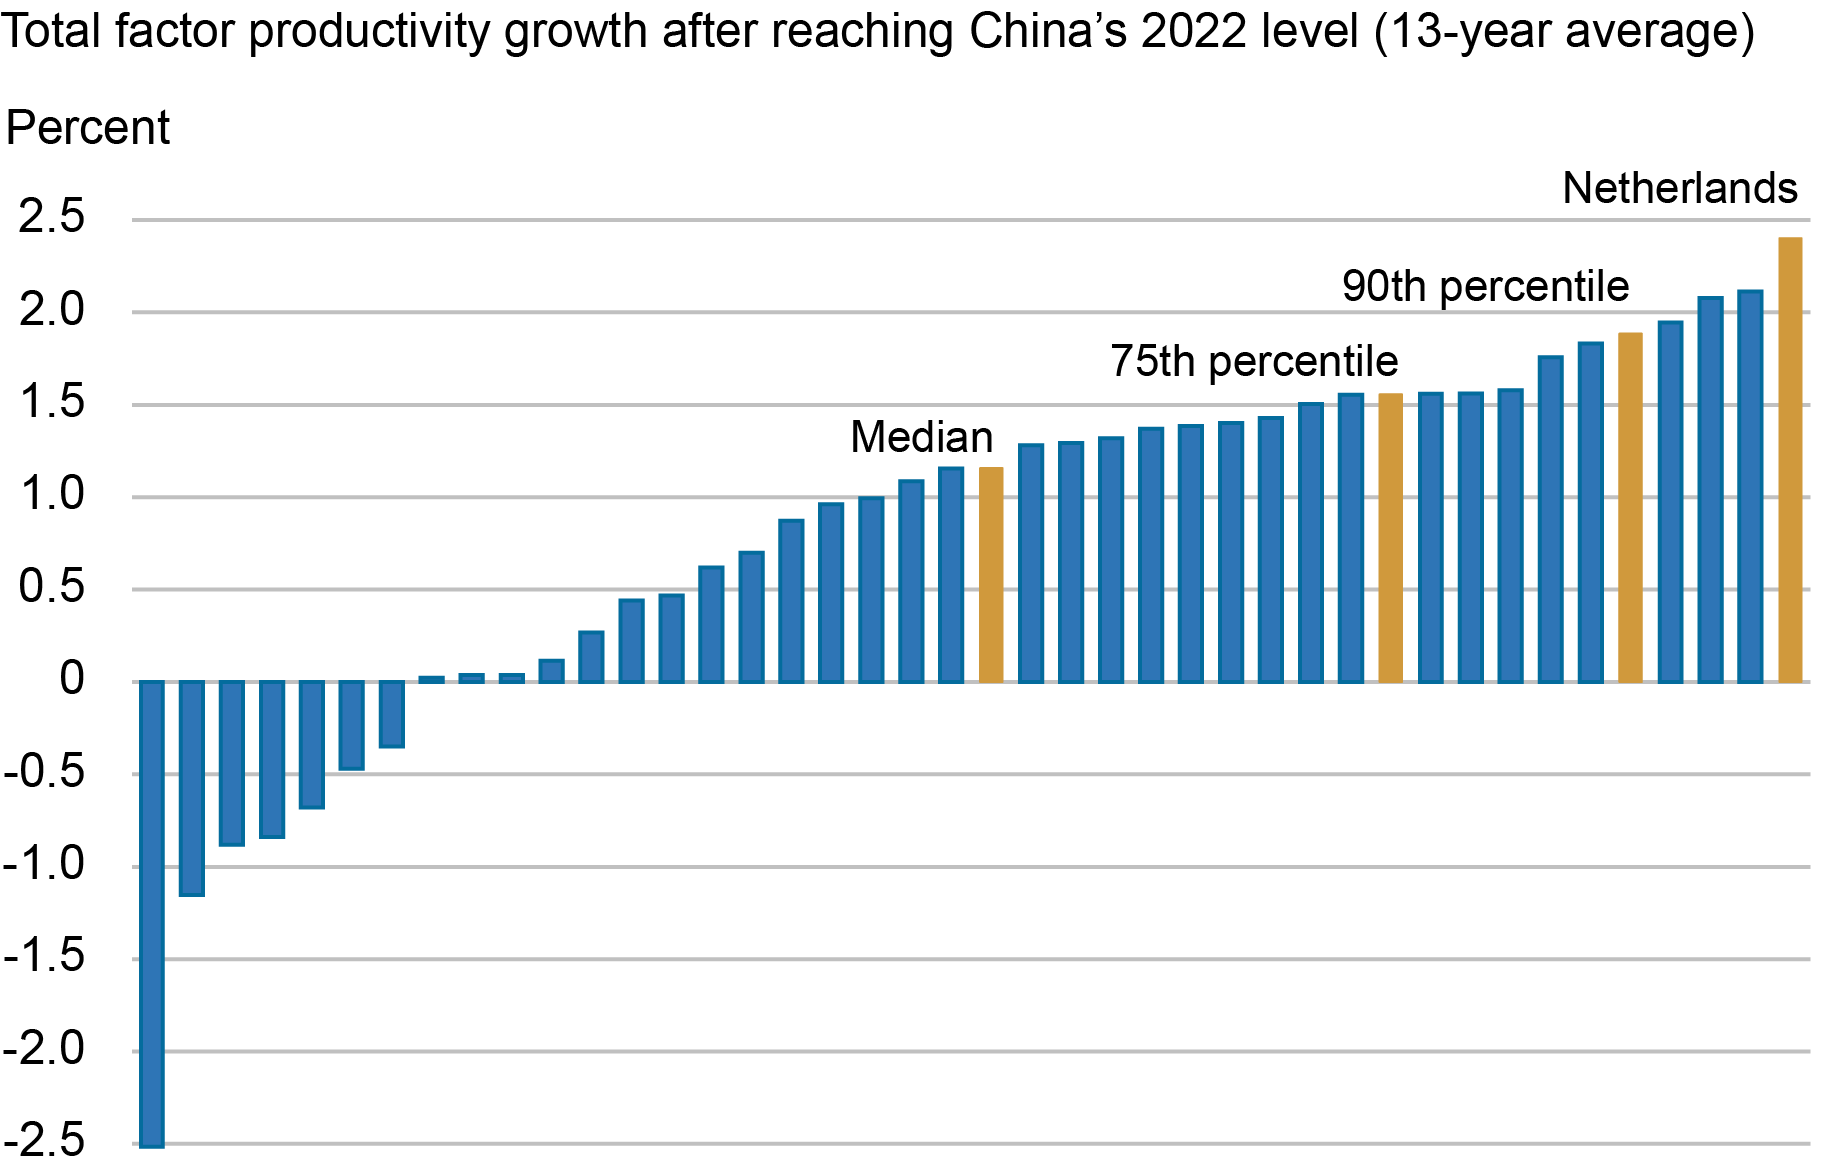
Sources: Penn World Table, version 10.01; IMF WEO database, April 2023; authors’ calculations.
Notes: Country sample size: 42. The TFP growth spurt for the Netherlands covers 1964-77.
Structural Headwinds
In our view, however, a combination of longstanding and emerging structural headwinds will make it difficult for China to match its past productivity performance, let alone exceed it. The longstanding headwinds have been widely discussed elsewhere, including in our own work, and we will simply list them here:
- Pervasive state and Communist Party management of the economy, a tendency that has grown more pronounced under President Xi’s tenure.
- Lagging institutional development, reflected for example in low scores on survey-based measures such as the World Bank’s Worldwide Governance Indicators.
- The need to rebalance the economy away from an excessive reliance on investment spending and toward consumption-led growth.
- High private sector and government debt levels, built up in financing investment-led growth.
New headwinds have emerged alongside these longstanding ones. China’s growth has long been dependent on property sector activity. (By some measures, real estate accounts for one quarter of economic activity.) Chinese authorities have traditionally relied on relaxing or tightening credit and regulation for the sector to smooth out cycles in GDP growth. Over the last two years, however, real estate activity has gone into an extended decline, seemingly unresponsive to official efforts to support activity.
Current strains in the property sector serve as an example of the broader challenge of managing a rotation away from credit- and investment-centered growth. But these strains have their own dynamic. Shifting away from investment-led growth will entail a substantial reallocation of government expenditure from investment to consumption and household transfer payments. At the same time, though, overall government deficits and debt are already very large. Any such shift in expenditure priorities will be intertwined with the politically thorny issue of government debt restructuring.
A second emerging headwind involves the move by China’s trading partners toward onshoring and derisking. The pandemic revealed the fragility of countries’ global supply chains, many centered on China. In addition, geopolitical tensions between China and key trading partners have mounted in recent years. These forces have prompted moves to bring supply chains closer to home, and where they remain international in character, to locate them in countries with whom relations are less fraught—policies that U.S. and European officials have referred to as “derisking.”
In addition, increased geopolitical tensions have prompted the U.S. and its security partners to impose new limits on China’s access to critical foreign technologies. For example, last October the U.S. government issued major export controls that substantially blocked Chinese access to key technologies for manufacturing or acquiring cutting-edge integrated circuits, or even products containing such integrated circuits. This U.S. action was later joined by major security partners, notably including Japan and the Netherlands. These controls in essence are designed to roll back Chinese chipmaking technologies to pre-2014 levels. More recently, the U.S. issued an Executive Order that places targeted restrictions on certain outward investments in China by U.S. entities.
We do not know yet how severely property and derisking headwinds will crimp China’s future growth. But they clearly limit the prospects for maintaining past productivity performance.
Conclusion
China has many compelling strengths: a well-educated population, including half the world’s trained engineers; high-quality and still-improving infrastructure and an efficient distribution system; high if uneven state capacity; and clear leads in important new technologies, including solar power, battery production, and electric vehicles. China could surprise us and achieve Xi’s lofty income growth target. But that bet comes with stiff odds.

Hunter L. Clark is an international policy advisor in International Studies in the Federal Reserve Bank of New York’s Research and Statistics Group.

Matthew Higgins is an economic research advisor in International Studies in the Federal Reserve Bank of New York’s Research and Statistics Group.
How to cite this post:
Hunter L. Clark and Matthew Higgins, “Can China Catch Up with Greece?,” Federal Reserve Bank of New York Liberty Street Economics, October 19, 2023, https://libertystreeteconomics.newyorkfed.org/2023/10/can-china-catch-up-with-greece/
BibTeX: View |


Disclaimer
The views expressed in this post are those of the author(s) and do not necessarily reflect the position of the Federal Reserve Bank of New York or the Federal Reserve System. Any errors or omissions are the responsibility of the author(s).
 RSS Feed
 Follow Liberty Street Economics