


The bank failures that occurred in March 2023 highlighted how unrealized losses on securities can make banks vulnerable to a sudden loss of funding. This risk, which materialized following the rapid rise in interest rates that began in early 2022, underscores the importance of monitoring the vulnerabilities of the banking system. In this post, as in previous years, we provide an update of four analytical models aimed at capturing different aspects of vulnerability of the U.S. banking system, with data through the second quarter of 2023. In addition, we discuss changes made to the methodology based on the lessons from March 2023 and assess how the system-level vulnerability has evolved.
How Do We Measure Banking System Vulnerability?
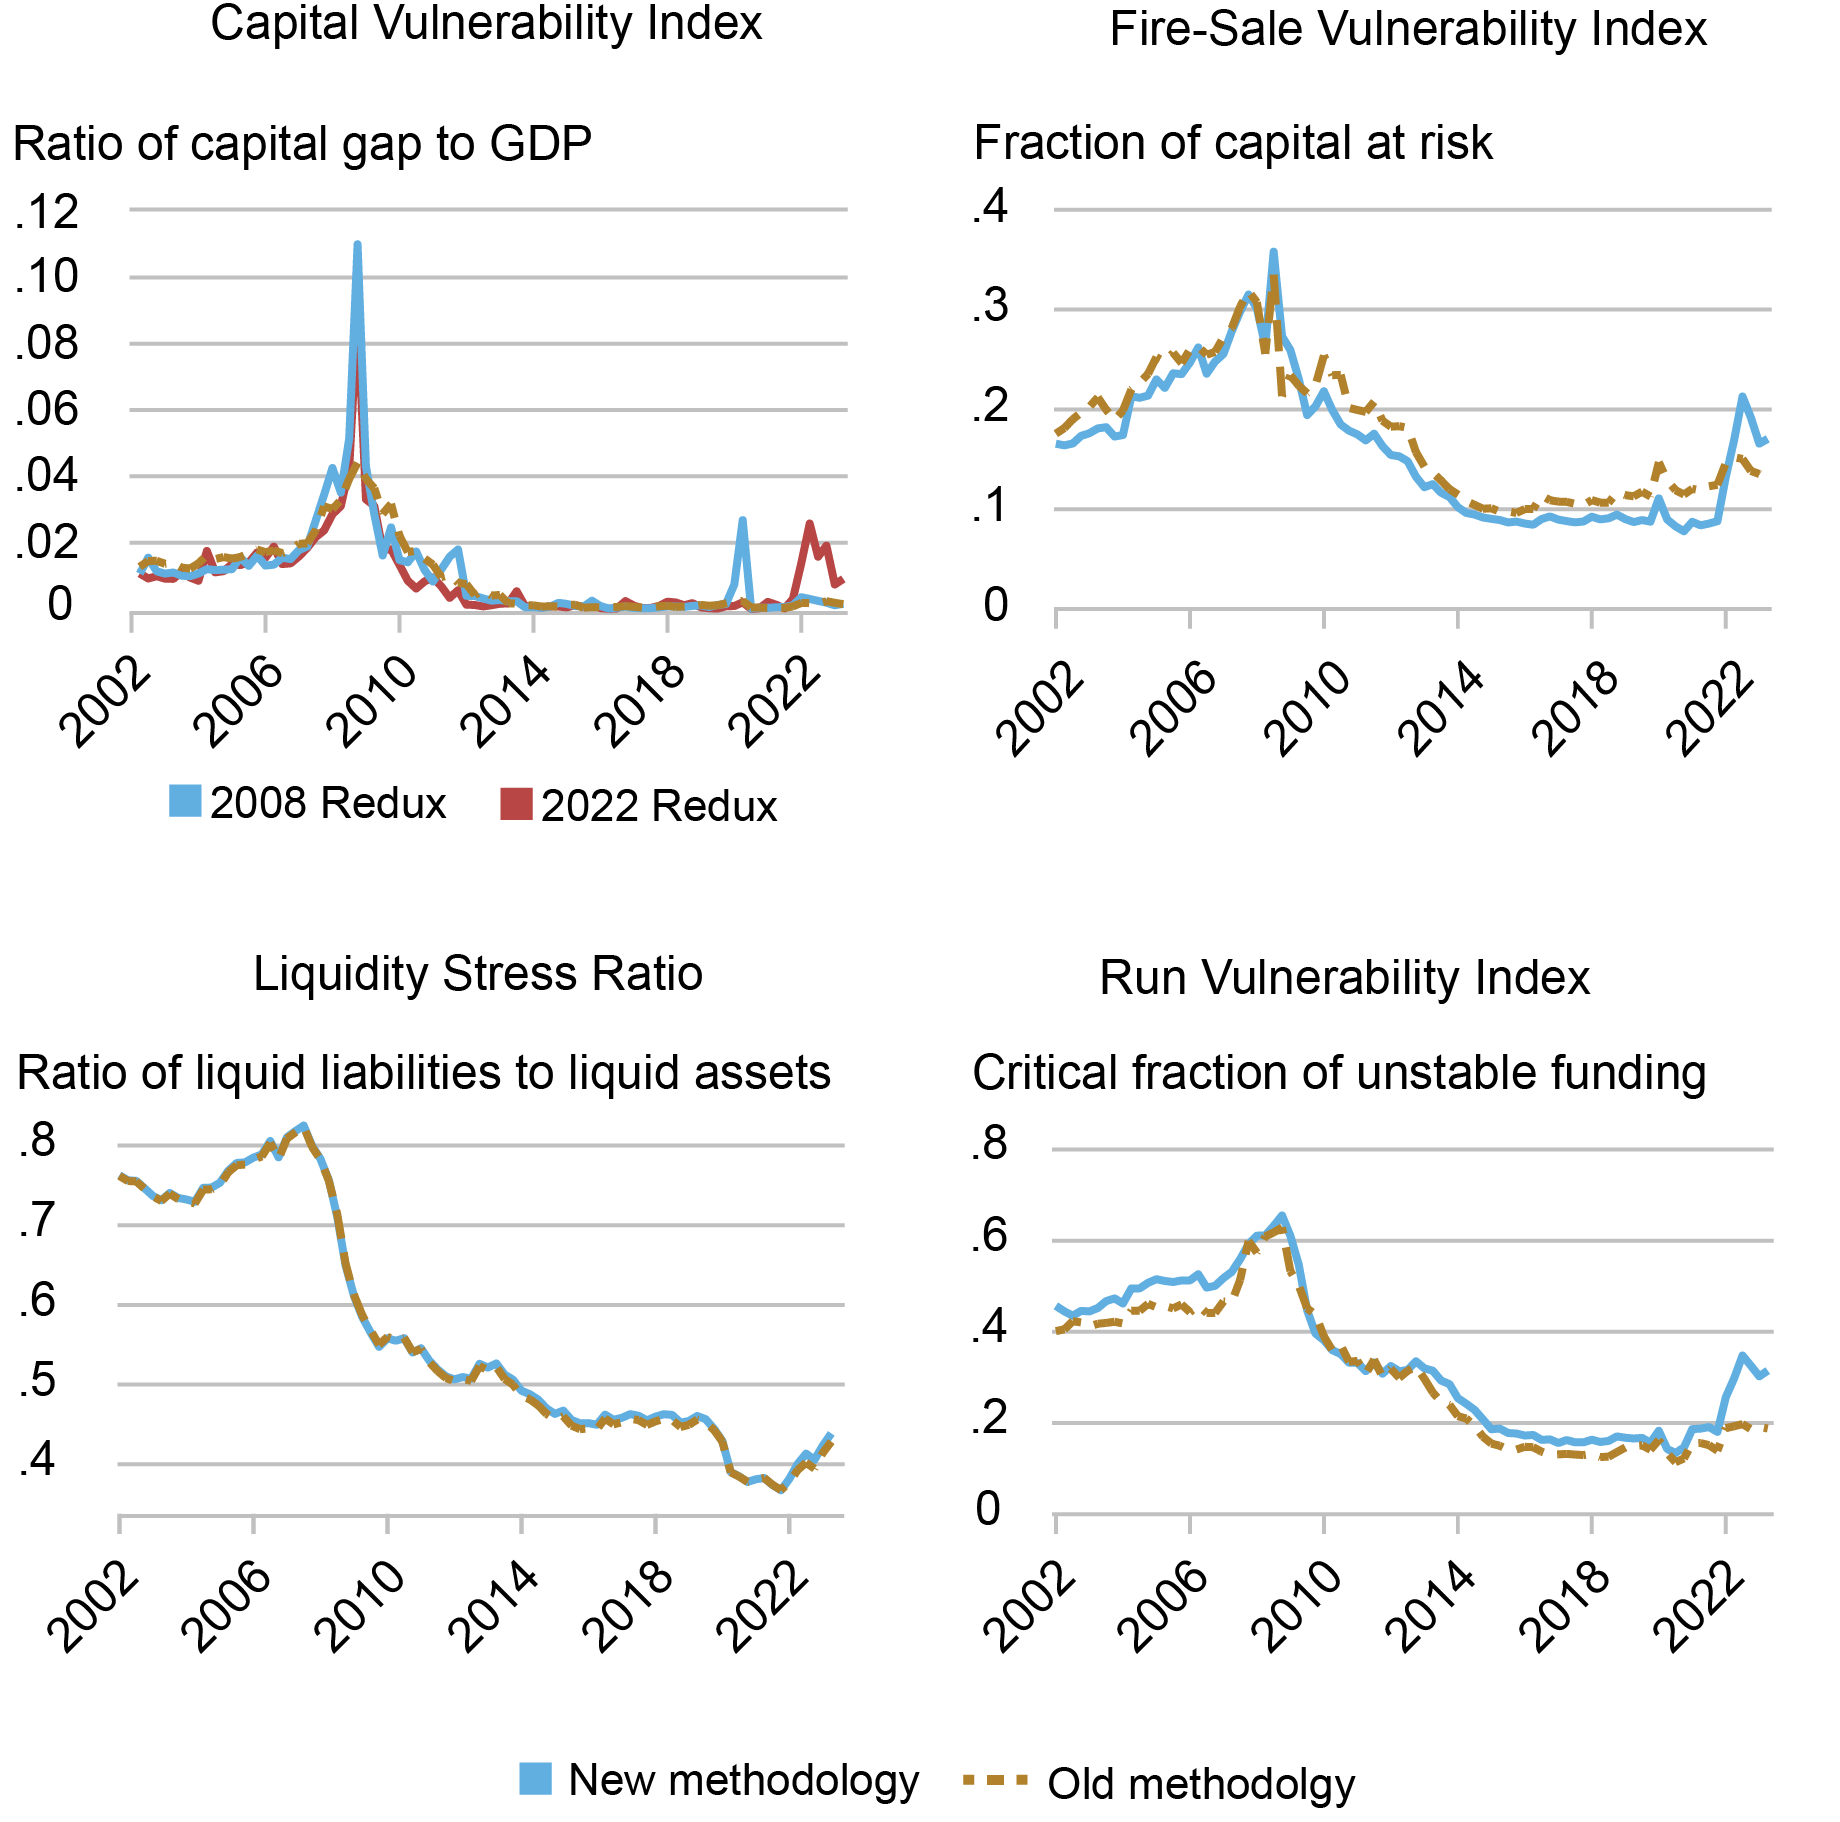
We consider the following measures intended to capture key dimensions of the vulnerability of the banking system, all based on analytical frameworks developed by New York Fed staff or adapted from academic research and using publicly available regulatory data on bank holding companies. The four measures were introduced in a 2018 Liberty Street Economics post and have been updated annually since then. The chart below shows the four measures and compares the new methodology (solid lines) to the old methodology (dashed lines).
Source: Authors’ calculations, based on FR Y-9C reports.
The most important change in methodology is that the measures now incorporate unrealized losses (or gains) on all securities. The goal of this change is to reflect more closely the economic value of bank assets in a stress scenario. However, this change implies that the measures deviate both from accounting standards, where held-to-maturity securities are valued at amortized cost, and from regulatory standards, where unrealized gains or losses on available-for-sale securities are not included in regulatory capital except for the very largest banks.
Capital Vulnerability Index
This index measures how well-capitalized the banks are projected to be after a severe macroeconomic shock. It is constructed using the CLASS model, a top-down stress-testing model developed by New York Fed staff. The index measures the capital gap—that is, the aggregate amount of capital needed under a macroeconomic scenario to bring each bank’s Tier 1 common equity capital to at least 10 percent of risk-weighted assets—and scales the cap by GDP.
In previous years, we calculated the Capital Vulnerability Index only under a macroeconomic scenario equivalent to the 2008 crisis (“2008 redux”). However, the bank failures in March 2023 showed that banks are also vulnerable to a rapid rise in interest rates that reduces the fair value of their securities holdings. We therefore also calculate the Capital Vulnerability Index under a scenario equivalent to the 2022 rise in interest rates, where unrealized gains and losses on securities are fully reflected in banks’ capital levels (“2022 redux”). In both scenarios, we made some adjustments to address the non-stationarity of important macroeconomic variables, such as interest rates.
The Capital Vulnerability Index based on the 2008 crisis is currently at historically low levels, around 1.55 percent of GDP (as shown in the upper-left panel of the chart above). Driven primarily by loan provisions, the spike at the onset of the 2020 COVID-19 pandemic subsided as unemployment—and, in turn, expected credit losses—returned to pre-pandemic levels toward the end of 2021. The Capital Vulnerability Index based on the 2022 scenario is currently still somewhat elevated by recent historical standards. Such vulnerability originates from banks’ exposure to a sudden drop in the value of securities following a hypothetical further increase in interest rates.
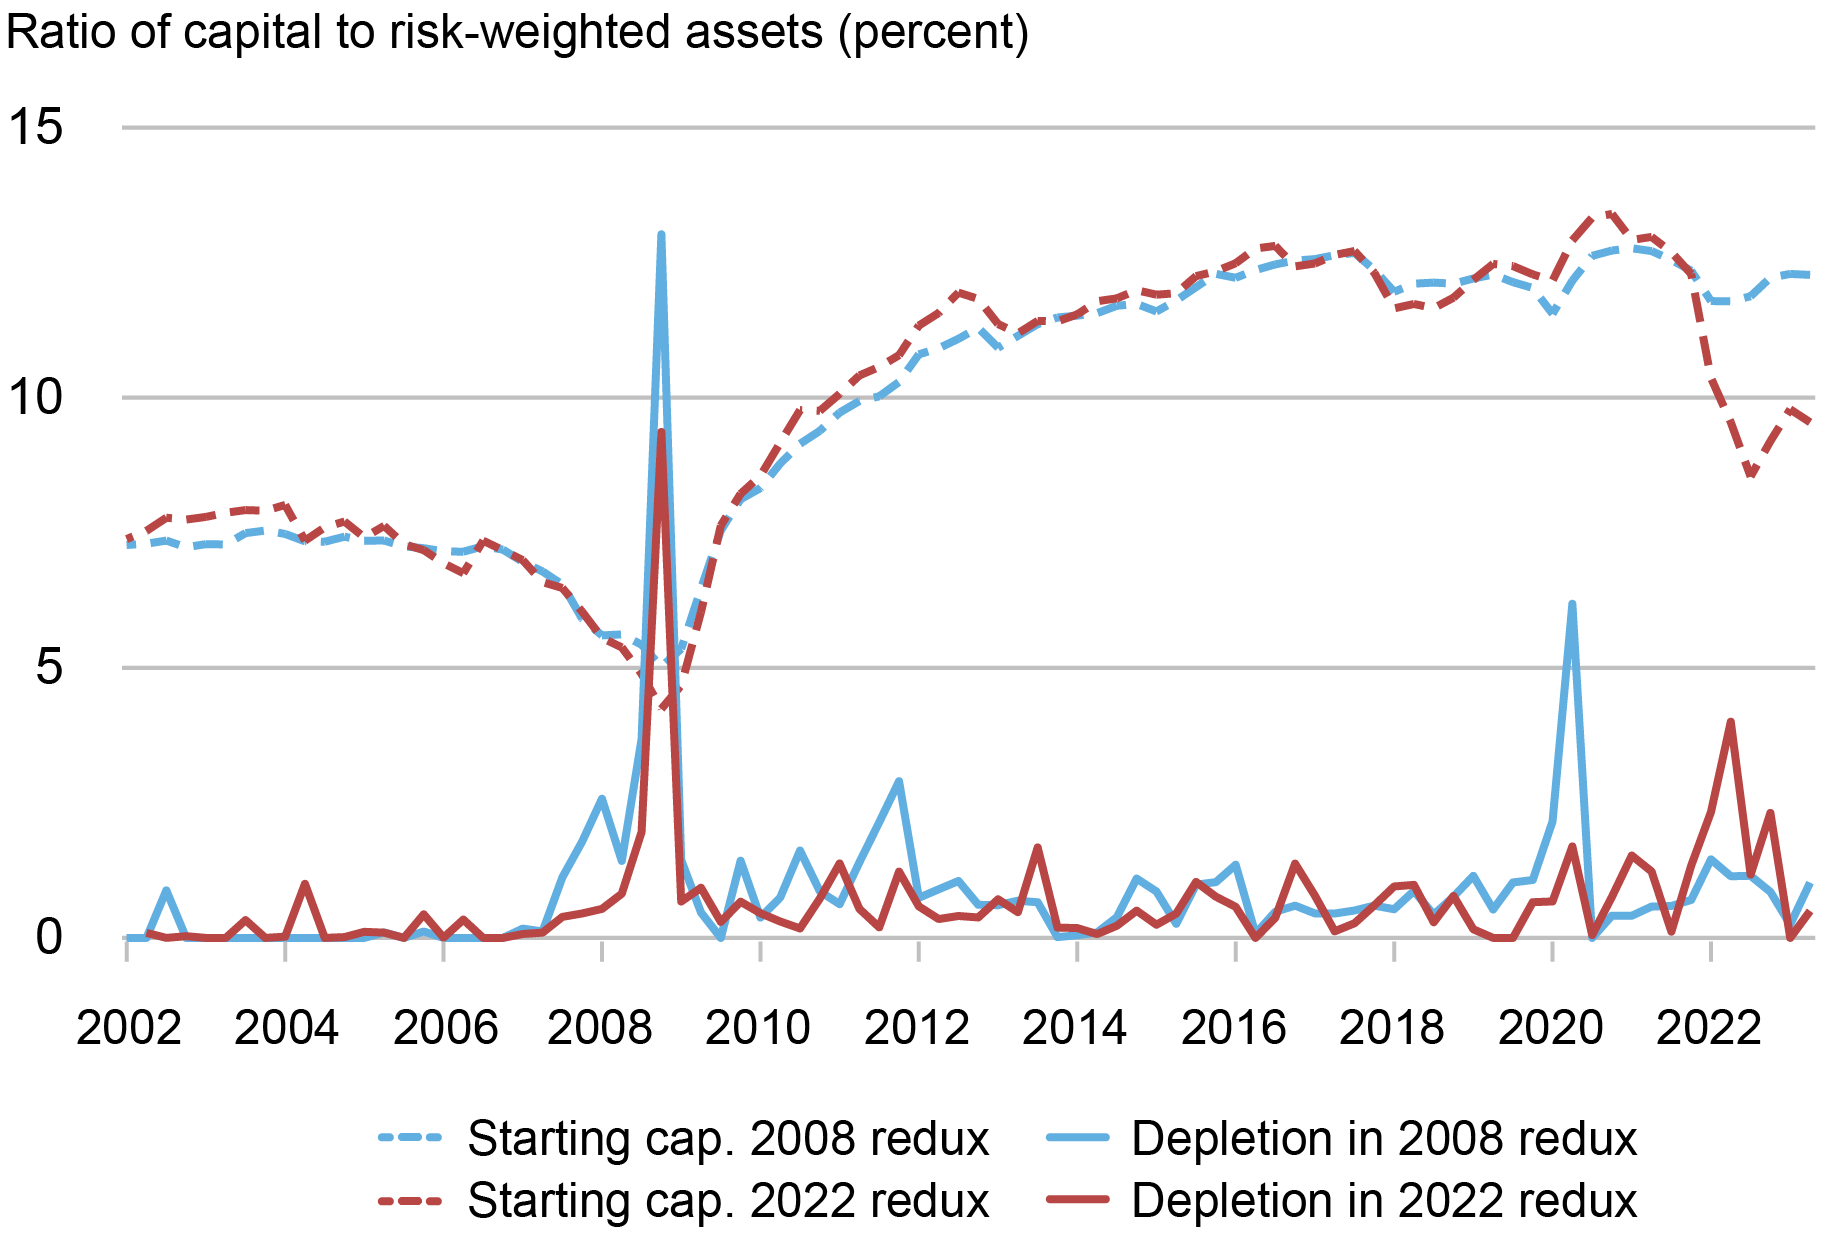
Even though funding is assumed to be stable in this model, the economic value of banks’ securities portfolios decreased with the rise in rates. The subsequent gradual increase in net interest margins, largely driven by the limited pass-through of higher rates into deposit rates, might eventually make up for the initial drop in securities’ values, but the potentially rapid losses might still expose banks to capital shortfalls. The chart below documents the decomposition of the Capital Vulnerability Index into its two main components at any given point in time, namely the starting level of capital and the capital depletion during the projection period. The chart confirms the sizable drop in capital levels once unrealized gains and losses are considered.
Decomposition of Capital Vulnerability Index
Source: Authors’ calculations, based on FR Y-9C reports.
Fire-Sale Vulnerability Index
This index captures the vulnerability of banks to a hypothetical system-wide asset fire sale, calculating the spillover losses as a fraction of banks’ Tier 1 capital. It is based on the Journal of Finance article “Fire-Sale Spillovers and Systemic Risk.” Based on the experience of March 2023, the methodology now incorporates all unrealized losses (or gains) by measuring securities classified as “held to maturity” (HTM) at their fair value instead of the usual accounting method of amortized cost. In addition, unrealized losses on all securities are included in equity. This change in measurement increases leverage and therefore fire-sale vulnerability in periods of notable unrealized losses—for example, due to rising interest rates. We also differentiate the liquidity of assets further using values from the Net Stable Funding Ratio of Basel III.
Comparing the fire-sale vulnerability index under the two methodologies shows that the most notable differences are in the period since 2016 (see the upper-right panel of the first chart of this post). Differentiating assets’ liquidity dampens the increasing trend in fire-sale vulnerability since 2016 because of a concurrent shift toward more liquid assets on large banks’ balance sheets. The more pronounced change is the spike in fire-sale vulnerability since early 2022, which is much larger because the new methodology accounts for unrealized losses on all securities. While fire-sale vulnerability has retraced some of the spike seen in 2023, it remains elevated compared to the low levels of the past ten years.
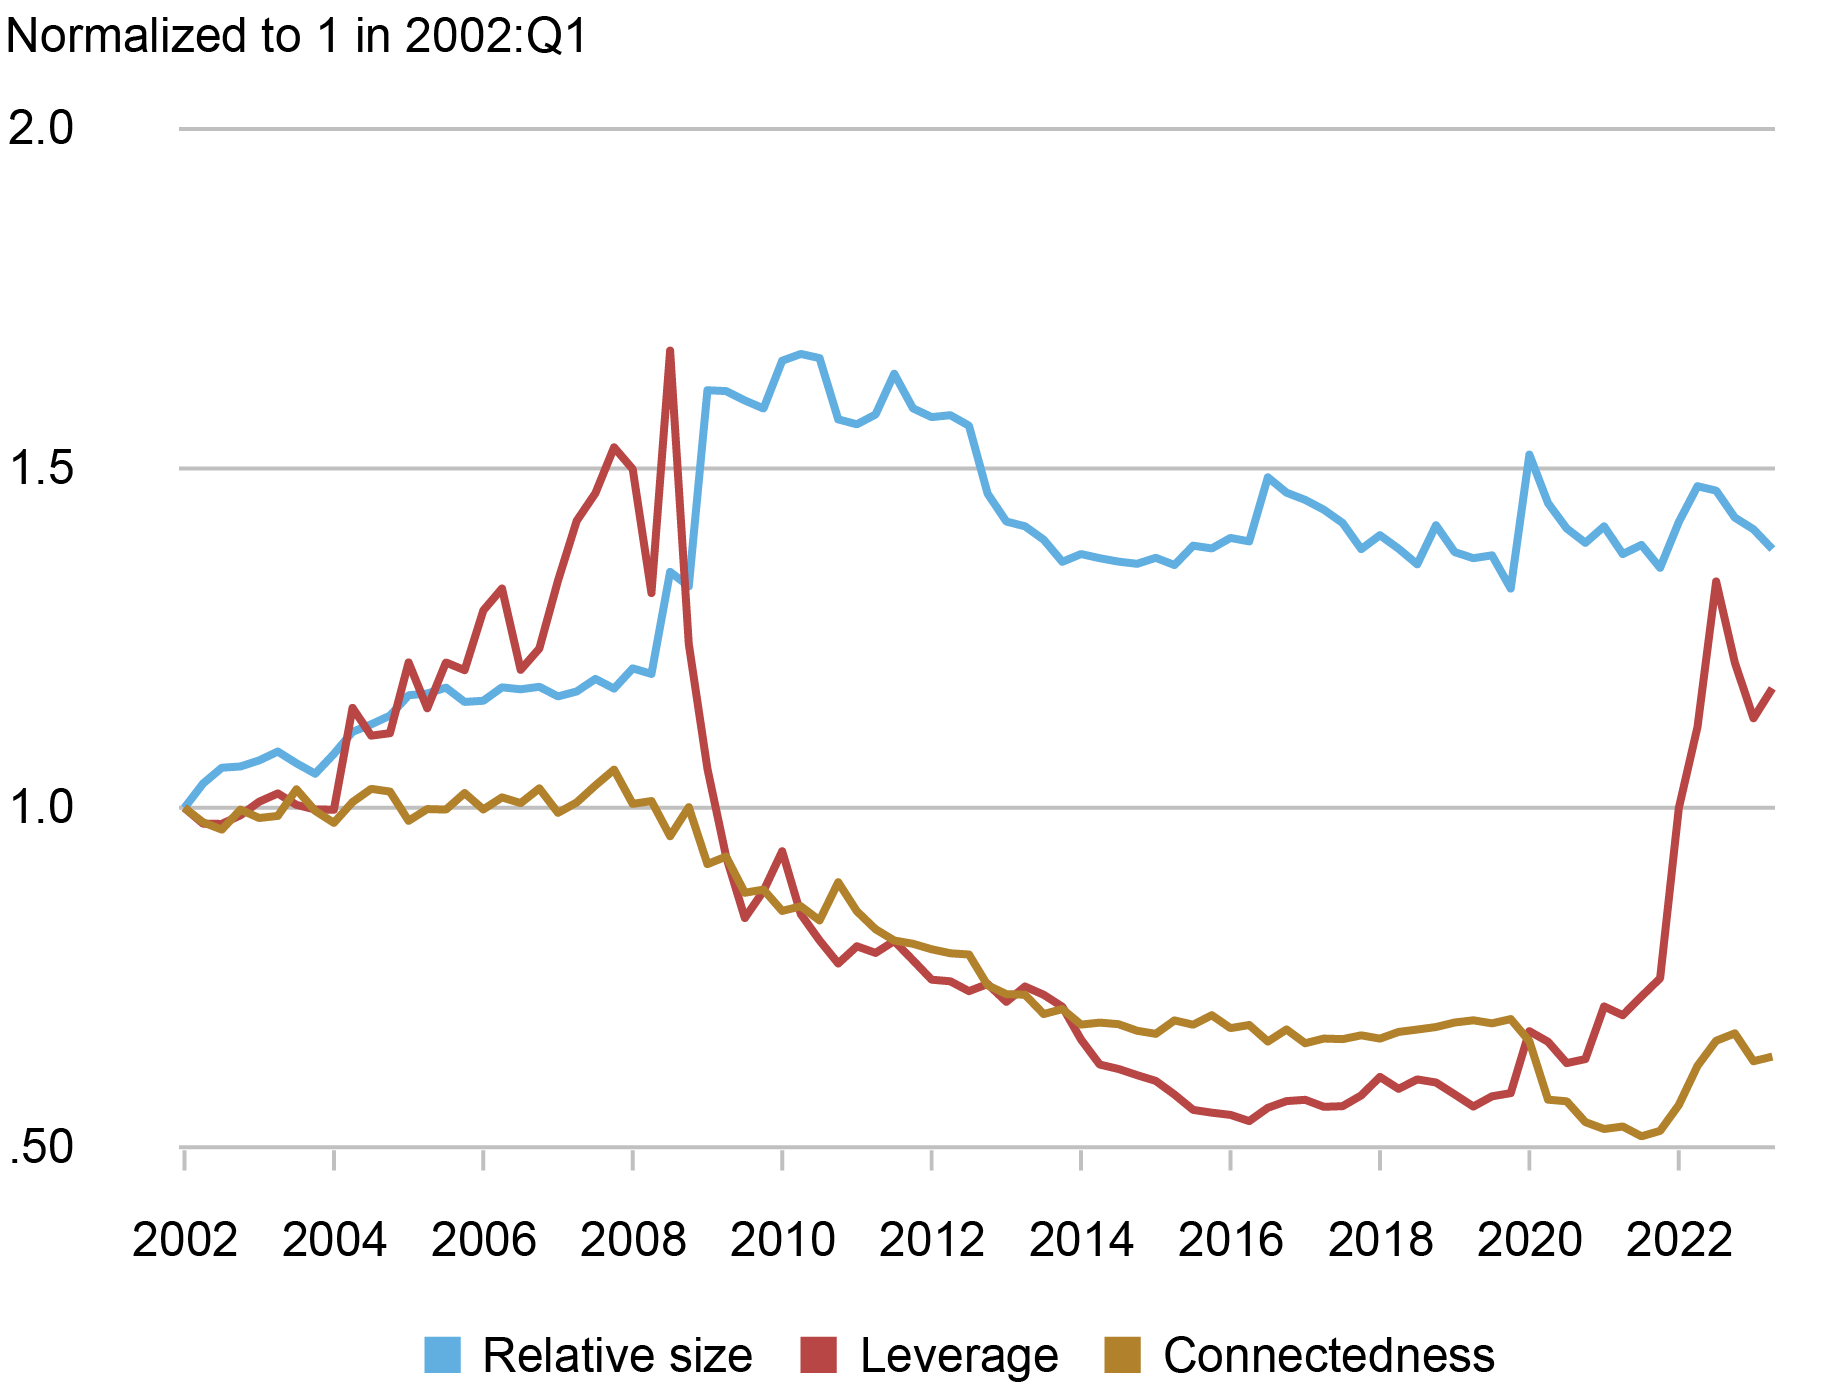
The chart below decomposes the index into the size of the banking system, its leverage, and its “connectedness.” While system size and connectedness have been contributing factors, the spike in the index since early 2022 is mostly due to an increase in leverage.
Decomposition of Fire-Sale Vulnerability Index
Source: Authors’ calculations, based on FR Y-9C reports.
Liquidity Stress Ratio
This ratio measures the potential liquidity shortfall of banks under conditions of liquidity stress, as captured by the mismatch between liability-side (and off-balance-sheet) liquidity outflows and asset-side liquidity inflows. For each individual bank, it is defined as the ratio of runnability-adjusted liabilities plus off-balance-sheet exposures (with each liability and off-balance-sheet exposure category weighted by its expected outflow rate) to liquidity-adjusted assets (with each asset category weighted by its expected market liquidity). The liquidity stress ratio grows when expected funding outflows increase or assets become less liquid. The aggregate ratio is computed as a size-weighted average of the individual banks’ liquidity stress ratio.
Following the events of March 2023, the liquidity stress ratio is now calculated by using the fair value rather than the amortized cost for HTM securities, to account for unrealized losses or gains on those assets. The aggregate ratios based on the new and the old methodologies exhibit some differences from 2016 onward, with the former being somewhat higher at times of rising interest rates, especially during 2022 (see the bottom-left panel in the first chart of this post).
After a dip in 2020 and a flat path in 2021, the liquidity stress ratio rebounded in 2022 and early 2023 to almost reach its pre-pandemic level. Looking at the underlying components of the ratio in the chart below, we see that the marked increase in the ratio since early 2022 is driven by a shift from liquid to less-liquid assets and from stable to unstable funding.
Decomposition of Liquidity Stress Ratio
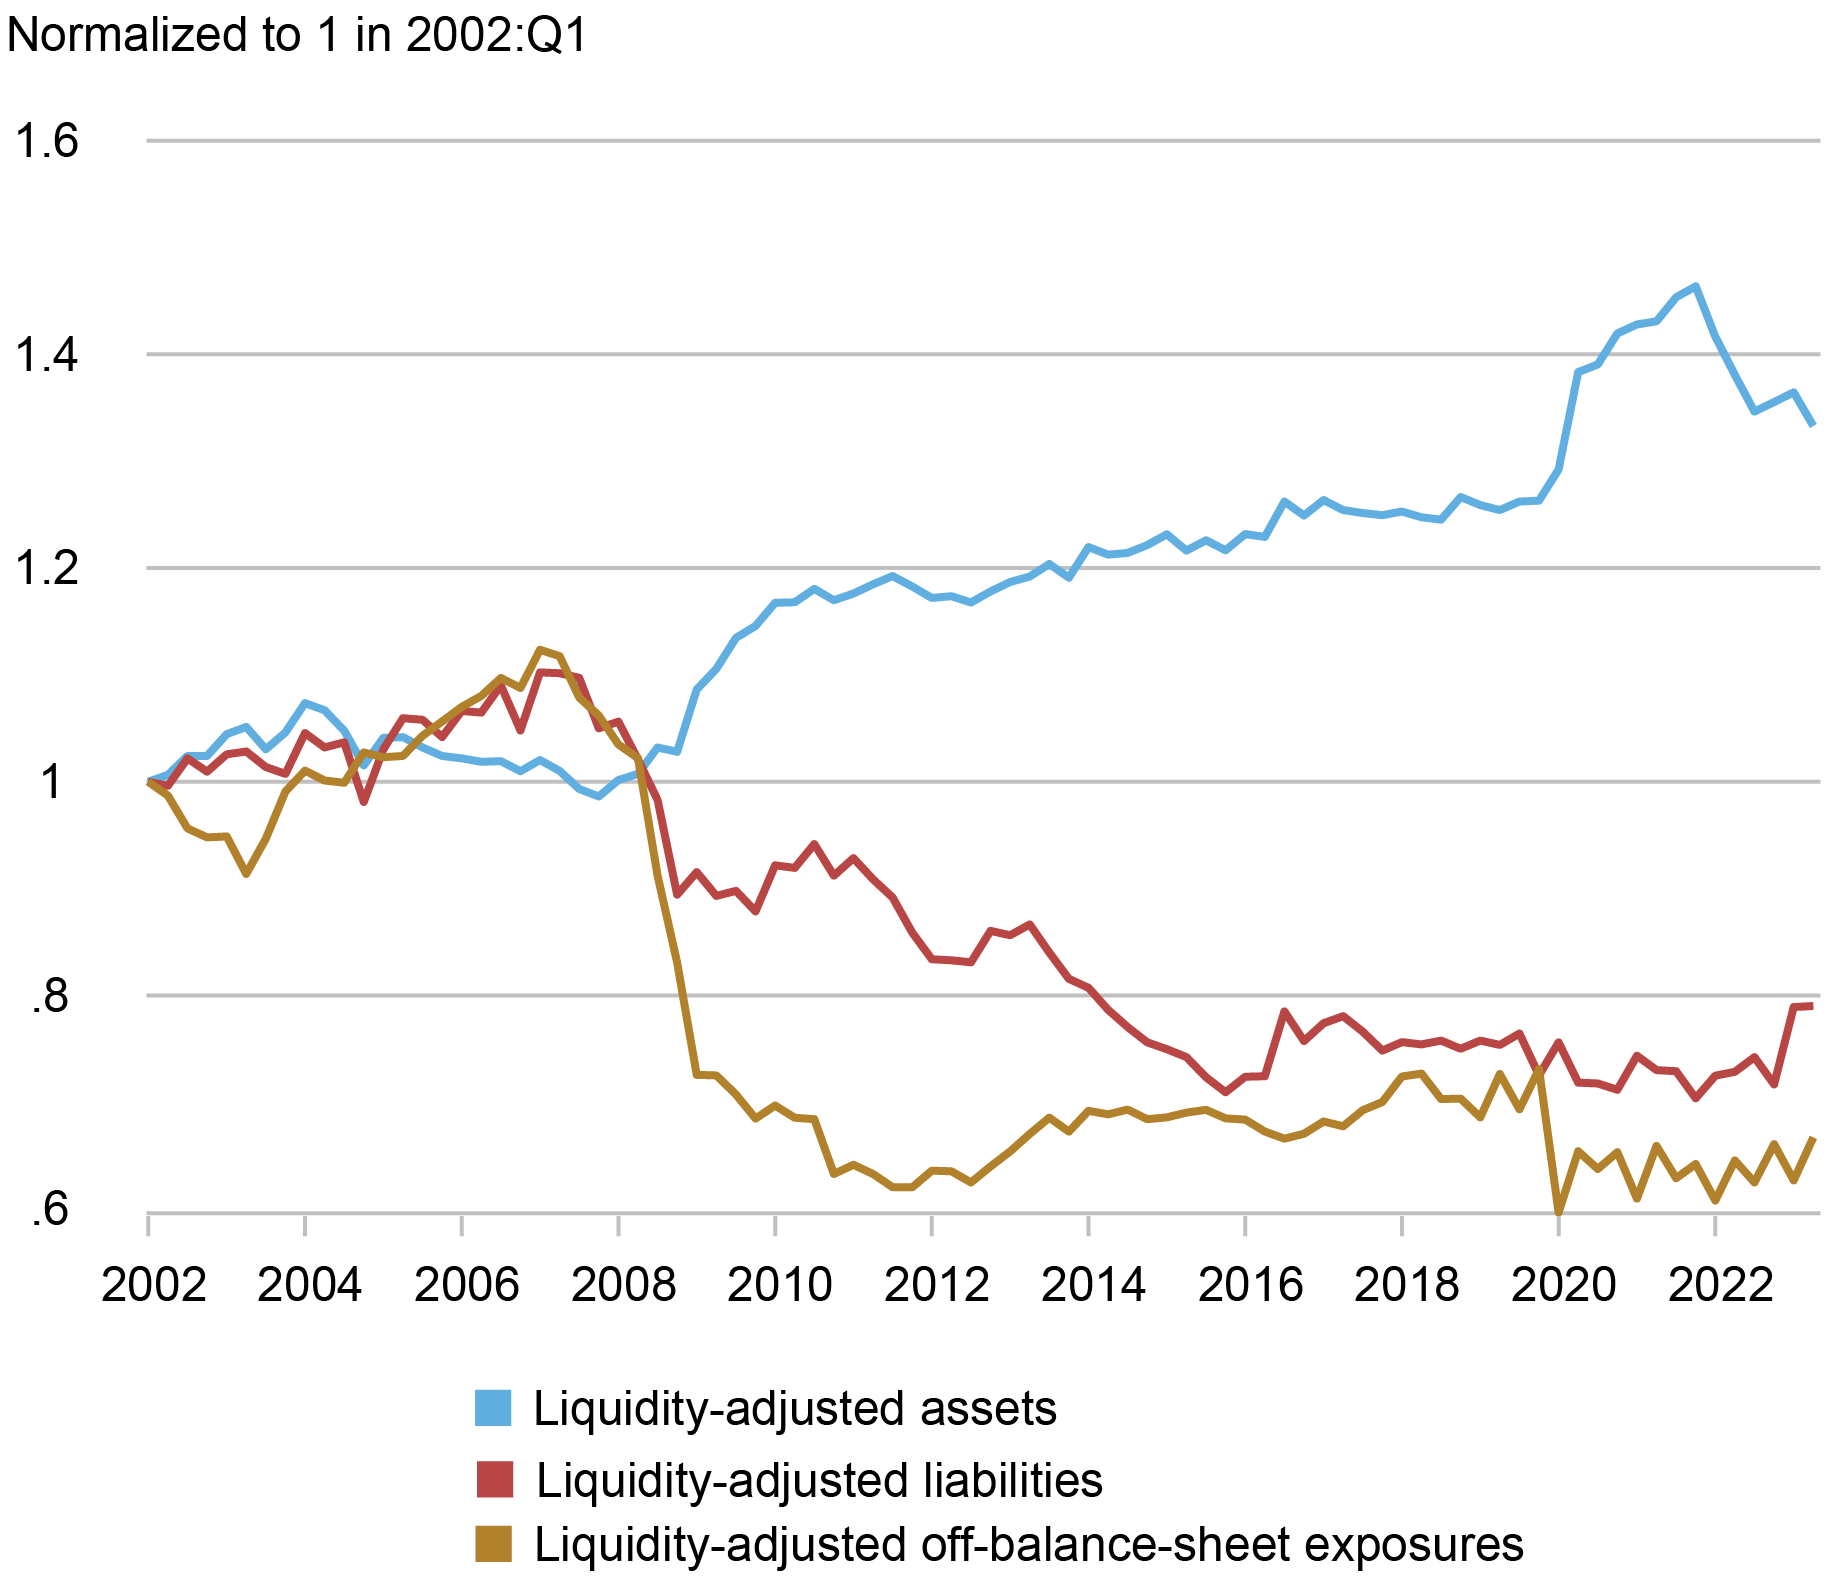
Source: Authors’ calculations, based on FR Y-9C reports.
Run Vulnerability Index
This measure gauges a bank’s vulnerability to runs, measured as the critical fraction of unstable funding the bank needs to retain in a stress scenario to prevent insolvency. Run vulnerability combines liquidity and solvency because a bank can fail due to a sufficiently large shock to assets, a sufficiently large loss of funding, or both. The aggregate index is computed as a size-weighted average of the individual banks’ run vulnerability. The methodology now also uses fair value for all securities, which increases leverage in the period since early 2022, and it assumes a 1 percent shock to all assets as the stress scenario.
Comparing the run vulnerability index under the two methodologies shows that the most notable difference is in the period since 2022, where the index is considerably higher due to the unrealized losses on securities increasing leverage (see the lower-right panel of the first chart of this post).
Considering the underlying components of run vulnerability in the chart below, we see that the increase in the index since early 2022 is mainly due to an increase in leverage, but that the other components— unstable funding and illiquid assets—have also increased over this period.
Decomposition of Run Vulnerability Index
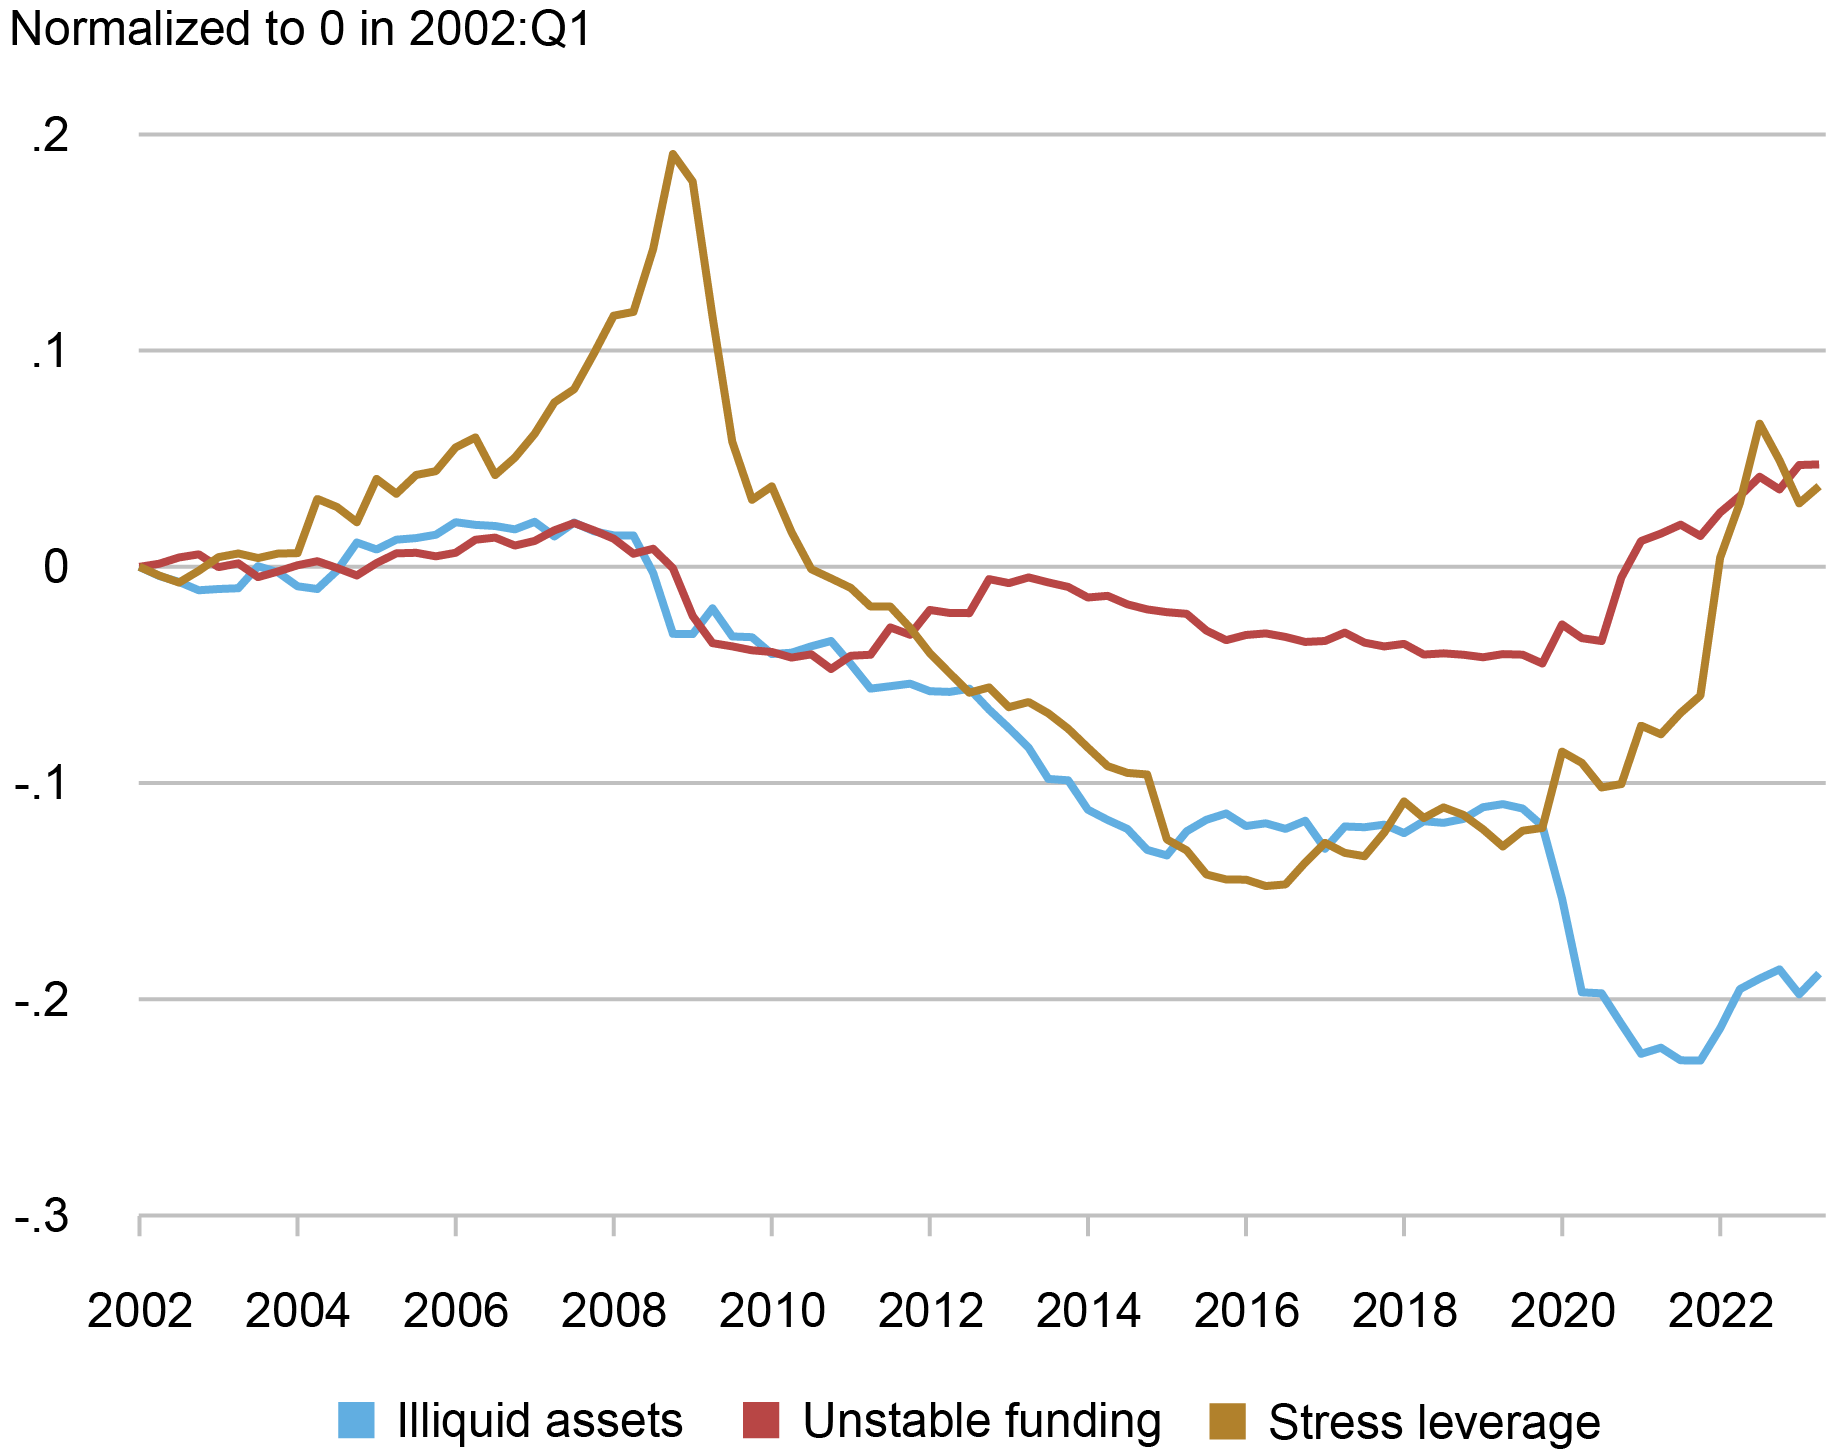
Source: Authors’ calculations, based on FR Y-9C reports.
Final Words
The March 2023 banking crisis highlighted the vulnerability of the banking sector to a sudden rise in interest rates. Specifically, banks’ ability to limit the pass-through of rate-hiking cycles into deposit rates allows them to benefit from higher rates, but only gradually. Yet, in the short-term, banks might suffer losses in their securities portfolio that might, in turn, induce funding dry-ups and substantially weakened effective capital levels. Our measures, adapted to this recent shock, suggest a moderate increase in systemic vulnerability compared to the low levels of the previous ten years. However, systemic vulnerability still remains below the high levels preceding the 2008 crisis, especially because the largest banks tend to be less exposed to capital shortfalls, fire sales, liquidity mismatches, and run risk compared to smaller institutions.

Matteo Crosignani is a financial research advisor in Non-Bank Financial Institution Studies in the Federal Reserve Bank of New York’s Research and Statistics Group.

Thomas M. Eisenbach is a financial research advisor in Money and Payments Studies in the Federal Reserve Bank of New York’s Research and Statistics Group.

Fulvia Fringuellotti is a financial research economist in Non-Bank Financial Institution Studies in the Federal Reserve Bank of New York’s Research and Statistics Group.
How to cite this post:
Matteo Crosignani, Thomas Eisenbach, and Fulvia Fringuellotti, “Banking System Vulnerability: 2023 Update,” Federal Reserve Bank of New York Liberty Street Economics, November 6, 2023, https://libertystreeteconomics.newyorkfed.org/2023/11/banking-system-vulnerability-2023-update/
BibTeX: View |


Disclaimer
The views expressed in this post are those of the author(s) and do not necessarily reflect the position of the Federal Reserve Bank of New York or the Federal Reserve System. Any errors or omissions are the responsibility of the author(s).
 RSS Feed
 Follow Liberty Street Economics
David:
We agree that loans are also subject to interest rate risk, especially ones at fixed interest rates and with long maturities. While the effect of interest rates is easy to measure for securities since they have an observable market price, measurement is more involved for loans and beyond the scope of our high-level analysis.
– Matteo Crosignani, Thomas Eisenbach, and Fulvia Fringuellotti
As always, thank you to the Liberty St folks for the analysis. I think a more accurate analysis would take into account the residential mortgages and commercial real estate loans on bank balance sheets that are underwater due to interest rates not credit issues. First Republic was undone because of its residential mortgage book not because of securities. Thank you