


To assess the vulnerability of the U.S. financial system, it is important to monitor leverage and funding risks—both individually and in tandem. In this post, we provide an update of four analytical models aimed at capturing different aspects of banking system vulnerability with data through 2022:Q2, assessing how these vulnerabilities have changed since last year. The four models were introduced in a Liberty Street Economics post in 2018 and have been updated annually since then.
How Do We Measure Banking System Vulnerability?
Using publicly available regulatory data on bank holding companies, we consider the following measures, all based on analytical frameworks developed by New York Fed staff or adapted from academic research, to capture key dimensions of the vulnerability of the banking system:
- Capital vulnerability: This index measures how well-capitalized the banks are projected to be after a severe macroeconomic shock. The measure is constructed using the CLASS model, a top-down stress-testing model developed by New York Fed staff. Using the CLASS model, we project banks’ regulatory capital ratios under a macroeconomic scenario equivalent to the 2008 financial crisis. The index measures the capital gap—that is, the aggregate amount of capital (in dollars) needed under that scenario to bring each bank’s capital ratio to at least 10 percent.
- Fire-sale vulnerability: This index measures the magnitude of systemic spillover losses among banks caused by asset fire sales under a hypothetical stress scenario. The measure calculates the fraction of system capital that would be lost because of fire-sale spillovers. It is based on the Journal of Finance article “Fire-Sale Spillovers and Systemic Risk,” which shows that an individual bank’s contribution to the index predicts its contribution to systemic risk five years in advance.
- Liquidity stress ratio: This ratio measures the potential liquidity shortfall of banks under conditions of liquidity stress, as captured by the mismatch between liability-side (and off-balance sheet) liquidity outflows and asset-side liquidity inflows. It is defined as the ratio of runnability-adjusted liabilities plus off-balance sheet exposures (with each liability and off-balance sheet exposure category weighted by its expected outflow rate) to liquidity-adjusted assets (with each asset category weighted by its expected market liquidity). The liquidity stress ratio grows when expected funding outflows increase or assets become less liquid.
- Run vulnerability: This measure gauges a bank’s vulnerability to runs, taking into account both liquidity and solvency. The framework considers a shock to assets and a concurrent loss of funding that forces costly asset liquidations. A bank can then become insolvent due to a sufficiently bad asset shock, a sufficiently large loss of funding, or both. An individual bank’s run vulnerability measures the critical fraction of unstable funding that the bank needs to retain in the stress scenario to prevent insolvency.
How Have the Vulnerability Measures Evolved Over Time?
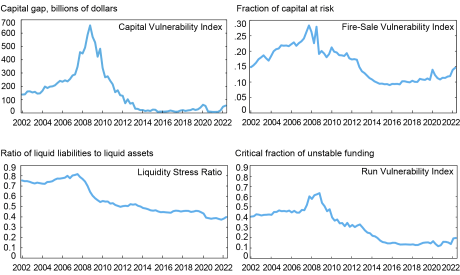
The chart below shows how the different aspects of vulnerability have evolved since 2002, according to the four measures calculated for the fifty largest U.S. bank holding companies (BHCs).
What Factors Have Driven Bank Vulnerability in the Past Year?
We start by considering broad trends on banks’ balance sheets that affect the four vulnerability measures. The chart below shows the recent development of the aggregate bank balance sheet of the fifty largest BHCs.
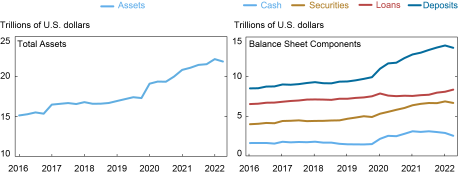
The COVID pandemic brought a large expansion of bank balance sheets in 2020 through increases in cash and securities, funded with deposits. Since the last update of our measures (covering data through 2021:Q2), balance sheet growth slowed until 2022:Q1 and turned negative in 2022:Q2.
Among balance sheet components, loans have been growing since 2021:Q2, while securities have been flat and cash has been decreasing, in line with the decline in aggregate reserves. Overall, these changes have moderately reduced the liquidity composition of bank assets.
On the liability side, total deposits have mostly mirrored the changes in total assets, increasing compared to 2021:Q2 with a moderate shift from more stable to less stable deposit categories. Combined with elevated capital distributions, capital ratios have declined back to pre-COVID levels.
How Have the Different Vulnerability Measures Evolved?
All four vulnerability indexes are higher in 2022:Q2 than they were in 2021:Q2 (first chart):
- Capital Vulnerability Index: The Capital Vulnerability Index, registering a stress-scenario capital gap of $54.7 billion as of 2022:Q2, has resumed its pre-COVID uptrend since 2021:Q3, after hovering around a full-sample low of $8 billion from mid-2020 to mid-2021. This dynamic largely reflects the evolution of bank capital. The low vulnerability in the midst of the pandemic was mostly due to dividend restrictions and a drop in loan loss provisions. The subsequent increase of the index reflects a lower return on trading assets, higher noninterest expenses, and higher distributions following the relaxation of dividend restrictions.
- Fire-Sale Vulnerability Index: The fire-sale vulnerability index briefly spiked at the onset of the pandemic in 2020:Q1 before reverting through the end of 2020. Since then, fire-sale vulnerability has increased, surpassing its spike in 2020:Q1. All three underlying components have increased: banks’ size (relative to the rest of the financial sector), aggregate leverage (lower unweighted capital ratios), and connectedness (concentration across banks of illiquid assets, leverage, and size). Overall, the fire-sale vulnerability index in 2022:Q2 is above its pre-COVID level, at a level last seen in 2012, but remains below its historical highs.
- Liquidity Stress Ratio: The Liquidity Stress Ratio fell significantly over the course of 2020, largely reflecting an increase in banks’ holdings of cash and cash equivalents (mostly reserves) driven by the Federal Reserve’s asset purchase programs. The ratio’s decline has been only partially moderated by the simultaneous increase in deposits. The Liquidity Stress Ratio remained flat in 2021 and began to rise in 2022. The increase of the ratio in the first half of 2022 was driven by a shift from cash and cash equivalents toward less liquid assets, an increase in unused commitments, and a shift from stable to unstable deposit funding. Despite the recent upward trend, the Liquidity Stress Ratio remains at historically low levels, with a value in 2022:Q2 that is 10 percent below its pre-COVID level.
- Run Vulnerability Index: The run vulnerability index briefly declined in 2020 with the shift to more liquid assets at the beginning of the COVID pandemic, before reverting in 2021 and increasing since then. Among the underlying components, assets have become less liquid compared to 2021:Q2, funding has become more unstable, and predicted stress leverage has increased—all contributing to the increase in run vulnerability. Overall, the run vulnerability index has increased above its pre-COVID level but is still considerably below its historical highs.
Summing Up and Looking Ahead
Overall, the banking system shows historically low vulnerability according to our four measures, reflecting historically high capital ratios and liquid assets related to post-crisis capital and liquidity regulations and to Federal Reserve balance sheet policy. After the disruptions stemming from the COVID pandemic, the four vulnerability measures are now on an uptrend, with the capital, fire-sale, and run vulnerability indexes all above the low points reached in the mid-2010s.
Looking ahead, we expect the vulnerability measures to be driven by two main factors. First, a continued reduction in the Federal Reserve’s balance sheet will likely lead to a decline in banks’ cash holdings, thus prompting a further shift toward less-liquid assets. This adjustment would extend the upswings in the fire-sale vulnerability index, the liquidity stress ratio, and the run vulnerability index. Second, should bank capital ratios continue to decline, we would expect further increases in the capital vulnerability index, the fire-sale vulnerability index, and the run vulnerability index.

Matteo Crosignani is a financial research economist in Non-Bank Financial Institution Studies in the Federal Reserve Bank of New York’s Research and Statistics Group.

Thomas M. Eisenbach is a financial research advisor in Money and Payments Studies in the Federal Reserve Bank of New York’s Research and Statistics Group.

Fulvia Fringuellotti is a financial research economist in Non-Bank Financial Institution Studies in the Federal Reserve Bank of New York’s Research and Statistics Group.
How to cite this post:
Matteo Crosignani, Thomas Eisenbach, and Fulvia Fringuellotti, “Banking System Vulnerability: 2022 Update,” Federal Reserve Bank of New York Liberty Street Economics, November 14, 2022, https://libertystreeteconomics.newyorkfed.org/2022/11/banking-system-vulnerability-2022-update/
BibTeX: View |
Disclaimer
The views expressed in this post are those of the author(s) and do not necessarily reflect the position of the Federal Reserve Bank of New York or the Federal Reserve System. Any errors or omissions are the responsibility of the author(s).
 RSS Feed
 Follow Liberty Street Economics