


The market for U.S. Treasury securities experienced extreme stress in March 2020, when prices dropped precipitously (yields spiked) over a period of about two weeks. This was highly unusual, as Treasury prices typically increase during times of stress. Using a theoretical model, we show that markets for safe assets can be fragile due to strategic interactions among investors who hold Treasury securities for their liquidity characteristics. Worried about having to sell at potentially worse prices in the future, such investors may sell preemptively, leading to self-fulfilling “market runs” that are similar to traditional bank runs in some respects.
Price Crash with Constrained Dealer Balance Sheets and Unprecedented Sales
The unusual events in Treasury markets in March 2020 have been discussed extensively in previous posts. We want to draw attention to a confluence of two elements: First, the dealer banks that provide Treasury market liquidity faced mounting challenges to their intermediation capacity. The chart below shows that dealer balance sheet space allocated to Treasury securities increased both during the run-up in Treasury prices and their subsequent crash. The recovery in Treasury prices after March 18 coincided with dealer balance sheet pressure receding as the Federal Reserve’s Treasury purchases ramped up.
Dealers Were Constrained through the Run-up and Crash of Treasury Prices
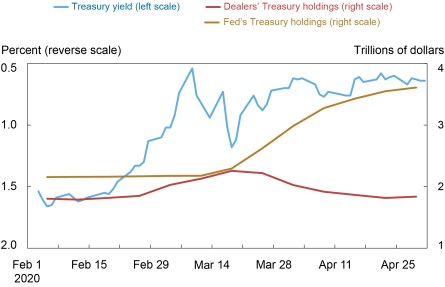
Notes: The chart shows the market yield on U.S. Treasury securities at 10-year constant maturity (reverse scale), Federal Reserve outright holdings of Treasury notes and bonds (nominal and TIPS), and Primary Dealers’ net position and reverse repo in Treasury securities (nominal and TIPS).
Second, the behavior of foreign investors and mutual funds, the main sellers of Treasury securities in March 2020, was very unusual. The next chart shows the net purchases of the two groups over time and highlights that their sales in the first quarter of 2020 were unprecedented—much larger than ever before.
Unprecedented Sales that Appear Precautionary
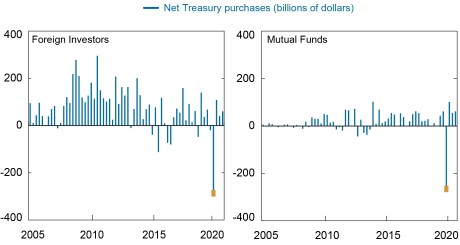
Note: The chart shows net purchases of Treasury securities (all types) for the two sectors with the largest sales in 2020:Q1. “Foreign investors” refers to the “rest of the world” sector in the original table.
Vissing-Jorgensen (2021) shows evidence that both groups’ sales of Treasury securities exceeded their actual liquidity needs. The unprecedented magnitude of the sales, and the fact that a considerable fraction of them were precautionary, makes this behavior appear very similar to a run—reminiscent of depositors rushing to withdraw funds from a bank. Consistent with this evidence, the Inter-Agency Working Group for Treasury Market Surveillance (2021) reports that “some Treasury holders appeared to react to the decline in market liquidity by selling securities for precautionary reasons lest conditions worsen further, and these sales only added to the stress on the market.”
Strategic Interaction among Treasury Investors Can Lead to Fragility
In a recent Staff Report, we study theoretically how strategic interaction among investors can make markets fragile and lead to “market runs.” We explicitly consider the possibility that different investors value safe assets such as Treasury securities for different reasons. First and foremost, safe assets are safe, meaning they are expected to pay their full par value at maturity with near total certainty. As a result, we typically observe “flight to safety” during times of stress, in which demand for safe assets increases, pushing up their price. Second, safe assets are liquid, and so some investors hold safe assets to sell them when faced with sudden liquidity needs. During times of stress, investors’ liquidity needs can increase, competing with the usual “flight to safety” and exerting downward pressure on the price of safe assets when they make a “dash for cash.”
Our model, which builds on Bernardo and Welch (2004), shows that a safe asset market is stable and well-functioning as long as the market is sufficiently deep. In this case, flight to safety and dash for cash are complementary phenomena, with investors who buy the assets for safety absorbing sales from investors who sell the assets for liquidity. However, in our model, the market can break down if trade involves dealers that are subject to balance sheet constraints. The risk of market break-down can be self-fulfilling, as it leads investors without pressing liquidity needs to sell preemptively in order to avoid the possibility of having to sell at lower prices in the future.
Individual investors may prefer selling preemptively today if they expect conditions to deteriorate sufficiently tomorrow. Aggregate sales today have a direct effect on the price today, but they also have an indirect effect on the price tomorrow, through their effects on dealer balance sheets. If this balance sheet effect is sufficiently strong, an individual investor’s incentive to sell preemptively can be higher if many other investors also sell preemptively. When others are selling today, an investor would rather sell today than wait and risk having to sell tomorrow, by which time dealers may be over-loaded with inventory, resulting in much lower prices.
Flight to Safety Can Trigger a Dash for Cash
Surprisingly, we show that flight to safety episodes can exacerbate the dash for cash when markets are fragile. Demand by flight-to-safety investors early on in a stress episode increases prices both contemporaneously and, by relaxing dealer balance sheets, in the future. If the strategic concerns of liquidity investors are sufficiently strong, then additional demand from safety-first investors today can induce liquidity investors to sell today, precisely because the market today has a relatively higher capacity to absorb sales. Then, a flight to safety actually triggers a dash for cash, amplifying existing market fragility.
How Was March 2020 Different from September 2008?
The events of March 2020 make a striking contrast to the nadir of the great financial crisis in September 2008, when Treasury markets did not suffer from dysfunction and illiquidity. Our model helps to understand the differences between these two episodes. First, our model highlights the central role of dealer balance sheet constraints that may in part be a result of post-crisis regulations. Second, the liquidity needs during the COVID-19 crisis appear to have been much larger—for example, because of the disruptions from lockdowns globally. Our model therefore suggests that in March 2020, the combination of unprecedented liquidity needs and considerably more constrained dealers tilted the Treasury market into a fragile region where investors sell strategically, and flight to safety precipitates a dash for cash.
Lessons for the Future
Fragility in our model hinges on the intertemporal considerations of strategic liquidity investors who compare prices today to prices tomorrow. In general, there is scope for policy interventions that increase prices both in the present and in the future. However, the timing of policy interventions is important, and announcements can have large effects well before the interventions are executed. We show that an asset purchase facility can have a large effect upon announcement by shifting strategic investors from the “run” equilibrium to the “hold” equilibrium, even if the facility does not become active until a future date. Similarly, policy interventions that relax dealer balance sheet constraints can be stabilizing so long as they relax balance sheet constraints in the future as well.
Finally, our model shows that markets where trading occurs in a decentralized, sequential way and where dealers play a large role in intermediating flows are inherently fragile. Changes to market structure whereby trades are pooled to reduce the role of dealers can therefore reduce the fragility of safe asset markets. Duffie (2020) argues that the growth of the Treasury market since 2008 has greatly outpaced the capacity of dealer balance sheets to absorb the additional supply and that this trend is expected to continue. The strategic mechanism in our model is therefore likely to become increasingly relevant, suggesting that—absent policy interventions—episodes such as March 2020 may become more frequent.

Thomas M. Eisenbach is a financial research advisor in Money and Payments Studies in the Federal Reserve Bank of New York’s Research and Statistics Group.
Gregory Phelan is an associate professor of economics at Williams College, currently working as a senior researcher in the U.S. Treasury’s Office of Financial Research.
How to cite this post:
Thomas Eisenbach and Gregory Phelan, “How Can Safe Asset Markets Be Fragile?,” Federal Reserve Bank of New York Liberty Street Economics, September 8, 2022, https://libertystreeteconomics.newyorkfed.org/2022/09/how-can-safe-asset-markets-be-fragile/
BibTeX: View |
Disclaimer
The views expressed in this post are those of the author(s) and do not necessarily reflect the position of the Federal Reserve Bank of New York or the Federal Reserve System. Any errors or omissions are the responsibility of the author(s).
 RSS Feed
 Follow Liberty Street Economics