


Corporate bonds are a key source of funding for U.S. non-financial corporations and a key investment security for insurance companies, pension funds, and mutual funds. Distress in the corporate bond market can thus both impair access to credit for corporate borrowers and reduce investment opportunities for key financial sub-sectors. In a February 2021 Liberty Street Economics post, we introduced a unified measure of corporate bond market distress, the Corporate Bond Market Distress Index (CMDI), then followed up in early June 2022 with a look at how corporate bond market functioning evolved over 2022 in the wake of the Russian invasion of Ukraine and the tightening of U.S. monetary policy. Today we are launching the CMDI as a regularly produced data series, with new readings to be published each month. In this post, we describe what constitutes corporate bond market distress, motivate the construction of the CMDI, and argue that secondary market measures alone are insufficient to capture market functioning.
Market distress involves both primary and secondary markets
Justice Potter Stewart famously said “I know it when I see it” in the 1964 Jacobellis vs Ohio Supreme Court ruling. So what should policymakers pay attention to in determining whether a market is in distress? The Emergency Relief and Reconstruction Act of 1932 states that, in order to supply backstop lending, that:
…the Federal Reserve Bank shall obtain evidence that such individual, partnership or corporation is unable to secure adequate credit accommodations from other banking institutions.
Similarly, the BIS Market Committee highlights that:
Market dysfunction has the potential to disrupt the flow of credit to the economy, thereby impacting real activity and price stability and, as a result, attainment of central banks’ monetary goals.
In the context of debt capital markets, access to credit will be impaired when there is a significant slowdown in primary markets where credit flows from investors to businesses.
Primary markets, however, do not exist in isolation, and secondary market conditions may affect primary market functioning if, for example, underwriters face uncertain prospects of placing new issuance. A well-functioning secondary market is one in which transactions can take place rapidly and with little impact on price, the size of transaction volume can be absorbed without undue influence on prices, execution is immediate, and prices return quickly to “normal” levels after temporary order imbalances. An important feature of episodes of market distress—or “liquidity black holes”—is that large price changes alone are not sufficient to assess market functioning as large price changes can instead indicate a smoothly functioning market incorporating new information quickly.
How do we recognize distress?
The descriptions above highlight that market distress is multifaceted and that measures of any one aspect of market functioning will likely present an incomplete picture of distress. To construct the CMDI, we coalesce information on seven aspects of market functioning—primary market volumes, primary market pricing, secondary market volumes, secondary market liquidity, secondary market pricing, secondary market default-adjusted pricing, and quoted pricing on non-traded bonds—using insights from the machine learning literature on image recognition and language processing to construct a unified measure of market functioning. As described in technical detail in our staff report, the CMDI flags market distress as periods when metrics of more aspects of market functioning are signaling distress, rather than when metrics of individual features of market distress are higher on average.
To understand the difference between these two concepts of coalescing information from multiple individual measures, consider the following simple example. Suppose that we only used bid-ask spreads and primary market volume. Which of the following two situations is more distressed?
- The bid-ask spread is in its top tenth historical percentile, so that liquidity in the market is poor, while primary market volume is also in its top tenth percentile, so that issuance is nonetheless good.
- Both the bid-ask spread and issuance volume are at their corresponding historical medians.
From the perspective of a single measure that averages across metrics, market distress is at the same level in both situations, as the average metric is in the center of the distribution in both cases. A measure that instead identifies distress as distress along a greater number of features will perceive the second situation as being potentially more concerning as the bid-ask spread and issuance volume provide conflicting signals in the first example.
The chart below plots the time series of the CMDI together with the first principal component (PCA)—a sophisticated way of averaging across metrics—of the seven features of market functioning that underlie the CMDI. The chart shows that, while both approaches correctly identify periods of extreme distress—when both the average feature indicates distress and the plurality of measures indicate distress—the PCA overidentifies market distress when market conditions are relatively calm. Our simple example illustrates this intuition: the averaging approach is more likely to be influenced by extreme observations of any one measure. In the staff report, we show that the CMDI is a better predictor of both future realizations of other measures of financial conditions and future real activity realizations than the PCA, suggesting that the CMDI does indeed provide a “cleaner” signal of market distress.
The PCA approach overidentifies market distress during periods of relative calm
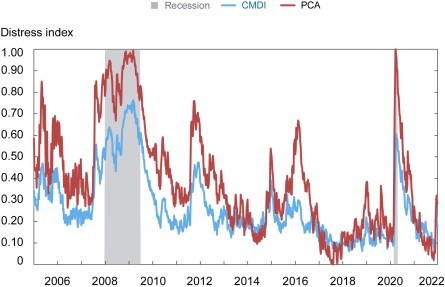
Notes: CMDI is Corporate Bond Market Distress Index. PCA is principal component analysis.
Why not just use secondary market measures?
If distress in the secondary market coincides with or even precedes distress in the primary market, then measures of flow of credit may be superfluous in the measurement of market distress. The next chart plots the time series of monthly changes in the amount of corporate debt outstanding, together with two popular measures of secondary market stress: the excess bond premium (EBP) of Gilchrist and Zakrajšek (2012) and the investment-grade credit default swap-bond (CDS-bond) basis. The chart shows that, at least contemporaneously, neither of these secondary market metrics is related to changes in debt amount outstanding, so that months with slowdowns in (net) corporate bond issuance are rarely months with high EBP or months with large dislocations between the corporate bond and CDS markets.
Secondary market measures don’t capture primary market conditions
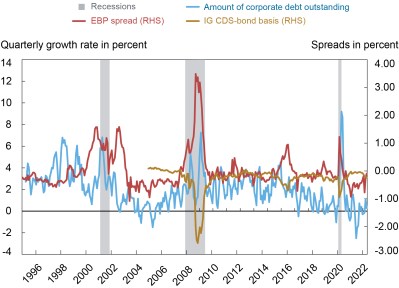
Notes: EBP is excess bond premium. IG is investment grade. CDS is credit default swap. RHS is right-hand side.
A “preponderance of metrics” approach may be useful in a variety of applications
Overall, the staff report shows that taking the “preponderance of metrics” approach to measuring corporate bond market distress produces an index that correctly identifies periods of market distress and predicts future realizations of commonly used measures of market distress. While we focus on quantifying corporate bond market distress, the similarity-based approach to summarizing information about different aspects of activity is potentially applicable in a variety of economic settings, including measuring financial vulnerabilities and identifying recessions or financial crises, as described in a previous Liberty Street Economics post.

Nina Boyarchenko is the head of Macrofinance Studies in the Federal Reserve Bank of New York’s Research and Statistics Group.

Richard K. Crump is a financial research advisor in Macrofinance Studies in the Federal Reserve Bank of New York’s Research and Statistics Group.

Anna Kovner is the director of Financial Stability Policy Research in the Bank’s Research and Statistics Group.

Or Shachar is a financial research economist in Capital Markets Studies in the Federal Reserve Bank of New York’s Research and Statistics Group.
How to cite this post:
Nina Boyarchenko, Richard Crump, Anna Kovner, and Or Shachar, “What Is Corporate Bond Market Distress?,” Federal Reserve Bank of New York Liberty Street Economics, June 29, 2022, https://libertystreeteconomics.newyorkfed.org/2022/06/what-is-corporate-bond-market-distress/
BibTeX: View |
Disclaimer
The views expressed in this post are those of the author(s) and do not necessarily reflect the position of the Federal Reserve Bank of New York or the Federal Reserve System. Any errors or omissions are the responsibility of the author(s).
 RSS Feed
 Follow Liberty Street Economics
In reply to Brian:
There have been prior episodes of monetary policy tightening for which index readings for the investment-grade (IG) segment of the bond market rose more than the high-yield (HY) segment, so it’s not a completely unusual picture (see, for example, the tightening cycle beginning in December 2015 which showed similar patterns). Looking at the contributions to the index of primary vs secondary market conditions, in general, we see larger increases in many of index subcomponents for IG than HY in the recent months. This is a feature of the composition of the index, in that the index increases when many subcomponents increase. For IG, the secondary market sub-indices tend to move up in particular during tightening cycles, which we saw both in the end of 2015 to the beginning of 2016 and see now. Metrics of secondary market volume in particular seem to be contributing to the differential movements in IG vs HY. Primary market metrics for IG have been relatively rangebound recently. While there have been similar increases in the HY subcomponents, the magnitude of the increases has been smaller.
In general, we believe that focusing on any one subcomponent of the index can create an incomplete picture, which is why we are focused on sharing data on the aggregate index itself. As mentioned above and in our published analysis, a key to the index is the way that it thinks about co-movement between the index subcomponents, increasing more when a number of measures appear dislocated.
Hi, is there a primary component or two that drives such a large difference in HY vs IG stress, IG at 75th percentile and HY at 25th percentile seems counterintuitive? Thank you! https://www.newyorkfed.org/research/policy/cmdi#/interactive
In reply to Srihari:
Thanks for your question. The aim of this index is to capture distress in the corporate bond market. As such, it focuses on bond market measures and not equity market measures. The index is designed to incorporate signals from different measures and thus should not flag episodes where only a particular sub-sector experiences negative economic fundamentals. In addition to the way the index is aggregated to avoid overweighting any single signal, we also take care to include signals such as default adjusted spreads which take into account the impact of changes to the risk of bond issuers.
If this is a contrarian index, and positively correlated with VIX, out of the seven sub-indices, why was there no representation or a sub-index chosen to capture a broad exposure to equities? Second, how does CMDI delimit or delineate the noise stemming from a particular sector either in distress or about to encounter headwinds or dislocation like housing, although builder stocks may be at decade high, with the corporate bond issuance and performance otherwise normal? Would the CMDI remain normal and not flag an underlying anomaly?