


This post presents an update of the economic forecasts generated by the Federal Reserve Bank of New York’s dynamic stochastic general equilibrium (DSGE) model. We describe very briefly our forecast and its change since June 2022.
As usual, we wish to remind our readers that the DSGE model forecast is not an official New York Fed forecast, but only an input to the Research staff’s overall forecasting process. For more information about the model and variables discussed here, see our DSGE model Q & A.
The New York Fed model forecasts use data released through 2022:Q2, augmented for 2022:Q3 with the median forecasts for real GDP growth and core PCE inflation from the August release of the Philadelphia Fed Survey of Professional Forecasters (SPF), as well as the yields on 10-year Treasury securities and Baa-rated corporate bonds, based on 2022:Q3 averages up to August 26. In addition, for each quarter starting in 2021:Q4, the expected federal funds rate between one and six quarters into the future is restricted to equal the corresponding median point forecast from the latest available Survey of Primary Dealers (SPD) in that quarter. For the current projection, this is the July SPD.
The outlook compared to June is slightly more pessimistic in terms of inflation, and broadly unchanged in terms of real activity. This evolution of the projections is the result of two forces. On the one hand, the model sees the underlying state of the real economy as stronger than it did in June, as evidenced by the higher projections for the real natural rate of interest (1.4 percent versus 0.9 percent for 2022, 1.2 percent versus 0.9 percent for 2023, and 1.0 percent versus 0.9 percent for 2024). On the other hand, monetary policy is expected to be substantially tighter than in June, not only in absolute terms but also relative to the more elevated real natural rate.
These two forces roughly cancel one another out in terms of output growth. Output growth is projected to be slightly lower for 2022 (-0.7 percent versus -0.6 percent), largely as a result of the fact that Q2 growth was lower than nowcasted by the SPF in May. The model projects slightly higher growth for 2023 (-0.4 percent versus -0.5 percent) and once again lowers the growth forecast for 2024 (0.1 percent versus 0.4 percent). For 2025, the model expects growth to still be below trend, partly because monetary policy remains quite tight in its projections. The DSGE still sees a fairly high likelihood of a recession in the next couple of years. The probability of a not-so-soft landing–defined as four-quarter GDP growth dipping below -1 percent, as occurred during the 1990 recession, at least once over the next ten quarters–remains about 80 percent. The output gap is expected to turn negative in the medium term, declining from 0.8 percent at the end of 2022 to -0.3 percent in 2023, -1.2 percent in 2024, and -1.7 percent in 2025.
The changed assessment of the underlying strength of the economy has implications for the inflation projections as well. The model attributes the current high inflation less to transitory factors, such as supply disruptions, and more to persistent factors. As a consequence, the model projects that inflation will remain elevated in 2022 at 4.1 percent, up 0.3 percentage points relative to June, and decline only gradually thereafter (to 3.1, 2.6, and 2.4 percent in 2023, 2024, and 2025, respectively—versus projections of 2.5, 2.1, and 2.0 percent in June). Because the Phillips curve is estimated to be flat in the DSGE, tighter monetary policy has a limited effect on the projected course of inflation.
Forecast Comparison
| 2022 | 2023 | 2024 | 2025 | |||||
|---|---|---|---|---|---|---|---|---|
| Sep | Jun | Sep | Jun | Sep | Jun | Sep | Jun | |
| GDP growth (Q4/Q4) | -0.7 (-2.3, 0.8) | -0.6 (-3.6, 2.3) | -0.4 (-5.2, 4.4) | -0.5 (-5.0, 4.0) | 0.1 (-4.7, 4.9) | 0.4 (-4.4, 5.3) | 0.7 (-4.5, 5.9) | 1.4 (-3.9, 6.5) |
| Core PCE inflation (Q4/Q4) | 4.1 (3.8, 4.4) | 3.8 (3.3, 4.4) | 3.1 (2.3, 3.8) | 2.5 (1.7, 3.4) | 2.6 (1.7, 3.5) | 2.1 (1.2, 3.1) | 2.4 (1.4, 3.4) | 2.0 (1.0, 3.0) |
| Real natural rate of interest (Q4) | 1.4 (0.2, 2.6) | 0.9 (-0.4, 2.1) | 1.2 (-0.3, 2.6) | 0.9 (-0.5, 2.4) | 1.0 (-0.6, 2.6) | 0.9 (-0.7, 2.4) | 0.9 (-0.7, 2.6) | 0.8 (-0.9, 2.5) |
Notes: This table lists the forecasts of output growth, core PCE inflation, and the real natural rate of interest from the September 2022 and June 2022 forecasts. The numbers outside parentheses are the mean forecasts, and the numbers in parentheses are the 68 percent bands.
Forecasts of Output Growth
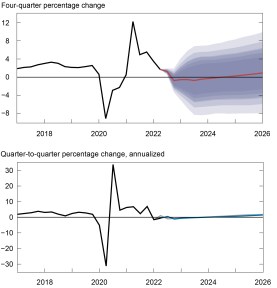
Notes: These two panels depict output growth. In the top panel, the black line indicates actual data and the red line shows the model forecasts. The shaded areas mark the uncertainty associated with our forecasts at 50, 60, 70, 80, and 90 percent probability intervals. In the bottom panel, the blue line shows the current forecast (quarter-to-quarter, annualized), and the gray line shows the June 2022 forecast.
Forecasts of Inflation
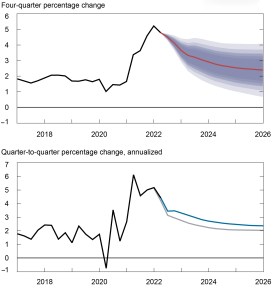
Notes: These two panels depict core personal consumption expenditures (PCE) inflation. In the top panel, the black line indicates actual data and the red line shows the model forecasts. The shaded areas mark the uncertainty associated with our forecasts at 50, 60, 70, 80, and 90 percent probability intervals. In the bottom panel, the blue line shows the current forecast (quarter-to-quarter, annualized), and the gray line shows the June 2022 forecast.
Real Natural Rate of Interest
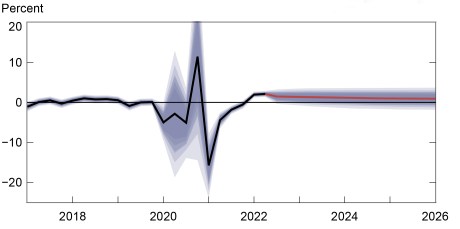
Notes: The black line shows the model’s mean estimate of the real natural rate of interest; the red line shows the model forecast of the real natural rate. The shaded area marks the uncertainty associated with the forecasts at 50, 60, 70, 80, and 90 percent probability intervals.
The DSGE model is a product of the New York Fed’s Applied Macroeconomics and Econometrics Center (AMEC). To learn more about AMEC’s work, please visit the Center’s website.

Marco Del Negro is an economic research advisor in Macroeconomic and Monetary Studies in the Federal Reserve Bank of New York’s Research and Statistics Group.

Keshav Dogra is a senior economist in Macroeconomic and Monetary Studies in the Federal Reserve Bank of New York’s Research and Statistics Group.

Aidan Gleich is a senior research analyst in the Bank’s Research and Statistics Group.

Donggyu Lee is a research economist in Macroeconomic and Monetary Studies in the Federal Reserve Bank of New York’s Research and Statistics Group.
Ramya Nallamotu is a senior research analyst in the Bank’s Research and Statistics Group.

Sikata Sengupta is a senior research analyst in the Bank’s Research and Statistics Group.
How to cite this post:
Marco Del Negro, Keshav Dogra, Aidan Gleich, Donggyu Lee, Ramya Nallamotu, and Sikata Sengupta, “The New York Fed DSGE Model Forecast—September 2022,” Federal Reserve Bank of New York Liberty Street Economics, September 23, 2022, https://libertystreeteconomics.newyorkfed.org/2022/09/the-new-york-fed-dsge-model-forecast-september-2022/
BibTeX: View |
Disclaimer
The views expressed in this post are those of the author(s) and do not necessarily reflect the position of the Federal Reserve Bank of New York or the Federal Reserve System. Any errors or omissions are the responsibility of the author(s).
 RSS Feed
 Follow Liberty Street Economics