


After making progress slowing the pace of debt accumulation prior to the pandemic, China saw its debt levels surge in 2020 as the government responded to the severe economic slowdown with credit-led stimulus. With China currently in the midst of another sharp decline in economic activity due to its property slump and zero-COVID strategy, Chinese authorities have responded again by pushing out credit to soften the downturn despite already high levels of debt on corporate, household, and government balance sheets. In this post, we revisit China’s debt buildup and consider the growing constraints on Chinese policymakers’ tools to navigate future economic challenges.
China’s Waves of Debt
Previous posts have explored China’s credit boom and rise of household debt. China’s policy response to the global financial crisis in 2009 unleashed nearly ten years of uninterrupted growth in debt, with credit to the nonfinancial sector exploding by almost 150 percent of GDP, according to data from the Bank for International Settlements—one of the largest increases in modern history. It was not until 2018 that Chinese authorities were able to briefly stabilize these debt ratios through a hard-fought “deleveraging campaign.”
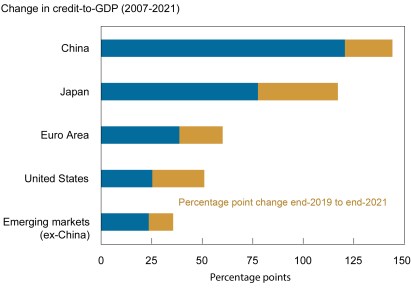
China’s debt ratio resumed its upward trend in 2019, but then exploded again in 2020 as China was the first country in the world to respond to the pandemic. China’s run-up in credit in 2020 totaled nearly 29 percentage points of GDP but was short-lived, as the credit ratio contracted modestly in 2021. As COVID-19 spread globally, other countries’ policy responses were also associated with rising debt ratios, with China’s increase comparable to that of other countries, as illustrated in the chart below. However, while other major economies in the world are now tightening their monetary policies, expectations are for overall debt in China to rise again in 2022 to stabilize growth. China’s repeated reliance on credit-driven stimulus raises questions about the buildup of risks in the financial system and the extent to which rising debt levels in all three sectors—discussed below—are sustainable and could ultimately hamstring Chinese authorities’ policy options.
China Has Seen a Sharp Run-Up in Debt Levels
One Step Forward, Two Steps Back
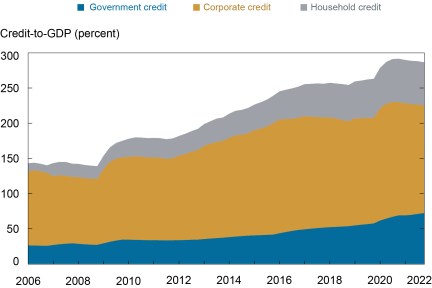
As illustrated in the chart below, China’s total nonfinancial sector credit was almost 290 percent of GDP at the end of 2021. Borrowing by the corporate sector—the largest part of China’s total debt—is equivalent to approximately 153 percent of GDP, a figure that is among the highest in the world. China’s deleveraging campaign was effective in curbing runaway growth in shadow credit, but growth in corporate leverage resumed with pandemic-related stimulus. While estimates vary, state-owned enterprises (SOEs) account for around 50 to 60 percent of total corporate debt, with the remainder held on Chinese privately owned corporate balance sheets. Entities known as local government financing vehicles are also classified as corporate debt in China, although a large portion of these debts are assumed to be implicit government debt, as discussed in the next section. Repayment concerns involving corporate debt in China primarily relate to lending to inefficient SOEs and distressed real estate developers, with the latter the focus of authorities’ efforts over the past two years to reduce leverage in the property sector.
Corporate, Household, and Government Debt Have All Increased Notably
Household debt accounts for 62 percent of GDP in China and has grown rapidly in recent years, raising concerns around increasingly stretched household balance sheets. China’s household debt has risen to levels that are quite high by developing country standards but remain broadly comparable to those of developed economies. As illustrated in the two charts below, the ratio of household debt to income in China is currently estimated to be in a range above the median for the economies in the OECD, while household debt service ratios have increased steadily and now exceed those in the United States, approaching even Korea.
Household Debt, in Particular, Has Surged
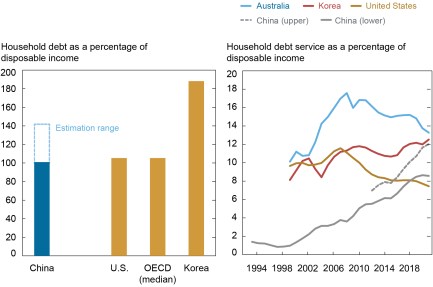
Notes: The estimation range shown in the left panel uses household debt as reported by the BIS in the numerator and disposable income as reported by the sum of compensation of labor and property income in the flow of funds (lower range) and the household survey (upper range). The lower and upper ranges shown in the right panel use disposable income reported in the flow of funds (labor compensation and property income) and the household survey, respectively.
Mortgage loans make up roughly 63 percent of China’s total household debt (39 percent of GDP). Chinese authorities’ recent focus on curbing excesses in the property sector—and intermittent COVID-related lockdowns—have slowed mortgage growth notably, to under 10 percent year over year as of July after averaging more than twice that pace over the past six years. Property developers’ struggles to complete construction of pre-sold properties have likely added to the debt burdens of Chinese households, who are waiting to move into new properties yet still making rental or mortgage payments on current residences. In response, an increasing number of home buyers in China have threatened to suspend mortgage payments on undelivered homes, increasing financial risks to banks and developers.
Officially recognized central and local government debt in China is moderate by international standards, at about 50 percent of GDP. However, estimates of “augmented” fiscal debt are much higher, at up to 100 percent of GDP for year-end 2021, according to IMF estimates. The sizable gap between these numbers represents debt that has been issued for fiscal purposes—typically categorized as corporate loans—and likely requires implicit fiscal assistance to be serviced or repaid, or that could be recognized as official debt under some circumstances. This “hidden” government debt is almost entirely borne by local governments, which are highly reliant on the property sector for financing and have much less fiscal flexibility than the central government.
Is China Heading for a Financial Crisis?
International experience suggests that rapid buildup of debt is often followed by financial crises or at least extended periods of much slower economic growth. Thus far, China has managed to avoid a severe day of reckoning, and Chinese authorities are still viewed as having considerable policy tools to manage the nation’s economy and associated financial risks
These tools stem from unique features of the Chinese political and financial system. For example, China’s government maintains direct and indirect control of the country’s financial and nonfinancial sectors at the central and local level, including through ownership of most of the banks in the financial system and a significant portion of nonfinancial corporate firms. In addition, China’s domestic economy is shielded from external shocks by its current account surplus, large stock of foreign exchange reserves, and capital controls. Finally, China possesses ample scope to use monetary, credit, and central government fiscal policies to dampen economic fluctuations, as reflected in the response to the pandemic.
Despite this unique array of policy tools, China has not been immune to financial turbulence over the past decade. China experienced an interbank market crisis in 2013, equity market busts in 2007 and 2015, massive capital outflows in 2015-16, a spate of bank failures in 2019, and most recently a crisis in its property sector accompanied by additional pressures on parts of its banking sector.
Against such a backdrop, there are strong reasons to be watchful for signs of a sustained downshift in China’s historical pattern of economic performance. First, there is evidence that China’s credit-driven growth model is facing serious diminishing returns, as shown, for example, in the high and steadily increasing incremental capital to output ratio (shown in the chart on left below) and rising credit intensity (shown in chart on right). The decline in the “GDP bang for the credit buck” suggests that the old playbook of turning on the credit spigots will be less effective than in the past, while leading to the potential for increases in bad debt. Our colleague, Matthew Higgins, has written more extensively on the self-limiting nature of capital accumulation as a growth driver in China.
Is China’s Credit-Driven Growth Model Now Pushing on a String?
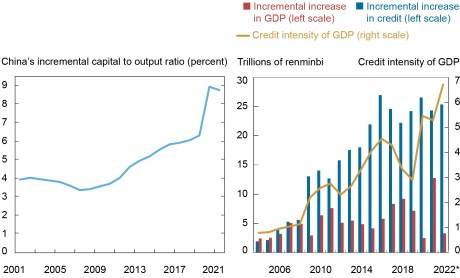
Notes: Left panel shows five-year moving average. Incremental capital to output ratio (ICOR) is calculated as the ratio of gross fixed capital formation to GDP divided by real GDP growth. In right panel, data shown for 2022 are through June. Credit intensity of GDP is the ratio of the incremental increase in credit over the incremental increase in GDP on a three-year moving average.
Second, fiscal and monetary policies appear to face political and institutional constraints that may not be readily apparent from the data. On the fiscal side, even though official debt levels appear quite manageable, local governments are experiencing rapidly increasing debt burdens that remain hidden in local government affiliated enterprises and financial institutions. Based on China’s historical precedent, addressing these issues will likely take years of reform and fiscal tightening, which will create an additional drag on growth. On the monetary side, the authorities likely face constraints on cutting interest rates and reserve requirements for fear of sparking capital outflows or weakening banks’ profitability and encouraging additional buildups of risky borrowing.
Finally, China faces other important challenges that will represent a sharp departure from the conditions it has experienced since Deng Xiaoping launched the country on its path of economic reform roughly four decades ago. Most profoundly, China’s demographic profile is aging quickly, which will greatly increase old-age dependency and lead to a reduction in the working population. Moreover, as its share of global trade stops rising, China’s export engine eventually will downshift to a growth rate similar to that of world trade, or perhaps even lower. Against this backdrop, the medium- to long-term outlook for China’s economy will likely hinge more than ever on the quality of its economic and institutional policies.

Hunter L. Clark is an international policy advisor in International Studies in the Federal Reserve Bank of New York’s Research and Statistics Group.

Jeffrey B. Dawson is an international policy advisor in International Studies in the Federal Reserve Bank of New York’s Research and Statistics Group.
How to cite this post:
Hunter Clark and Jeff Dawson, “Is China Running Out of Policy Space to Navigate Future Economic Challenges?,” Federal Reserve Bank of New York Liberty Street Economics, September 26, 2022, https://libertystreeteconomics.newyorkfed.org/2022/09/is-china-running-out-of-policy-space-to-navigate-future-economic-challenges/
BibTeX: View |
Disclaimer
The views expressed in this post are those of the author(s) and do not necessarily reflect the position of the Federal Reserve Bank of New York or the Federal Reserve System. Any errors or omissions are the responsibility of the author(s).
 RSS Feed
 Follow Liberty Street Economics