


While considerable attention has focused on China’s credit boom and the rise of China’s domestic debt levels, another important development in international finance has been growth in China’s lending abroad. In this post, we summarize what is known about the size and scope of China’s external lending, discuss the incentives that drove this lending, and consider some of the challenges these exposures pose for Chinese lenders and foreign borrowers.
The Largest Banks in the World
China’s global financial footprint has grown rapidly over the last decade. The country’s total banking system assets were a massive $54 trillion at the end of 2021, the largest in the world, tripling in size over the past ten years. Individually, the top four commercial banks globally by assets are from China. While banking asset growth in China has been slowing over the past few years, even at this slower pace the Chinese banking system is likely to surpass the size of the U.S. and European banking systems combined by 2030, as illustrated in the chart below. Yet most Chinese banking assets are still held domestically in renminbi-denominated loans.
China’s Banking System Has Become a Global Behemoth
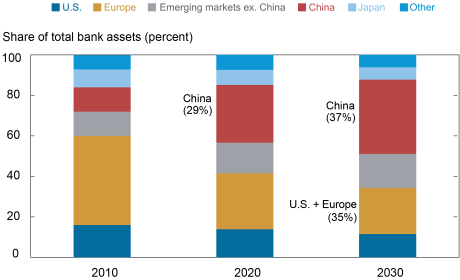
Notes: Other is Canada and Australia. Bank asset growth is estimated at 6.6 percent per annum for China, 2 percent per annum for U.S., Europe, Japan, Canada, and Australia, and 5 percent per annum for emerging markets.
China’s Expansion Abroad through the Lens of the IIP
We view China’s overseas expansion through the lens of its international investment position (IIP), the balance sheet of a country’s external assets and liabilities. The IIP highlights the size, composition, and growth of Chinese external financial assets in broad terms, as seen in the chart below. According to data from China’s State Administration of Foreign Exchange (SAFE), China’s external financial assets totaled $9.2 trillion as of June 2022. Official foreign exchange reserves ($3.1 trillion) typically garner the most attention among market participants and are still the largest component. After declining sharply from 2014 to 2017, these levels have remained relatively stable over the past five years. By contrast, China’s non-reserve external assets, which include foreign direct investment (FDI), portfolio investment, and external lending, have almost quadrupled over the past ten years, increasing to roughly $6 trillion.
China’s Non-reserve External Assets Nearly Quadrupled Over the Last Decade
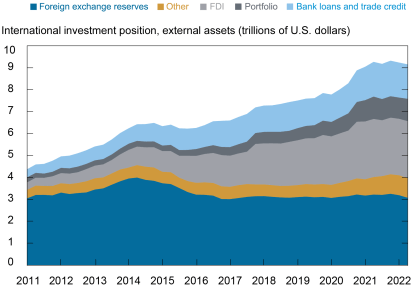
Note: Data are as of June 2022.
Shades of Japan’s Expansion Abroad
In some respects, China’s rapid increase in non-reserve external assets draws parallels to Japan’s financial integration with the rest of the world in the 1980s and early 1990s. Over a ten-year period ending in 1993, Japan’s non-reserve external assets rose from 2 percent of world GDP to 8 percent, as shown in the chart below. Japan’s expansion was driven by sizable flows of both outward FDI and overseas lending. Overseas lending went to support Japanese real-estate and construction companies, which markedly increased their FDI in advanced economies. Similarly, over the past decade China’s non-reserve external assets climbed to roughly 6 percent of world GDP from a comparable level. Chinese state-owned commercial banks and policy banks, which target development lending in certain sectors, have supported extensive outbound FDI by Chinese state-owned enterprises. In China’s case, a large portion of overseas lending has financed Chinese-led infrastructure projects in developing countries. For both Japan and China, increases in external lending accounted for roughly a third of non-reserve asset growth.
China’s Path Bears Some Resemblance to Japan’s

Recent Trends in External Lending
The left panel of the chart below shows the growth of Chinese external lending, which has increased to nearly $2.0 trillion as of June 2022. This includes bank loans, trade credits, and debt claims from China’s FDI (in other words, intercompany lending). Bank loans and trade credits account for most of this total. As highlighted in the right panel, Chinese banks now rank sixth among international creditors, according to statistics from the Bank for International Settlements. Yet China’s overseas bank lending still accounts for only about 5 percent of its total banking assets, suggesting there is still considerable room to expand. By comparison, cross-border loans are roughly 20 percent and 24 percent of total banking assets among U.S. and Japanese banks, respectively.
Growth in China’s External Lending Has Surged
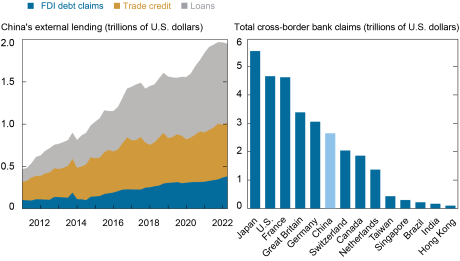
Note: Data are as of June 2022 (left panel) and March 2022 (right panel).
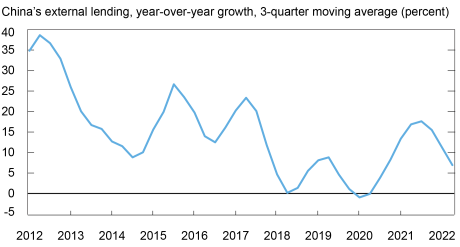
Trends in external lending over the past ten years show robust expansion from 2012 through 2017, with growth averaging nearly 25 percent year-over-year, as illustrated in the chart below. This corresponds loosely with the early years of China’s Belt and Road Initiative (BRI), a sweeping plan to promote infrastructure development across emerging economies using Chinese financing. While there is still considerable uncertainty about the exact nature, scale, and scope of the BRI, researchers count 139 countries that have signed BRI cooperation agreements or formal memorandums of understanding with China. Recently, trends in the external lending data show another surge in growth at the beginning of the pandemic, although the drivers of this pickup in growth are unclear. According to China’s IIP, external lending increased by $392 billion from the end of 2019 through June 2022, of which $238 billion were bank loans. The BIS data show a similar trend, with cross-border bank loans increasing by $259 billion through March of the same year.
External Lending Appeared to Pick Up during the Pandemic
Note: External lending includes loans, trade credits, and foreign direct investment debt claims.
Piecing Together a More Detailed Picture
While the IIP data paint a broad-brush picture of China’s external lending, a granular view of China’s lending activities overseas is severely hampered by a lack of transparency. China only reports partial data on banking statistics to the BIS. Moreover, China is not a member of international creditor organizations like the Paris Club that provide data on official lending and restructuring. As a result, researchers have worked around data gaps using a range of alternative sources to shed light on details surrounding the size, scope, and terms of Chinese financing activities abroad. Various studies catalog a complex web of tens of thousands of individual loan commitments financed by a wide variety of Chinese state-owned financial institutions and government agencies. The findings draw some conclusions. Namely, estimates of China’s official lending are that it is sizable and concentrated in low- and middle-income countries, ranging from $500 billion to $1 trillion in financing for mostly Chinese infrastructure projects.
Other research notes that most Chinese infrastructure lending abroad comes via loans on commercial terms (around 90 percent), lent mostly in U.S. dollars at or near market rates, according to AidData. These loans tend to be more focused on energy and other resource-oriented projects, often collateralized with future commodity export receipts or project revenues. Indeed, incentives for China’s international lending program include securing natural resources that China lacks in sufficient quantities domestically, creating overseas demand for oversupplied industrial inputs from China, recycling excess foreign currency from persistent trade surpluses, competing for market share abroad, and for geopolitical objectives. Notably, only roughly a tenth of Chinese overseas infrastructure lending is on highly concessional terms comparable to financing provided by other bilateral aid agencies or multilateral development banks.
Chinese state-owned commercial banks have been at the forefront of BRI since its inception in 2013. AidData’s findings highlight that while China’s policy banks led the increase in overseas lending prior to the inception of the BRI, China’s large, state-owned commercial banks have been the key driver of lending abroad since. These state-owned commercial banks’ overseas loans showed a fivefold increase during the first five years of the BRI, which roughly aligns with the pickup in external lending growth seen in the previous chart.
Growing Challenges and a Complex Road Ahead
As financial conditions in many developing countries have deteriorated—initially due to the pandemic and more recently as global monetary policy tightens to address rapid inflation—growing evidence indicates that China’s overseas loans are facing increasing repayment pressure. Horn et al estimate that China’s total loan portfolio to borrowing countries in “distress” (defined as countries in arrears or restructuring debt with China, participating in the World Bank’s Debt Service Suspension Initiative, or at war) surged from 5 percent in 2010 to 60 percent at present. Other estimates point to a notable pickup in the amount of renegotiated overseas loans from Chinese institutions over the past two years. This comes at a time when Chinese financial institutions are already facing headwinds from a significant slowdown in economic growth in China and spillovers from high exposure to the ongoing property slump domestically. A pullback in overseas lending by Chinese banks could also amplify associated risks in these borrowing countries.
While Chinese banks and other government entities appear to have capacity to absorb eventual credit losses on overseas portfolios, Chinese authorities face a complex set of challenges given China’s role as creditor to a growing number of developing countries in distress. Since most of Chinese overseas lending is extended by various state-owned entities, China has become the largest official creditor in the world, with outstanding loans that are larger than those of the World Bank, the International Monetary Fund, and Paris Club bilateral lenders combined. China has limited experience in restructuring sovereign debt and an inconsistent track record in cooperating with other multilateral creditors. Moreover, Chinese loans come from a variety of state-owned banks and institutions whose incentives often vary, adding additional complexity to restructuring negotiations. More broadly, the outlook for China’s future overseas lending is another important question. While China has provided important financing to help fill infrastructure investment and balance of payments financing needs in developing countries, it is unclear how China’s cross-border lending will evolve, particularly if credit losses increase or if Chinese leadership continues to reorient policy priorities to more of a domestic focus.

Jeffrey B. Dawson is an international policy advisor in International Studies in the Federal Reserve Bank of New York’s Research and Statistics Group.
How to cite this post:
Jeff Dawson, “A Closer Look at Chinese Overseas Lending,” Federal Reserve Bank of New York Liberty Street Economics, November 9, 2022, https://libertystreeteconomics.newyorkfed.org/2022/11/a-closer-look-at-chinese-overseas-lending/
BibTeX: View |
Disclaimer
The views expressed in this post are those of the author(s) and do not necessarily reflect the position of the Federal Reserve Bank of New York or the Federal Reserve System. Any errors or omissions are the responsibility of the author(s).
 RSS Feed
 Follow Liberty Street Economics
Jeff this is an excellent, thorough, and insightful piece on a very important topic. Congratulations.