


Editor’s note: The second, third, and fourth charts in this post have been revised to account for the Swiss National Bank’s domestic open market operations in October 2022; that activity was initially classified as foreign exchange intervention in our data set.
Currency values are important both for the real economy and the financial sector. When faced with currency market pressures, some central banks and finance ministries turn to foreign exchange intervention (FXI) in an effort to reduce realized currency depreciation, thus diminishing its economic and financial consequences. This post provides insights into how effective these interventions might be in limiting currency depreciation.
Falling against the Dollar
Currency depreciations may increase the competitiveness of exports on international markets and drive up the cost of recurring payments on foreign-currency debt owed by governments and private firms. Currency depreciations also alter the value of domestic and foreign currency assets in investor portfolios, spurring wealth effects and inducing portfolio rebalancing. Moreover, the impact of surging commodity prices, often invoiced in dollars, can exacerbate domestic inflation and widen governments’ budget deficits.
These dynamics are certainly of concern in 2022, with many currencies having lost considerable value against the U.S. dollar, as measured by bilateral exchange rates. The chart below shows that these nominal valuation changes have been over 10 percent for many countries, and closer to 20 percent for others.
Change in Nominal Currency Values vis-à-vis the U.S. Dollar, January-October 2022
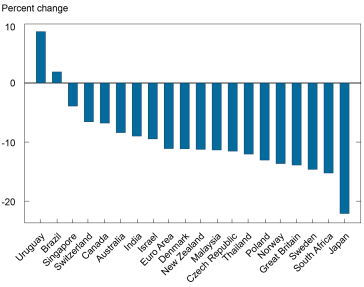
Note: Figures are calculated as the percentage change in the end-of-month nominal bilateral exchange rate.
Near-Term Effects of Foreign Exchange Intervention
Central banks have accumulated unprecedentedly large portfolios of foreign currency reserve assets, which now exceed $12.5 trillion globally. Economists disagree about the efficacy of official FXI as a means of substantially and durably altering exchange rates and meaningfully affecting real economic activity. Standard econometric work on their impact is challenging due to endogeneity issues.
Recent theoretical and empirical research—including Filardo, Gelos, and McGregor (2022) and Fratzscher, Gloede, Menkhoff, Sarno, and Stohr (2019)—has shed new light on this policy question. For example, Maggiori (2022) argues that market conditions, including size, liquidity, and balance sheet capacity, strongly determine the effectiveness of FXI. As a result, central bankers can move the exchange rate more significantly in the presence of market segmentation, poor liquidity, and limited risk appetite/capacity among global financial intermediaries.
Goldberg and Krogstrup’s (2022) model, based on balance of payments equilibrium conditions and investor portfolio reallocations, shows some of the challenges involved in generating estimates of the implied effectiveness of FXI, calculated in terms of avoided currency depreciation. By construction, the Goldberg and Krogstrup (2022) Exchange Market Pressure (EMP) measure relies on the balance of payments equilibrium and considers the demand for and supply of foreign assets and liabilities. The depreciation avoided by selling foreign currency in international markets is country- and time-specific. In general, interventions have a larger impact for countries with smaller gross international investment positions, for which investor portfolio shares are less sensitive to exchange rate shifts, and when wealth effects driven by exchange rate swings are minor.
The EMP measure considers how countries’ dollar exchange rates compare with a counterfactual measure that accounts for the mitigating effects of central banks’ market and interest rate actions. The model-implied effects of these interventions in countering bilateral exchange rate depreciation differ dramatically across countries and stress periods in financial markets.
How Much Currency Pressure Has Been Offset?
We illustrate the variation in both the use and efficacy of FXI using global FX flows data from Exante Data for twenty major economies: Brazil, Chile, China, Colombia, Czech Republic, Denmark, Hong Kong (PRC), Hungary, India, Israel, Japan, Korea, Malaysia, Mexico, Poland, Russia, Singapore, South Africa, Switzerland, and Thailand; large advanced economies excluded from our analysis (including Australia, Canada, the euro area, and the United Kingdom) generally have free-floating currencies. The database reports the magnitudes of both spot—transactions settling within t+2 days—and forward—transactions settling in more than t+2 days—interventions, excluding options and other instruments.
As the charts below show, early in the pandemic period, net interventions across our sample were nearly always positive—indicating broad-based accumulation of FX reserves, which can prevent strengthening of domestic currencies—but have shifted to negative territory since January amid efforts to offset domestic currency depreciation (upper chart). Net interventions have been strongly negative for most of these countries individually (lower chart).
Recent Sales of Foreign Exchange Reserves Follow Buildup during the Pandemic
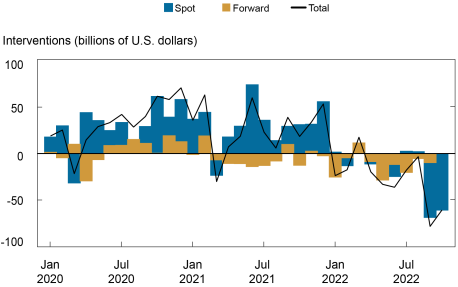
Notes: Interventions > 0 indicate accumulation of foreign currency reserve assets, whereas interventions < 0 indicate the sale of foreign exchange reserves.
Official Foreign Exchange Interventions Vary Widely in Size and Direction
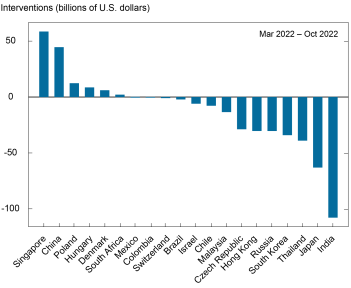
Notes: Interventions > 0 indicate accumulation of foreign currency reserve assets, whereas interventions < 0 indicate the sale of foreign exchange reserves.
Using this approach, how much pressure on exchange rates has been masked by FX interventions? The following chart shows the EMP model prediction of how much higher/lower a currency would be vis-à-vis the U.S. dollar in the absence of intervention across three periods of high stress: (i) the Global Financial Crisis (September 2008 to April 2009), (ii) the early months of the COVID-19 pandemic (February 2020 to April 2020), and (iii) the Russian invasion of Ukraine and the recent monetary policy tightening period (March 2022 to October 2022).
The magnitude of the currency pressures offset by FXI varies considerably for each country over time. However, common themes run through all of these stress periods:
- For a given size of intervention, countries with smaller external positions and FX markets are estimated to offset relatively more market pressure.
- Countries intervene in different directions even within the same limited time window.
- Countries do not intervene in the same direction across different stress periods. For example, during the Global Financial Crisis, China accumulated considerable reserves and prevented a roughly 15 percent appreciation of the renminbi versus the U.S. dollar, while during the Covid crisis, interventions had a comparatively small impact on the renminbi/dollar exchange rate.
Model-Implied Magnitudes of Currency Appreciation or Depreciation Mitigation Vary across Stress Episodes
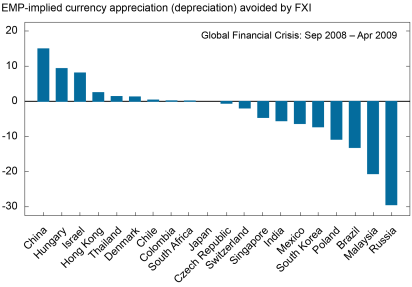

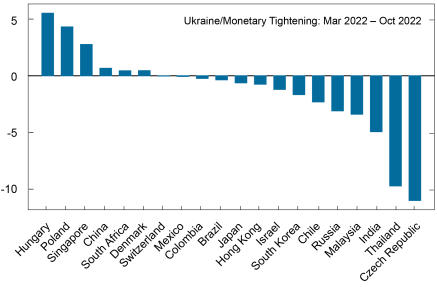
Notes: Figures indicate how much higher/lower a currency would be valued against the U.S. dollar in the absence of foreign exchange intervention. In the first panel, for example, the Chinese renminbi would be 15 percent higher against the U.S. dollar without FXI, and the Brazilian real would be 13.1 percent lower.
In recent months, FX interventions have taken the form of sales of foreign official assets and are overwhelmingly aimed at limiting the extent of domestic currency depreciation against the U.S. dollar. Although some of the most extensive (absolute) interventions this year have come from large economies, according to the EMP model, they have not all contributed to significantly stronger currencies. With a few exceptions, FX interventions are estimated to have altered bilateral exchange rate depreciations by only modest amounts. For the major advanced and emerging market currencies, whose moves dominate the financial press (for example, the Japanese yen, Chinese renminbi, Brazilian real), the values predicted by the Exchange Market Pressure measure are not much different from observed currency values.

Linda S. Goldberg is a financial research advisor for Financial Intermediation Policy Research in the Federal Reserve Bank of New York’s Research and Statistics Group.

Stone B. Kalisa is a research analyst in the Federal Reserve Bank of New York’s Research and Statistics Group.
How to cite this post:
Linda S. Goldberg and Stone B. Kalisa, “Do Exchange Rates Fully Reflect Currency Pressures?,” Federal Reserve Bank of New York Liberty Street Economics, November 10, 2022, https://libertystreeteconomics.newyorkfed.org/2022/11/do-exchange-rates-fully-reflect-currency-pressures/
BibTeX: View |
Disclaimer
The views expressed in this post are those of the author(s) and do not necessarily reflect the position of the Federal Reserve Bank of New York or the Federal Reserve System. Any errors or omissions are the responsibility of the author(s).
 RSS Feed
 Follow Liberty Street Economics