


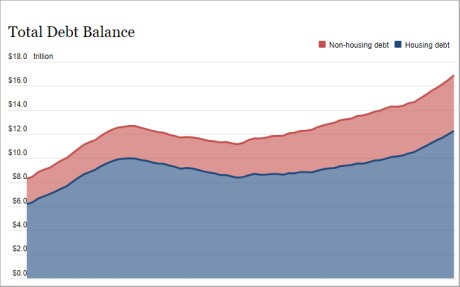
Total household debt balances increased by $16 billion in the second quarter of 2023, according to the latest Quarterly Report on Household Debt and Credit from the New York Fed’s Center for Microeconomic Data. This reflects a modest rise from the first quarter. Credit card balances saw the largest increase of all debt types—$45 billion—and now stand at $1.03 trillion, surpassing $1 trillion in nominal terms for the first time in the series history. After a sharp contraction in the first year of the pandemic, credit card balances have seen seven quarters of year-over-year growth. The second quarter of 2023 saw a brisk 16.2 percent increase from the previous year, continuing this strong trend. With credit card balances at historic highs, we consider how lending and repayment have evolved using the New York Fed’s Consumer Credit Panel (CCP), which is based on anonymized Equifax credit report data.
Credit Card Issuance
Credit cards are the most prevalent form of household debt and continue to become even more widespread. Consider that there are 70 million more credit card accounts open now than there were in 2019, before the pandemic. What’s more, about 69 percent of Americans had a credit card account in the second quarter of 2023, up from 65 percent in December of 2019 and only 59 percent in December of 2013. And while lending did take a dip during the first year of the pandemic, credit card issuances have been at somewhat elevated levels since.
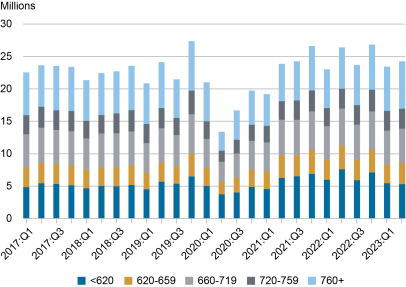
In the chart below, we depict the opening of new credit card accounts, broken out by the borrowers’ credit scores. Credit card issuance had been fairly steady overall, averaging about 23 million newly issued cards each quarter between 2017-19. The onset of the pandemic caused a sharp retraction in new credit card issuance, with only 13 million cards issued in the second quarter of 2020. But by the second quarter of 2021, lending returned across all credit-score groups.
Subprime borrowers saw a surge in card issuance in 2021 and 2022, although this appears to have softened in the first half of 2023. By contrast, card issuance to borrowers with the highest credit scores— those over 760—expanded during first half of 2023. This relative tightening is consistent with other reports: The July 2023 Senior Loan Office Opinion Survey on Bank Lending Practices (SLOOS) described tightening standards for all consumer loan standards, and our June 2023 SCE Credit Access Survey showed an increase in credit application rejection rates, especially among those with lower credit scores.
Credit Card Issuance by Credit Score
Credit Card Delinquency
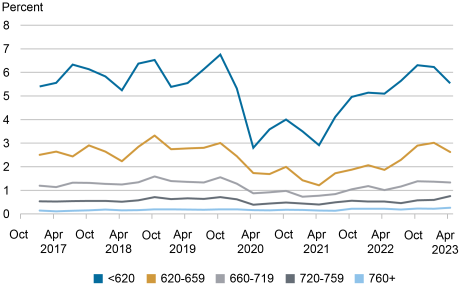
In February we wrote about increasing delinquency rates and our plan to continue to monitor the situation. Delinquency rates have now returned to pre-pandemic levels. In the chart below, we disaggregate transitions into delinquency by the borrower’s credit score at issuance. This picture is consistent with a return to pre-COVID trends after a stretch of unusually low delinquency rates during the pandemic when forbearance, policy-boosts to income, and limited consumption opportunities meant borrowers were better positioned to repay their debts. The two most recent quarters also appear to show some stabilization. Note that these rates differ from the transition rate calculated in our Quarterly Report because they are unsmoothed and use more detailed data.
Delinquency Rates Level Off
Transition into 30+ Days Delinquency
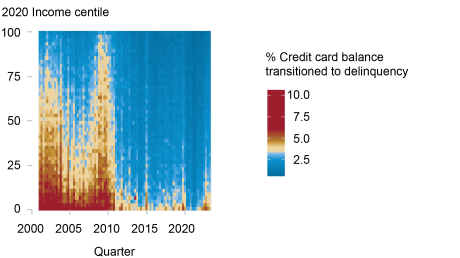
We finally consider debt performance by income, to determine whether aggregate statistics may be masking underlying economic challenges present in lower-income communities. We group borrowers using the average adjusted gross income of their zip code as a proxy for income, using data from the IRS (zip code income). In the heat map style chart below, we depict credit card delinquency aggregated by zip code income, which is shown on the y-axis, with the percentage of delinquency indicated by the color. Here, we first see that lower income areas have historically had higher delinquency rates, whereas higher income areas typically have better debt performance. But, before the Great Financial Crisis, credit card delinquencies were considerably more widespread, even in higher income areas, and rose even more between 2008-10. But now, after a brief period of unusually low delinquency between 2020-22, delinquency rates have normalized at pre-pandemic levels even in lower income areas.
Credit Card Delinquency by Zip Code Income
Despite the many headwinds American consumers have faced over the last year—higher interest rates, post-pandemic inflationary pressures, and the recent banking failures—there is little evidence of widespread financial distress for consumers. American consumers have so far withstood the economic difficulties of the pandemic and post-pandemic periods with resilience. However, rising balances may present challenges for some borrowers, and the resumption of student loan payments this fall may add additional financial strain for many student loan borrowers. Even so, thus far, household credit shows some early signs of stabilizing at pre-pandemic health, albeit with higher nominal balances.

Andrew F. Haughwout is interim director of research and head of Federal Reserve Bank of New York’s Research and Statistics Group.

Donghoon Lee is an economic research advisor in Consumer Behavior Studies in the Federal Reserve Bank of New York’s Research and Statistics Group.

Daniel Mangrum is a research economist in Household and Public Policy Research in the Federal Reserve Bank of New York’s Research and Statistics Group.

Joelle Scally is a regional economic advisor in the Federal Reserve Bank of New York’s Research and Statistics Group.

Wilbert van der Klaauw is an economic research advisor on Household and Public Policy Research in the Federal Reserve Bank of New York’s Research and Statistics Group.
How to cite this post:
Andrew Haughwout, Donghoon Lee, Daniel Mangrum, Joelle Scally, and Wilbert van der Klaauw, “Credit Card Markets Head Back to Normal after Pandemic Pause,” Federal Reserve Bank of New York Liberty Street Economics, August 8, 2023, https://libertystreeteconomics.newyorkfed.org/2023/08/credit-card-markets-head-back-to-normal-after-pandemic-pause/
BibTeX: View |


Center for Microeconomic Data
Disclaimer
The views expressed in this post are those of the author(s) and do not necessarily reflect the position of the Federal Reserve Bank of New York or the Federal Reserve System. Any errors or omissions are the responsibility of the author(s).
 RSS Feed
 Follow Liberty Street Economics
Thanks for the comment. The gap between the G.19 revolving credit data and the data we present here for credit cards owes primarily to the fact that credit card balances presented in our Quarterly Report on Household Debt & Credit exclude retail card balances, such as those issued by department stores. Retail cards are instead included in the ‘other’ category, lumped together with consumer finance loans and some other types of debt (including both installment and revolving). You will find that if you compare the quarterly percent changes or the quarterly differences (in dollar terms) that the series are quite similar despite being estimated using different source data.
The gap between the G19 and the 5% sample used here is pretty big in Q2… with the revolving credit in the consumer credit report rising much less on either an SA or NSA basis. I looked through the FAQs but the one G19 comparision answer did not seem relevent to the credit card and revolving credit differences in measurement. Any idea why such a large discrepency?