


While forecasters generally disagree about the expected path of monetary policy, the level of disagreement as measured in the New York Fed’s Survey of Primary Dealers (SPD) has increased substantially since 2022. For instance, the dispersion of expectations about the future path of the target federal funds rate (FFR) has widened significantly. What explains the current elevated disagreement in FFR forecasts?
One possible reason is that dealers’ policy rate forecasts are based on projections for other variables, such as inflation and unemployment, and their expectations for those variables have diverged. Another possibility is that the disagreement is about the way in which those macroeconomic variables affect the policy rate—the perceived “reaction function” of the policymaker. In this post, we investigate which is a better description of the data. Our results point toward the former explanation: Allowing macroeconomic outlooks to vary across SPD respondents, while keeping the coefficients of the perceived reaction function constant, is better at accounting for the widened cross section of policy rate forecasts.
Disagreement about the Future Path of Monetary Policy Has Increased
The dispersion of dealers’ expectations about the future path of the policy rate has widened substantially in recent surveys. The left panel of the chart below shows the level and range of expectations for the target FFR seven to nine quarters ahead, using data from the SPD. The blue solid line is the median FFR expectation across respondents, and the shaded areas illustrate the distance between the 90th and 10th percentiles. While dispersion fell during the pandemic in 2020-21, as dealers expected close-to-zero policy rates for some time, since 2022 it has increased to over 2 percentage points, the most in ten years.
Dispersion of Expectations Has Widened
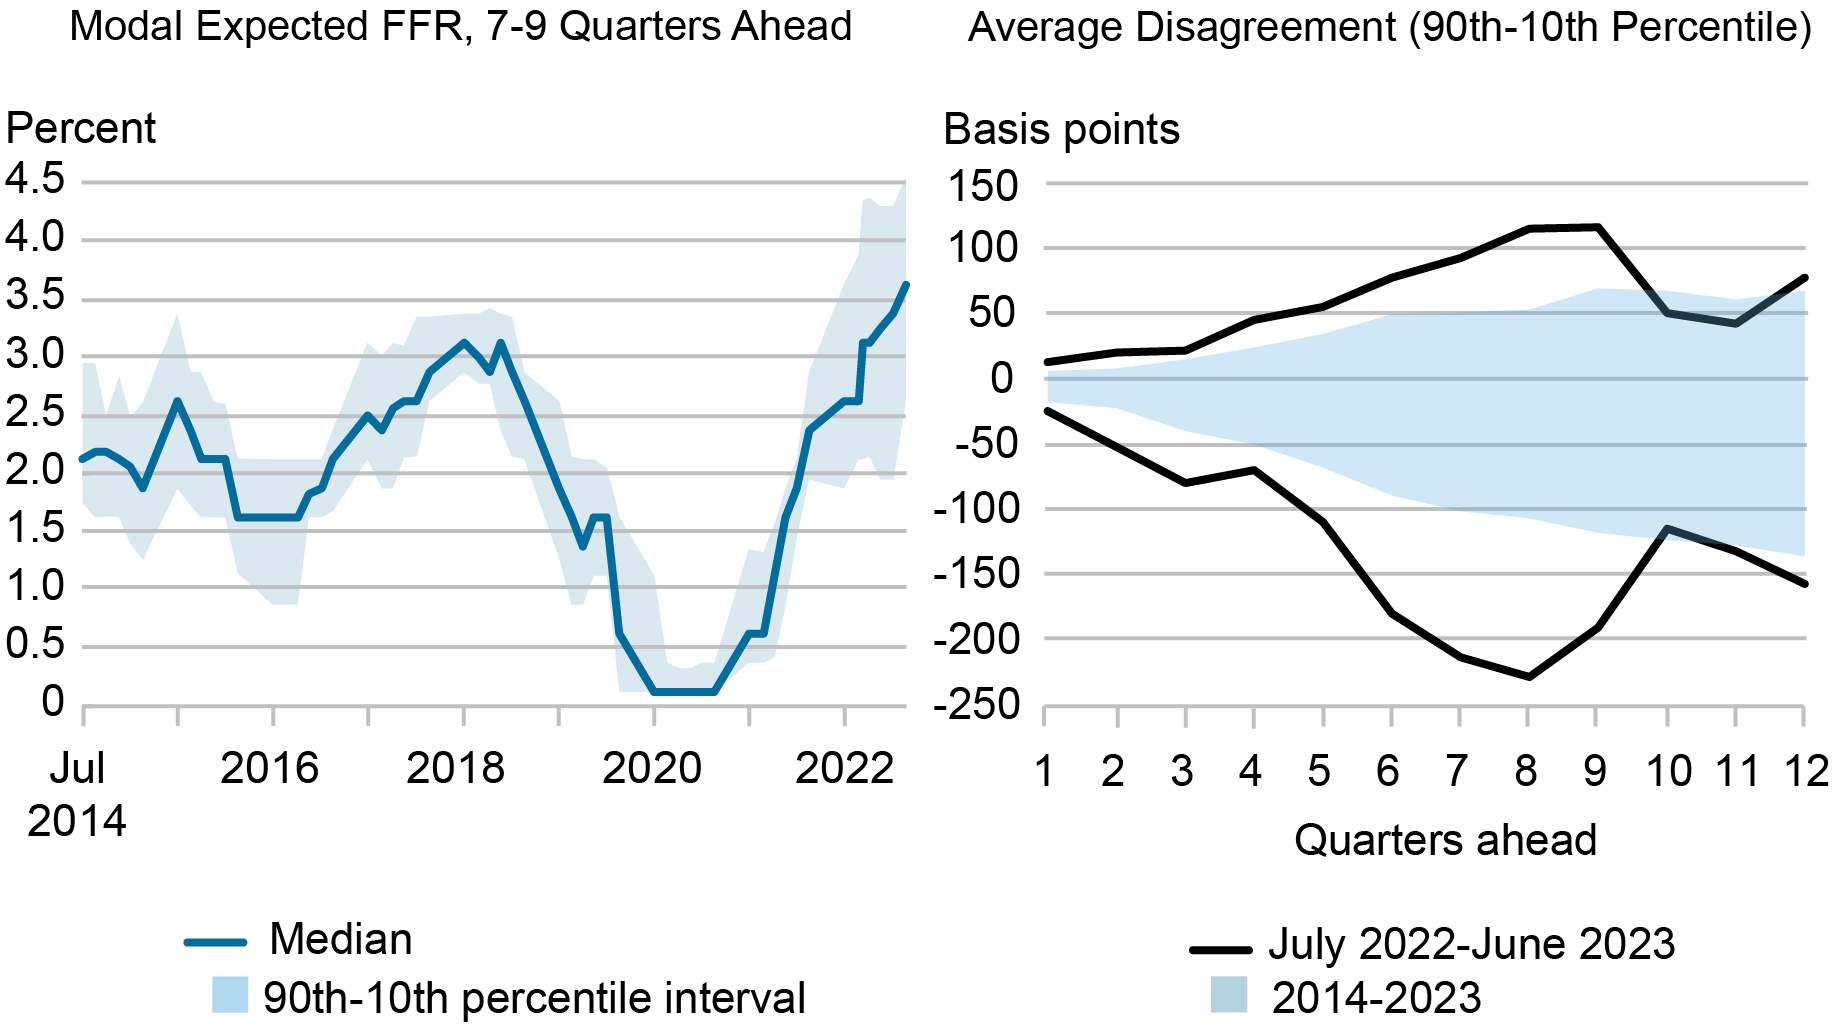
Sources: Authors’ calculations; Survey of Primary Dealers.
Notes: The left panel reports the median (line) and 90th-10th percentile range (shaded area) across survey respondents of the modal policy rate expectation seven, eight, or nine quarters ahead, by survey date. The data are from the Survey of Primary Dealers spanning the period July 2014–June 2023. FFR is federal funds rate. The right panel reports the mean distance between the 90th and 10th percentiles, by number of quarters ahead, for the full sample (shaded area) and for the recent sample (black lines).
The right panel of the chart highlights the level of disagreement relative to its historical norm, and shows that over the past year it has been pronounced across multiple horizons. For expectations eight quarters ahead collected since July 2022, the 90th and 10th percentiles have been on average 3.5 percentage points apart, or more than twice the distance in the historical sample.
Disentangling Differences in Economic Outlooks vs. Perceptions of Monetary Policy Rules
In our analysis, we assume that survey respondents implicitly use a Taylor rule in forming policy rate expectations. In essence, we posit that the expected policy rate for a given horizon is equal to the sum of its long-run expected value and the contributions of core PCE (personal consumption expenditures) inflation and unemployment, for that same horizon, weighted by their respective reaction function parameters. We re-estimate the reaction function parameters over time, allowing for changes in respondents’ perceptions, but those parameters are assumed to be uniform across horizons (three to twelve quarters ahead) within a survey sample. To strike a balance between time variation and sample size, we use rolling samples that include three surveys each.
Our approach follows a vast academic literature that employs linear regressions to estimate Taylor rule–like monetary policy rules; see, for instance, Bernanke (2015), Carvalho and Nechio (2014), and Bauer, Pflueger, and Sunderam (2022). It’s important to note that, because of the inherent codependence of expected policy rates and expected macroeconomic outlooks, linear regression estimates should be interpreted as the co-movement perceived by forecasters between the policy rate and the macroeconomic variables considered, rather than as causal relationships. That said, despite the endogeneity problem, Carvalho, Nechio, and Tristão (2021) find support for using ordinary regressions.
To gauge whether differing macroeconomic outlooks or policy rule perceptions better account for the observed dispersion in FFR expectations, we conduct two empirical experiments.
Experiment #1: Common Policy Rules, Varying Economic Outlooks (CR-VO): We estimate the common set of Taylor rule parameters that best fits the panel data (the pooled estimation), and then we use the dealer-specific expectations for inflation and unemployment (including the individual long-run expectations) to predict policy rate expectations. This experiment answers the counterfactual question: What would the cross section of dealers’ expectations be if they all used the same Taylor rule parameters but not the same macroeconomic outlooks?
Experiment #2: Varying Policy Rules, Common Economic Outlooks (VR-CO): We estimate the set of Taylor rule parameters that best fits each individual dealer’s data, and then, holding those estimated individual policy rule parameters constant, we impose common (median) expectations for inflation and unemployment across respondents. This experiment answers the counterfactual question: What would dealers’ expectations be if they all agreed on their macro expectations but had different views about the policy rule?
The closest precedent to these experiments is Carlstrom and Jacobson (2015), although their analysis relies on data from the Survey of Professional Forecasters from 1995-2008.
Dealers Agree on the Policy Rule, Disagree on the Economic Outlook
Since we are especially interested in the recent increase in disagreement, we focus on the forecasts for year-end 2023 and 2024, as reported by surveys conducted since July 2020. We show year-end 2024 forecasts in the chart below. In both panels, the red solid line and shaded region show the observed median expectations and the 90th–10th percentile band. The blue solid line and shaded areas show the corresponding percentiles for the two experiments.
CR-VO Experiment Better Matches Actual Forecast Distributions
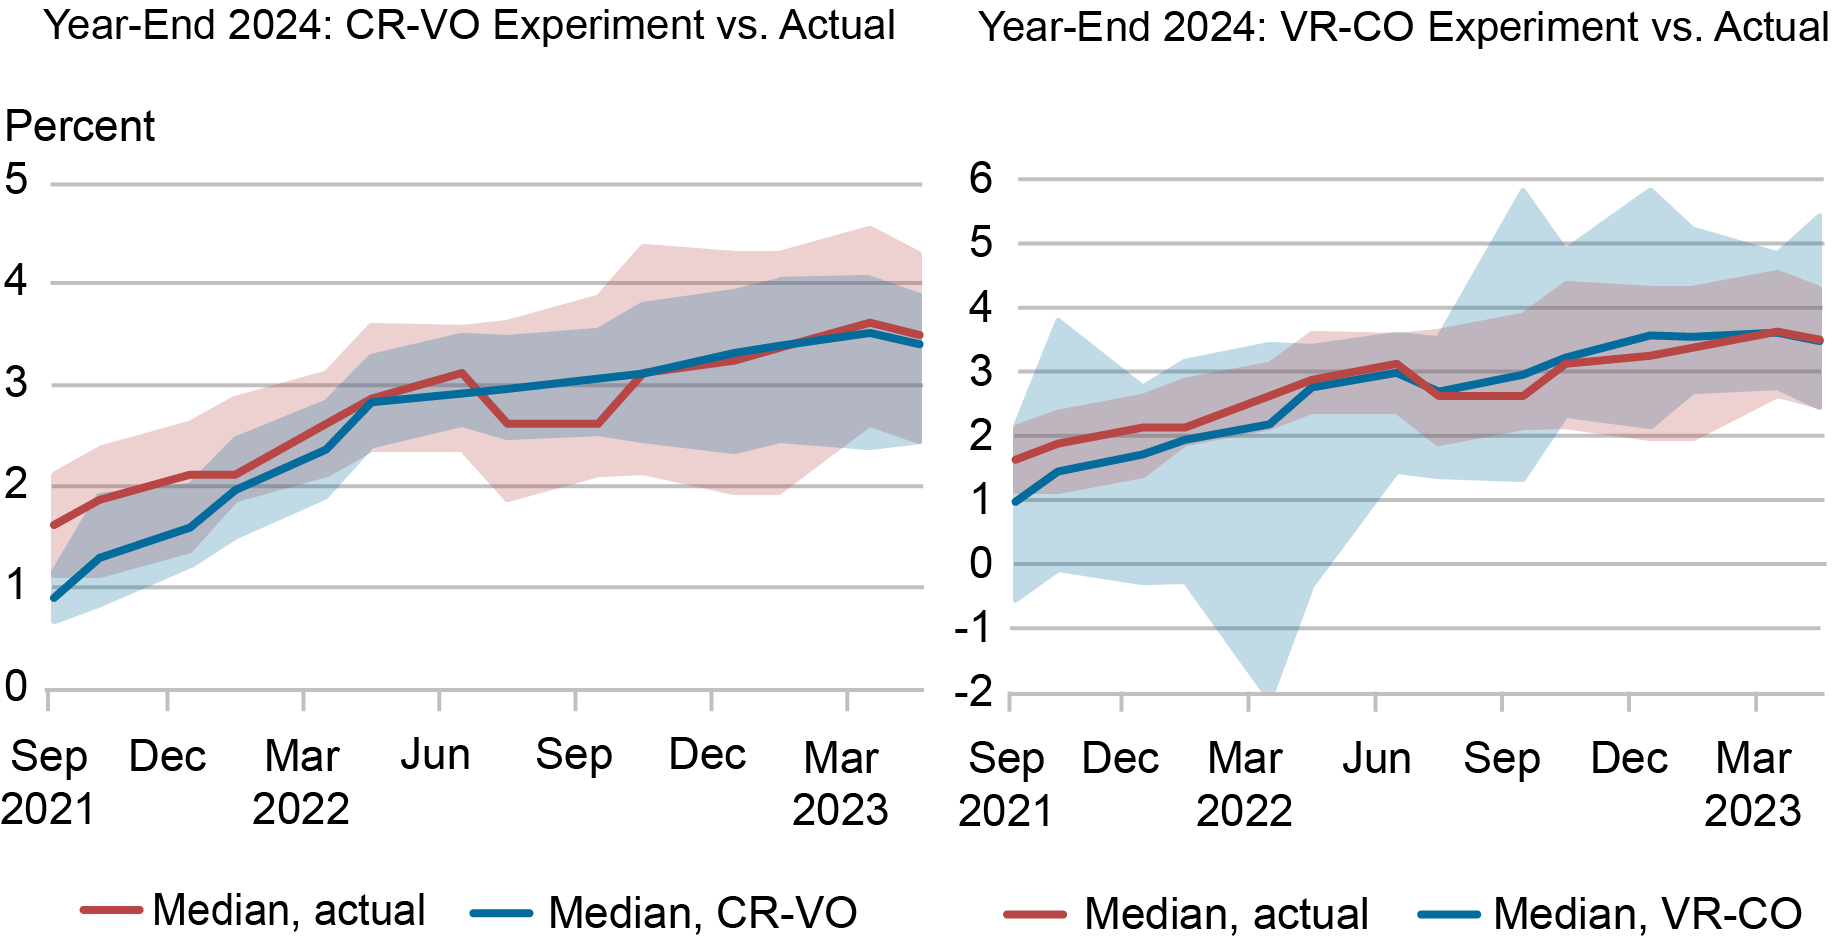
Sources: Authors’ calculations; Survey of Primary Dealers.
Note: The panels show the actual and predicted distributions (10th, 50th, 90th percentiles) under the assumptions of constant parameters and varying outlooks (CR-VO) across survey respondents, versus constant outlooks and varying parameters (VR-CO), for year-end 2024.
The chart illustrates the central findings. The dispersion of policy rate expectations implied by experiment CR-VO better overlaps with the dispersion of actual forecasts. The dispersion of expectations implied by experiment VR-CO, on the other hand, is in general much larger than the dispersion of observed expectations. Thus, the counterfactual scenario in which dealers hold a common view about the policymaker’s reaction function but disagree on the economic outlook fits the observed data better than the alternative. We observe a similar pattern when looking at year-end 2023 forecasts.
To some extent, this finding is not surprising, as dealer-specific reaction function parameters are estimated from small samples and therefore one would expect the cross-sectional dispersion to be wide. However, the expectations fitted by experiment VR-CO are unable to match the increased disagreement that we observe in actual expectations in recent times.
Consider again the chart above: while the actual 90th–10th percentile range of the policy rate increases from 1 percentage point to 2.4 percentage points between January 2022 and December 2022 (when peak disagreement is reached), disagreement assuming uniform macro outlooks (and varying reaction function parameters) increases marginally, from 3.5 percentage points to 3.7 percentage points, while disagreement assuming uniform reaction parameters (and varying outlooks) rises from 1 percentage point to 1.6 percentage points.
To quantify the relative fit of the common policy rule versus common economic outlook explanations, the chart below shows the mean absolute error (MAE) of experiments CR-VO and VR-CO, pooled across respondents and horizons, for each survey.
Mean Absolute Error Is Lower for CR-VO Experiment
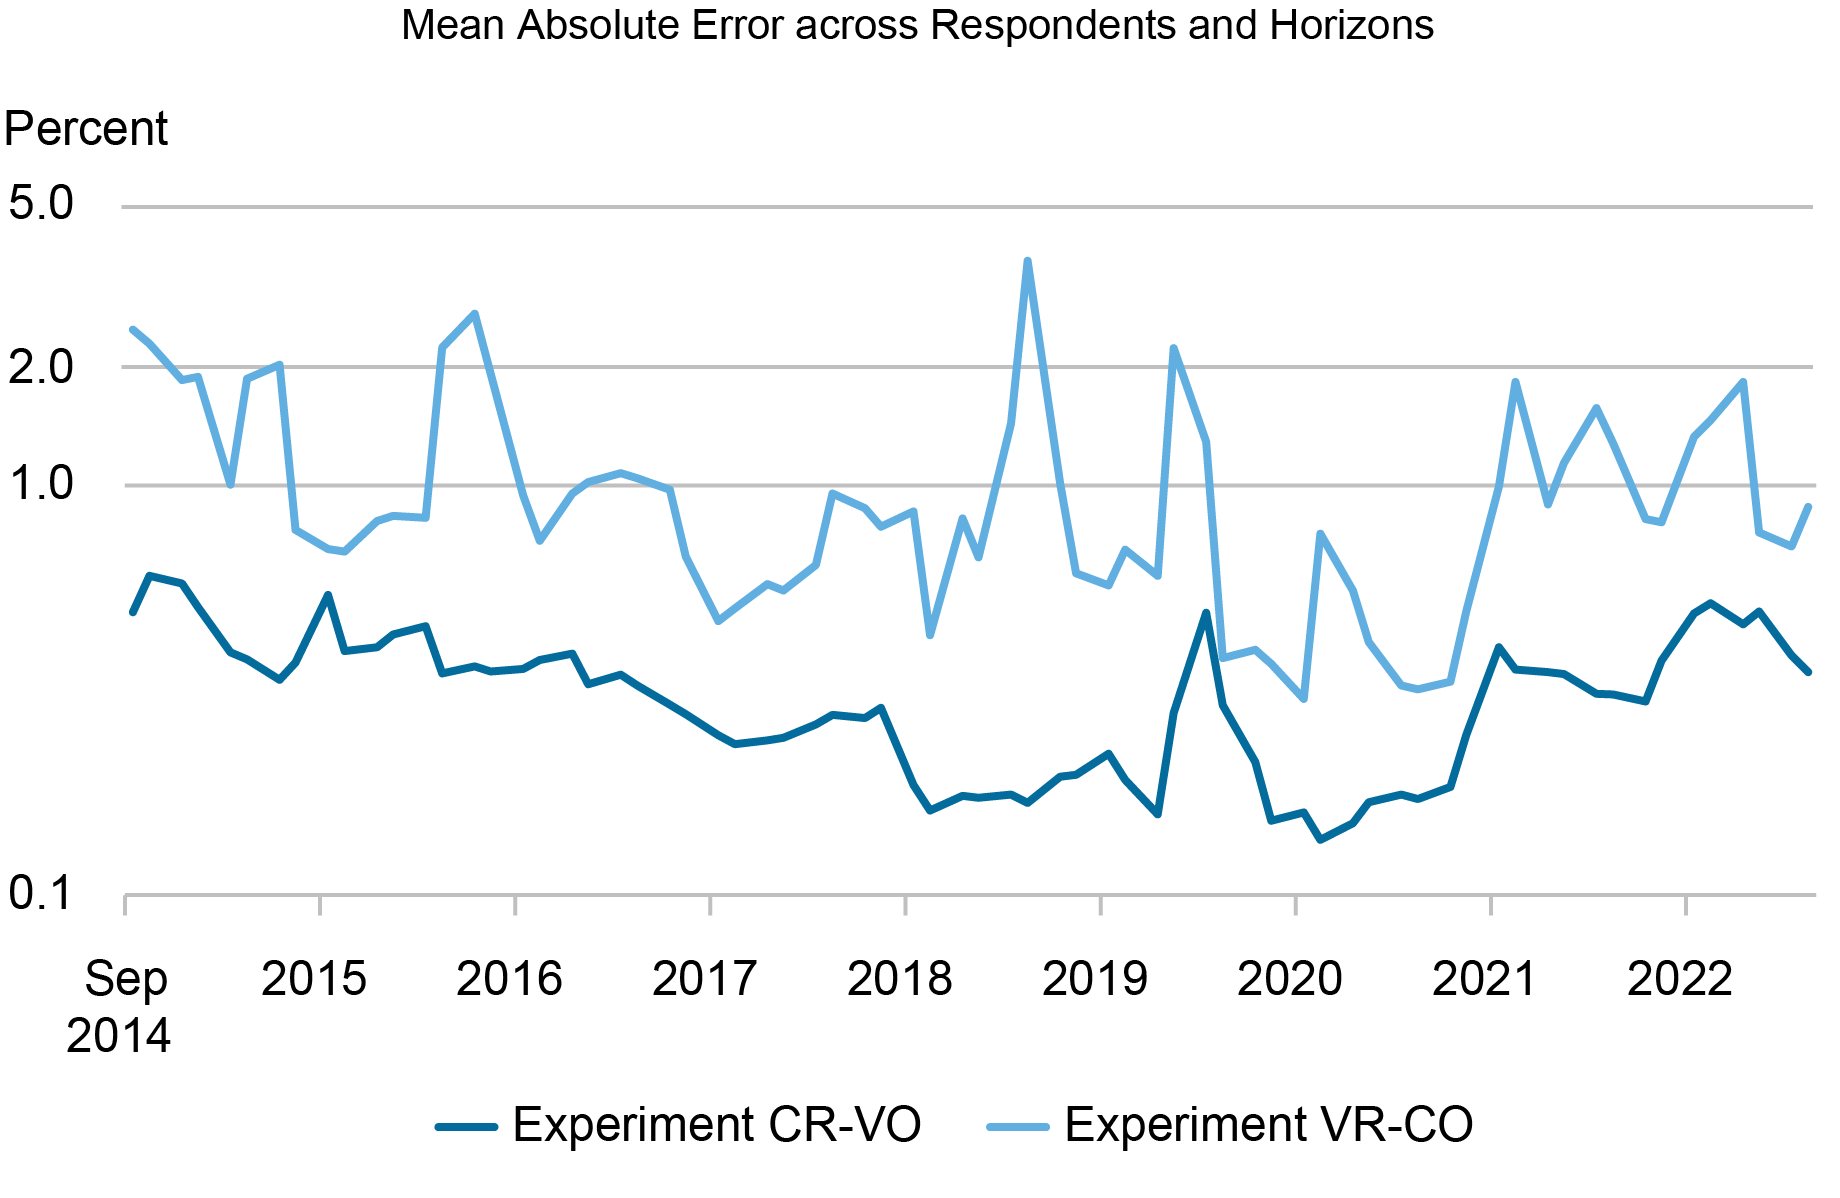
Sources: Authors’ calculations; Survey of Primary Dealers.
Notes: The chart reports the mean absolute error between actual forecasts and the fitted forecasts, for each survey date, produced assuming common coefficients and varying outlooks (CR-VO) and assuming varying coefficients and common outlooks (VR-CO). The y-axis is in logarithmic scale.
A lower MAE implies a better-fitting model, which is the case for the series computed for the experiment with common policy rules and varying outlooks for every survey in our sample. The average errors produced by experiment CR-VO are smaller than those for VR-CO by a large margin (notice the log scale). In recent months, the relative and absolute MAEs of the two experiments are roughly within the historical norm. In addition, note that both series increase during periods associated with policy uncertainty: the start of the 2020 pandemic and in the recent period of elevated inflation. However, the swings in the MAE implied by the common-outlooks experiment are larger.
Conclusion
Dealers’ expectations for the monetary policy path have diverged in recent times. Given uncertainty about how the Federal Open Market Committee (FOMC) would respond to a historically rare combination of persistently high inflation and low unemployment, one might expect dealers’ disagreement to stem at least in part from divergent views on the Federal Reserve’s reaction function. We find, however, that it is the economic outlook that accounts for the lion’s share of the increased disagreement.
At the time the research in this post was conducted, Arunima Sinha was an associate professor of economics at Fordham University and a visiting scholar in the Federal Reserve Bank of New York’s Markets Group.

Giorgio Topa is an economic research advisor in Labor and Product Market Studies in the Federal Reserve Bank of New York’s Research and Statistics Group.

Francisco Torralba is a policy and market analysis principal in the Federal Reserve Bank of New York’s Markets Group.
How to cite this post:
Arunima Sinha, Giorgio Topa, and Francisco Torralba, “Why Do Forecasters Disagree about Their Monetary Policy Expectations?,” Federal Reserve Bank of New York Liberty Street Economics, August 2, 2023, https://libertystreeteconomics.newyorkfed.org/2023/08/why-do-forecasters-disagree-about-their-monetary-policy-expectations/
BibTeX: View |
Disclaimer
The views expressed in this post are those of the author(s) and do not necessarily reflect the position of the Federal Reserve Bank of New York or the Federal Reserve System. Any errors or omissions are the responsibility of the author(s).
 RSS Feed
 Follow Liberty Street Economics
Thanks for your post. As a lawyer it has been a while since taking econometrics. This post provided well needed insights on forecasting. Again, thank you.