


The recent rise in price pressures around the world has reignited interest in understanding how inflation transmits to the real economy. Economists have long recognized that unexpected surges of inflation can redistribute wealth from creditors to debtors when debt contracts are written in nominal terms (see, for example, Fisher 1933). If debtors are financially constrained, this redistribution can affect real economic activity by relaxing financing constraints. This mechanism, which we call the debt-inflation channel, is well understood theoretically (for example, Gomes, Jermann, and Schmid 2016), but there is limited empirical evidence to substantiate it. In this post, we discuss new insights from one of the key events in monetary history: the Great German Inflation of 1919-23. Because this case of inflation was both surprising and extremely high, Germany’s experience helps shed light on how high inflation impacts firms’ economic activity through the erosion of their nominal debt burdens. These insights are based on a recently released research paper.
The German (Hyper)inflation
Germany’s bout of hyperinflation is a defining event in monetary history. From a value of 4.2 per dollar on the eve of World War I, the mark depreciated to 4.2 trillion per dollar by November 1923. This episode has fascinated generations of economists, who have studied it to understand both the causes and consequences of high inflation.
Germany’s inflationary spiral can be divided into two distinct phases. The chart below shows that evolution of the price level for both wholesale prices and the cost-of-living index. The first phase of the inflation, from November 1918 to June 1922, brought a substantial rise in the price level due to various factors, including deficit-financed war spending, massive World War I reparations, and political unwillingness to raise taxes and cut spending. The absence of a proactive central bank response exacerbated the inflation. Notably, data on the forward exchange premium and anecdotal evidence of foreign speculators betting on an appreciation of the mark suggest that inflation was largely unexpected during this phase. The second phase, from July 1922 to November 1923, was the hyperinflation phase. This phase begins after political turmoil over World War I reparations and the assassination of Walther Rathenau, the country’s prominent foreign minister. Hyperinflation is characterized by uncontrollable price increases and unanchored inflation expectations.
The Price Level during Germany’s Inflation
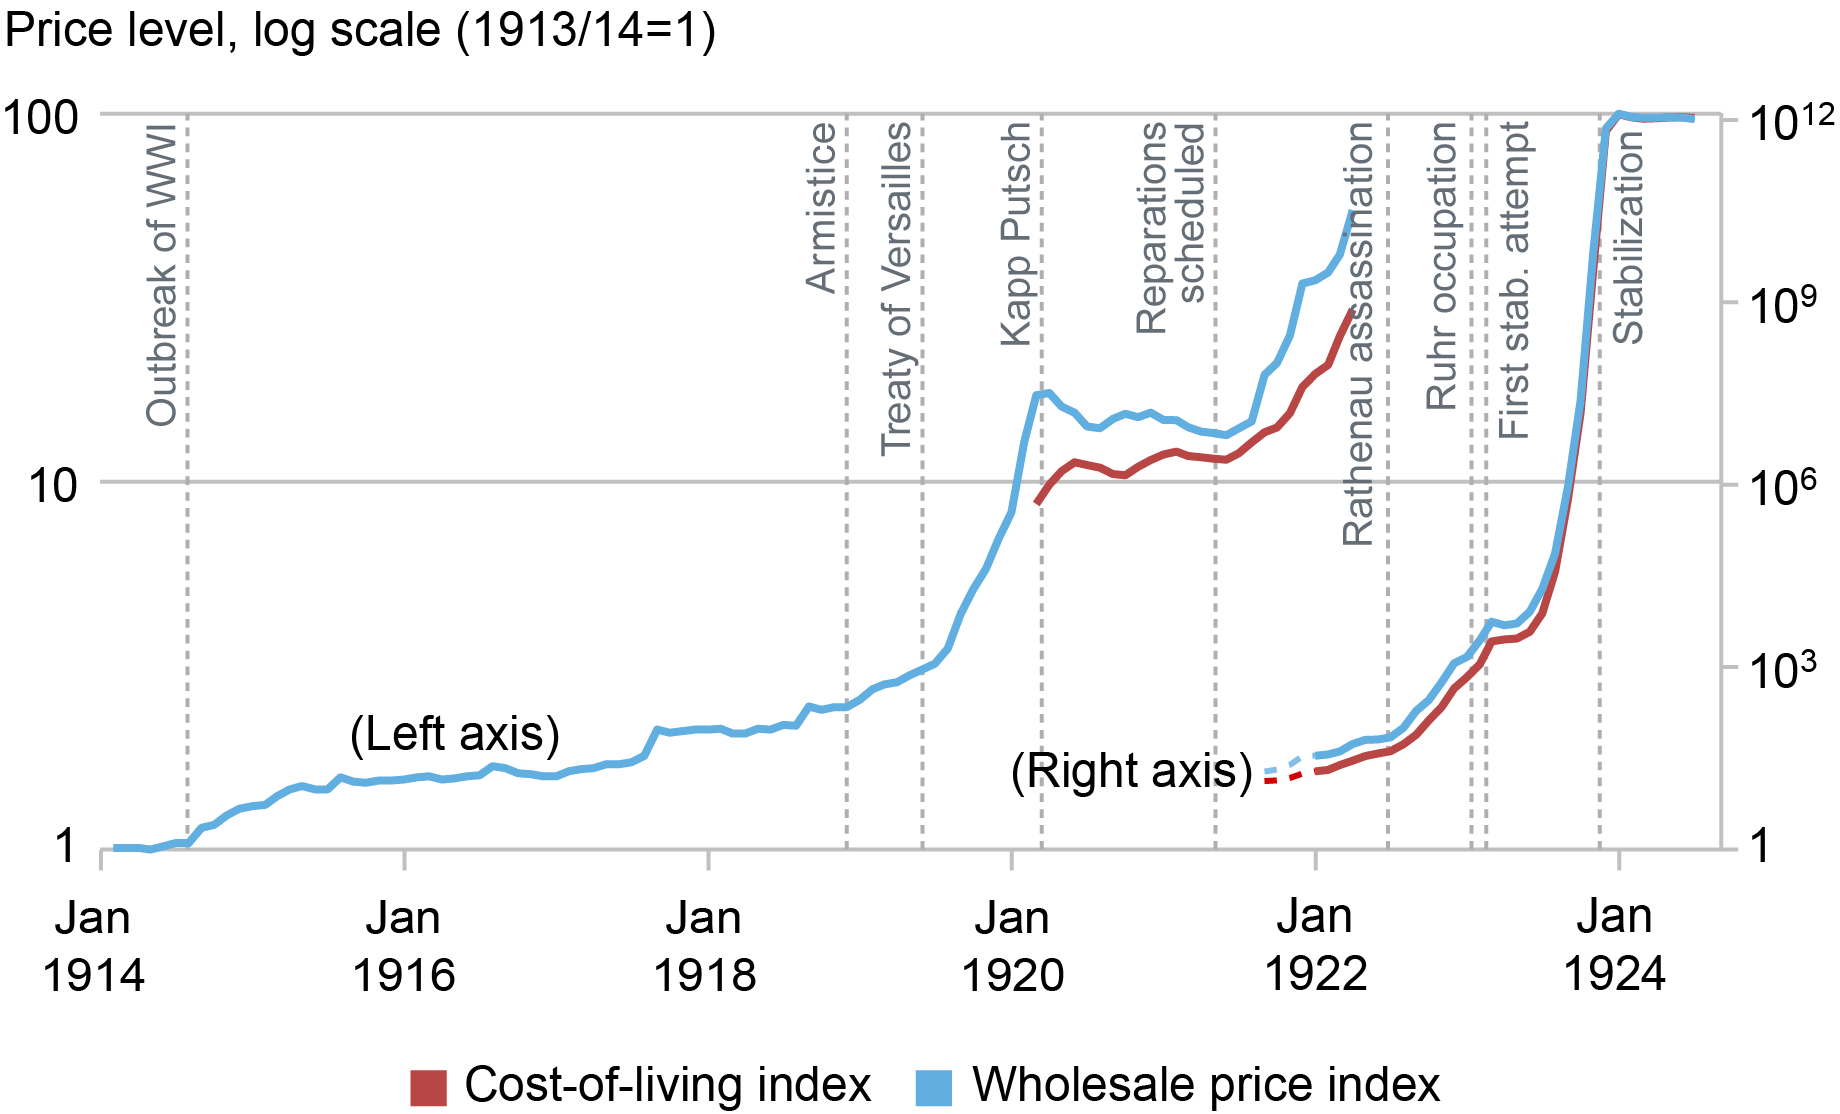
Source: The wholesale price index (Gesamtindex der Grosshandelspreise) and cost-of-living index (Lebenshaltung insgesamt) are from Zahlen zur Geldentwertung in Deutschland von 1914 bis 1923.
Notes: This chart shows the evolution of the price level in Germany between January 1914 and June 1924. The cost-of-living index only available from February 1920 onwards. Due to the extreme changes in price levels, prices are reported in logarithms and over two axes, with the first phase of the inflation on the left axis and the second phase on the right axis.
Germany’s inflation was associated with a booming economy from 1919 through the middle of 1922, followed by a severe bust starting at the end of 1922. The chart below plots an index of annual real GDP per capita for Germany starting in 1918. For comparison, we also plot an index of average real GDP per capita growth for other major industrial economies. While those economies experienced declining output from tight monetary conditions, Germany’s real GDP per capita rose by 20 percent from 1919 to 1922. Further, unemployment was low from the end of WWI until the last months of 1922. Germany’s boom slows with the hyperinflation in the second half of 1922 and decisively reverses in early 1923, following the invasion of the Ruhr industrial region by France and Belgium. In 1923, Germany saw a large fall in real GDP, and unemployment rose to nearly 30 percent.
Real GDP in Germany and Other Major Economies, 1918-27
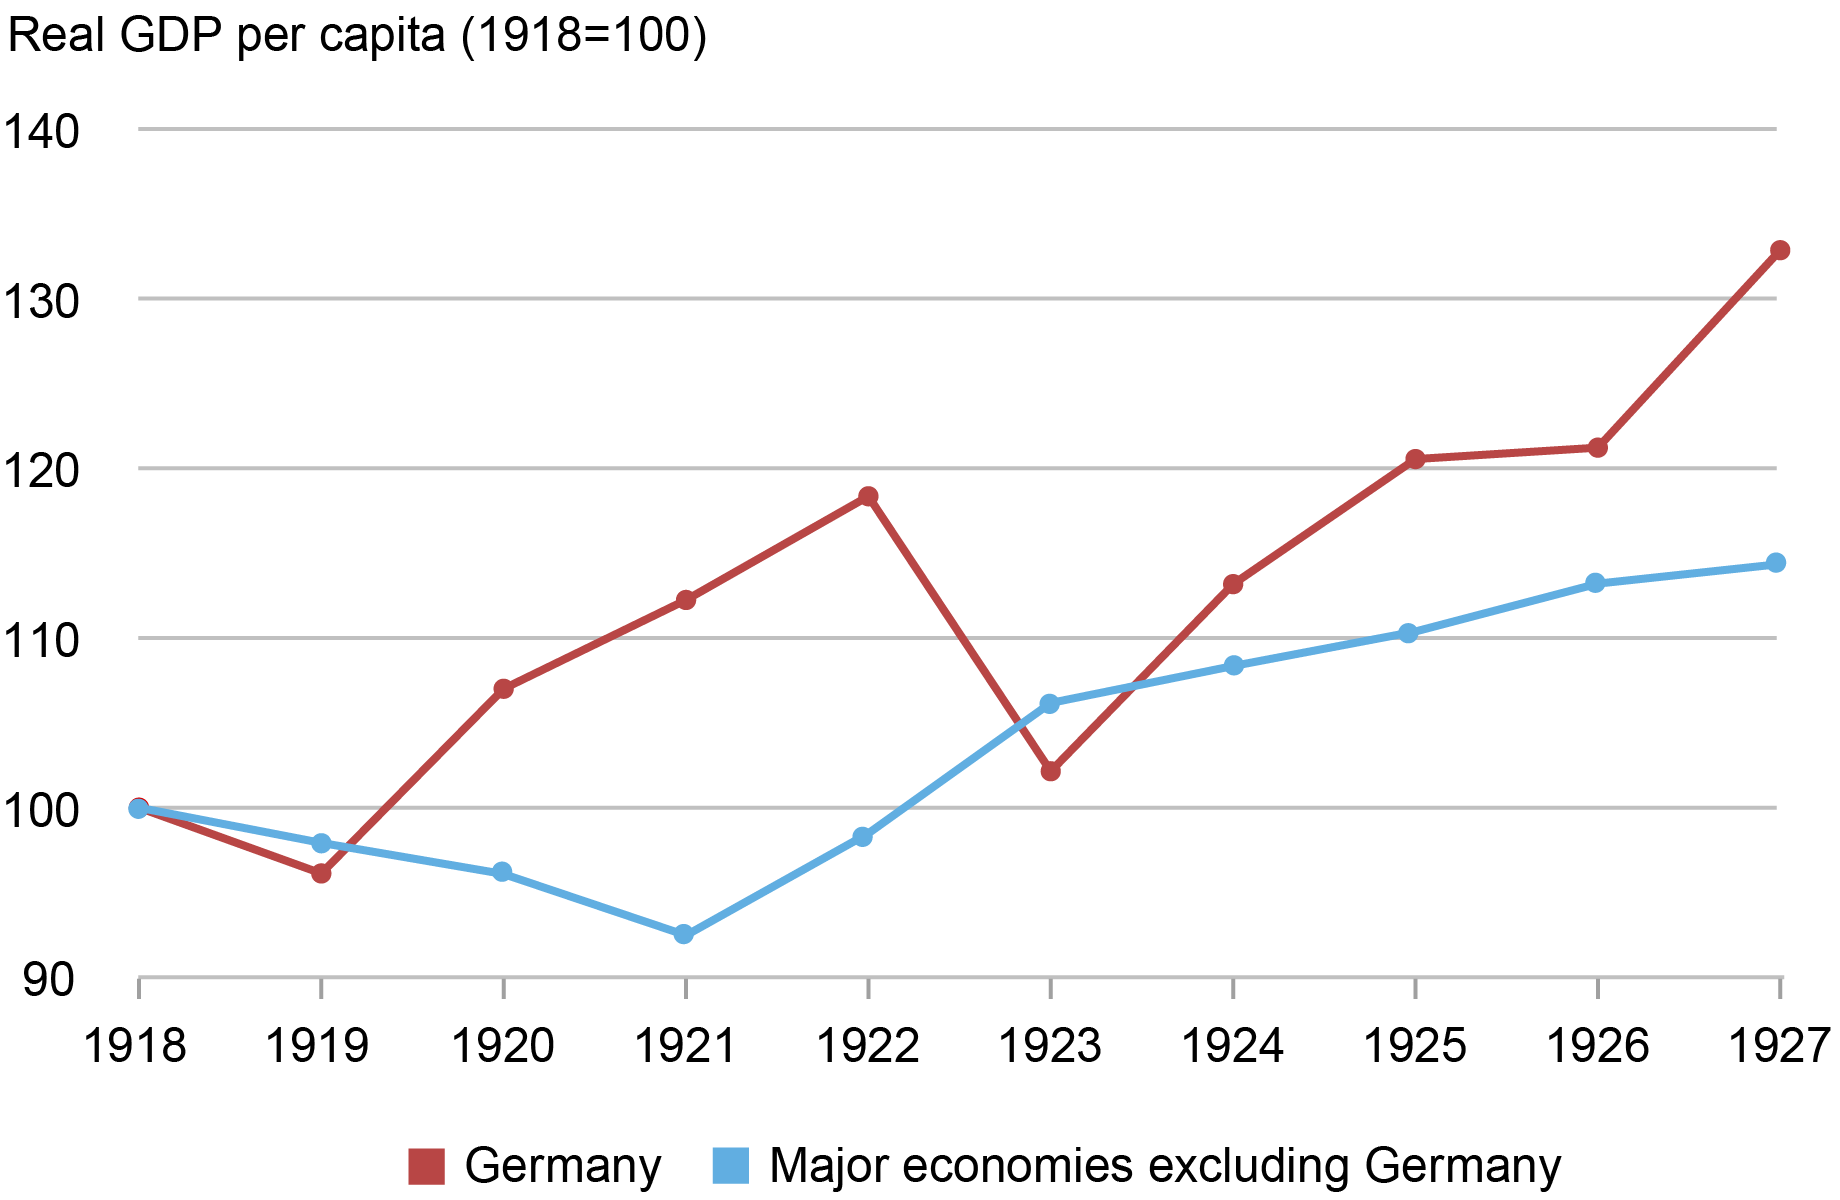
Sources: Jordà et al. (2017); Barro and Ursúa (2008).
Notes: This chart shows real GDP per capita for Germany and an index of other major economies. The series are indexed to 100 in 1918. “Major economies excluding Germany” is an index of average real GDP growth per capita, weighted by lagged nominal GDP in U.S. dollars. The index is constructed using 15 countries with continuous coverage in the Jordà et al. (2017) database between 1914 and 1927 (Australia, Belgium, Canada, Denmark, Finland, France, Italy, Japan, Norway, Portugal, Spain, Sweden, Switzerland, the U.K., and the U.S.).
Empirical Evidence of the Debt-Inflation Channel
What are the macro-financial implications of inflation? To explore the empirical relevance of the debt-inflation channel, we construct a new firm-level database by digitizing a contemporary investor’s manual with information on firms’ financial statements and employment. The data cover approximately 700 nonfinancial joint-stock firms in Germany. These data reveal that inflation massively devalued firms’ liabilities, resulting in a collapse in firm leverage (defined as the ratio of nominal liabilities to assets). The chart below shows that leverage fell by over 50 percent between the start of the inflation in 1919 and the aftermath of the inflation in 1924.
Inflation Wiped Out Firm Leverage
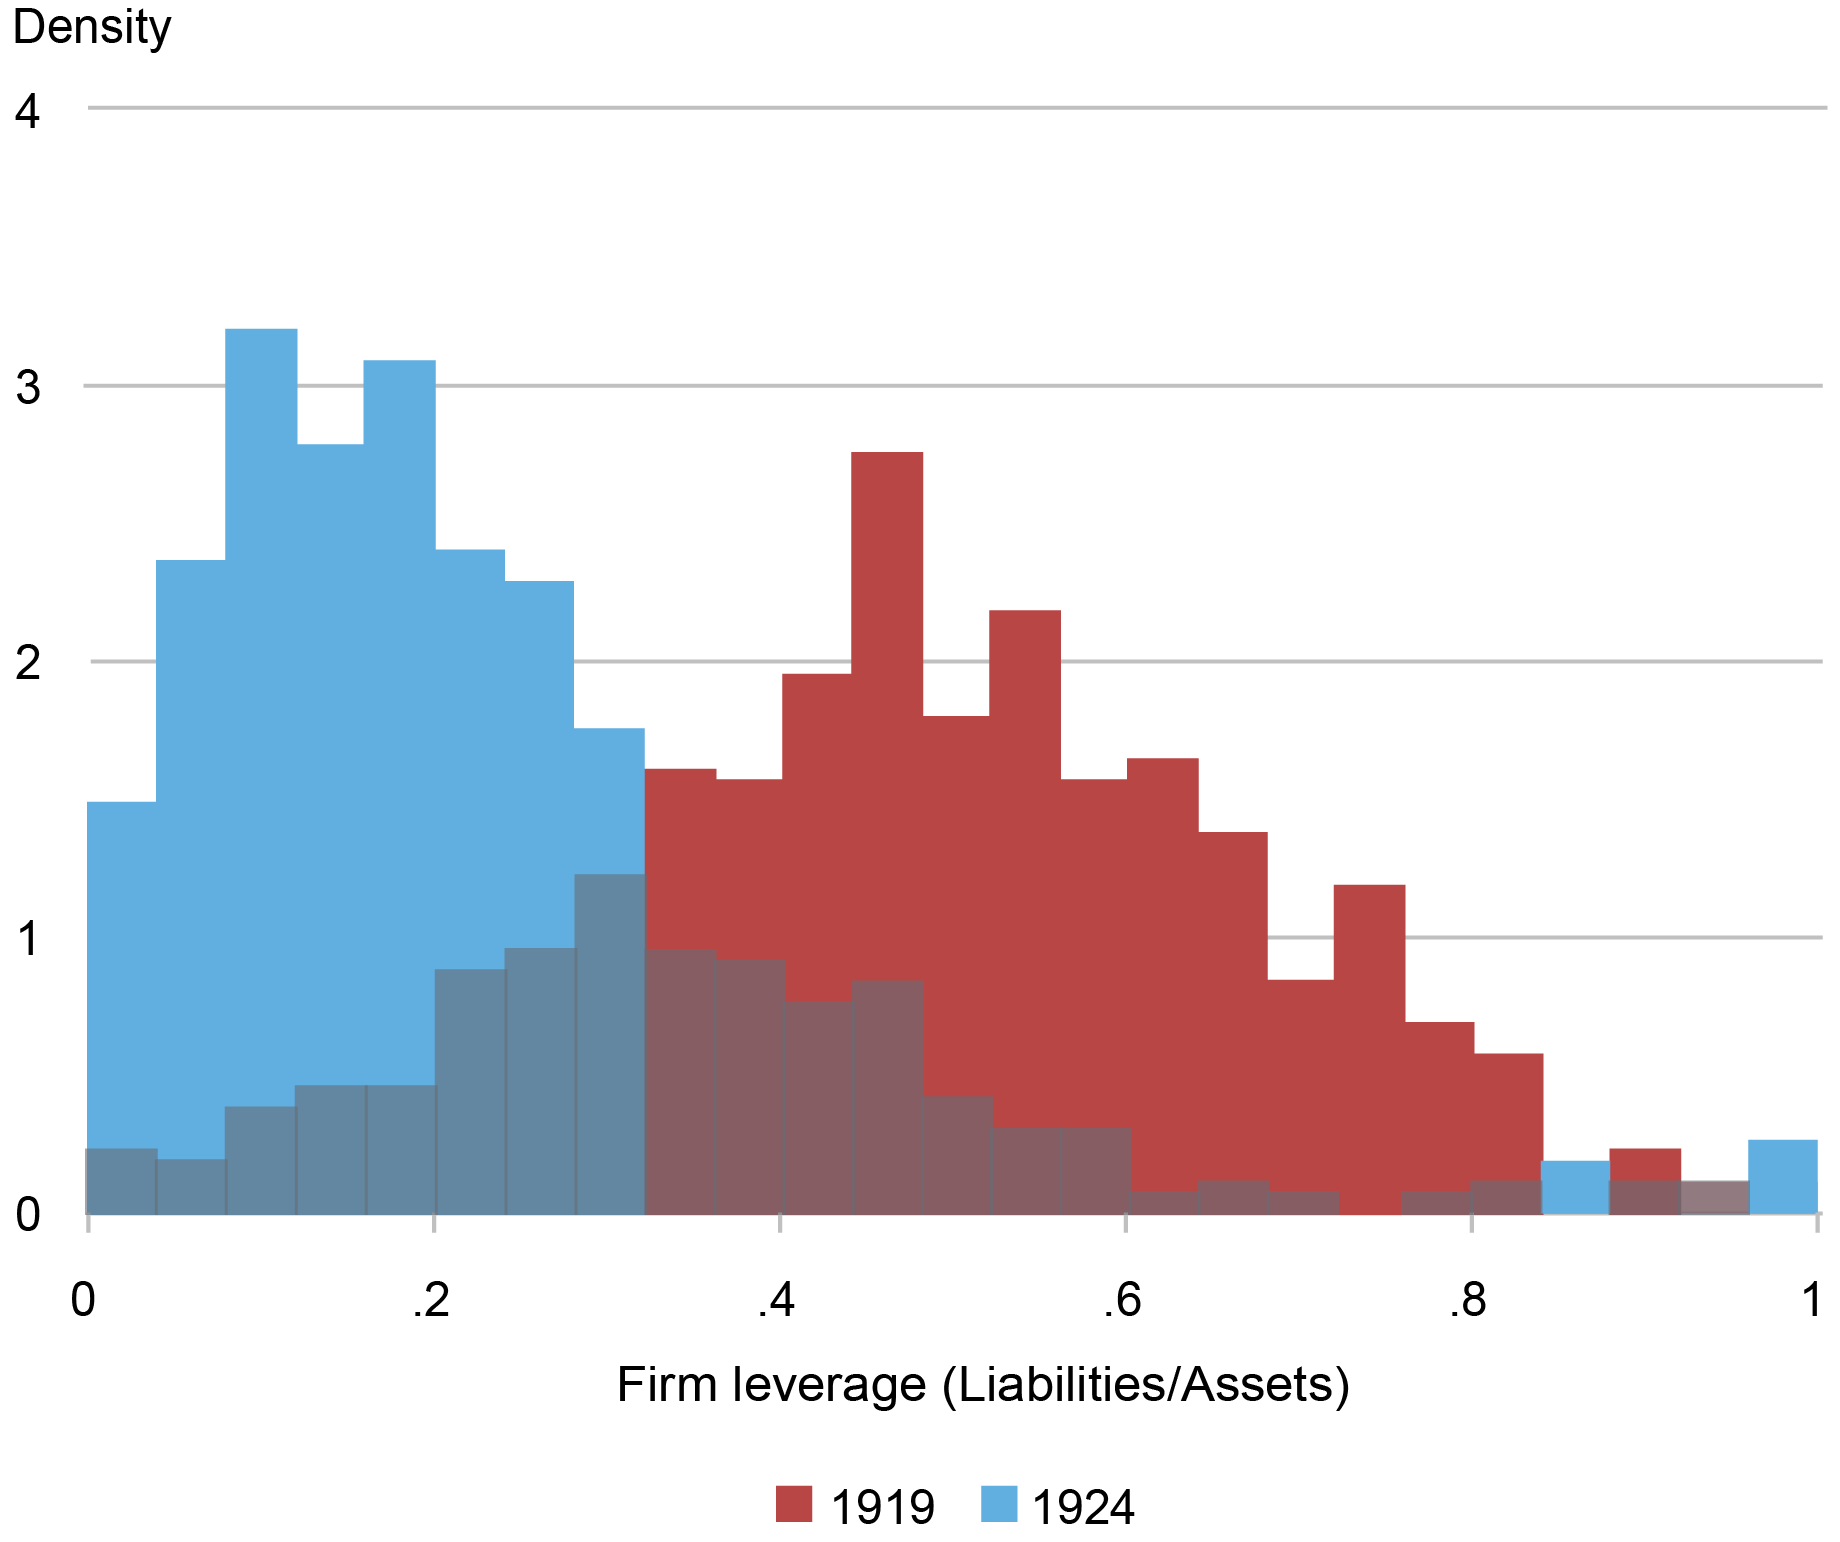
Source: Saling’s Börsen-Jahrbuch.
Notes: This chart shows the distribution of firm book leverage (liabilities-to-assets) at the start of the postwar inflation in 1919 and in the aftermath of the hyperinflation in 1924.
The reduction in firms’ nominal liabilities significantly reduced the likelihood of financial distress for firms in Germany. The next chart plots bankruptcies against inflation, revealing a strong negative relation between the two variables. Bankruptcies consistently declined with rising inflation and remained at historically low levels, even with the economic tumult of 1923. The sharpest declines in bankruptcies happened in the first phase of high inflation, before the hyperinflation in 1922-23. During the hyperinflation, additional inflation only slightly reduced bankruptcies. Intuitively, once the price level has doubled several times within a few years, debts have already been wiped out, making bankruptcy increasingly unlikely.
Inflation and Firm Bankruptcies
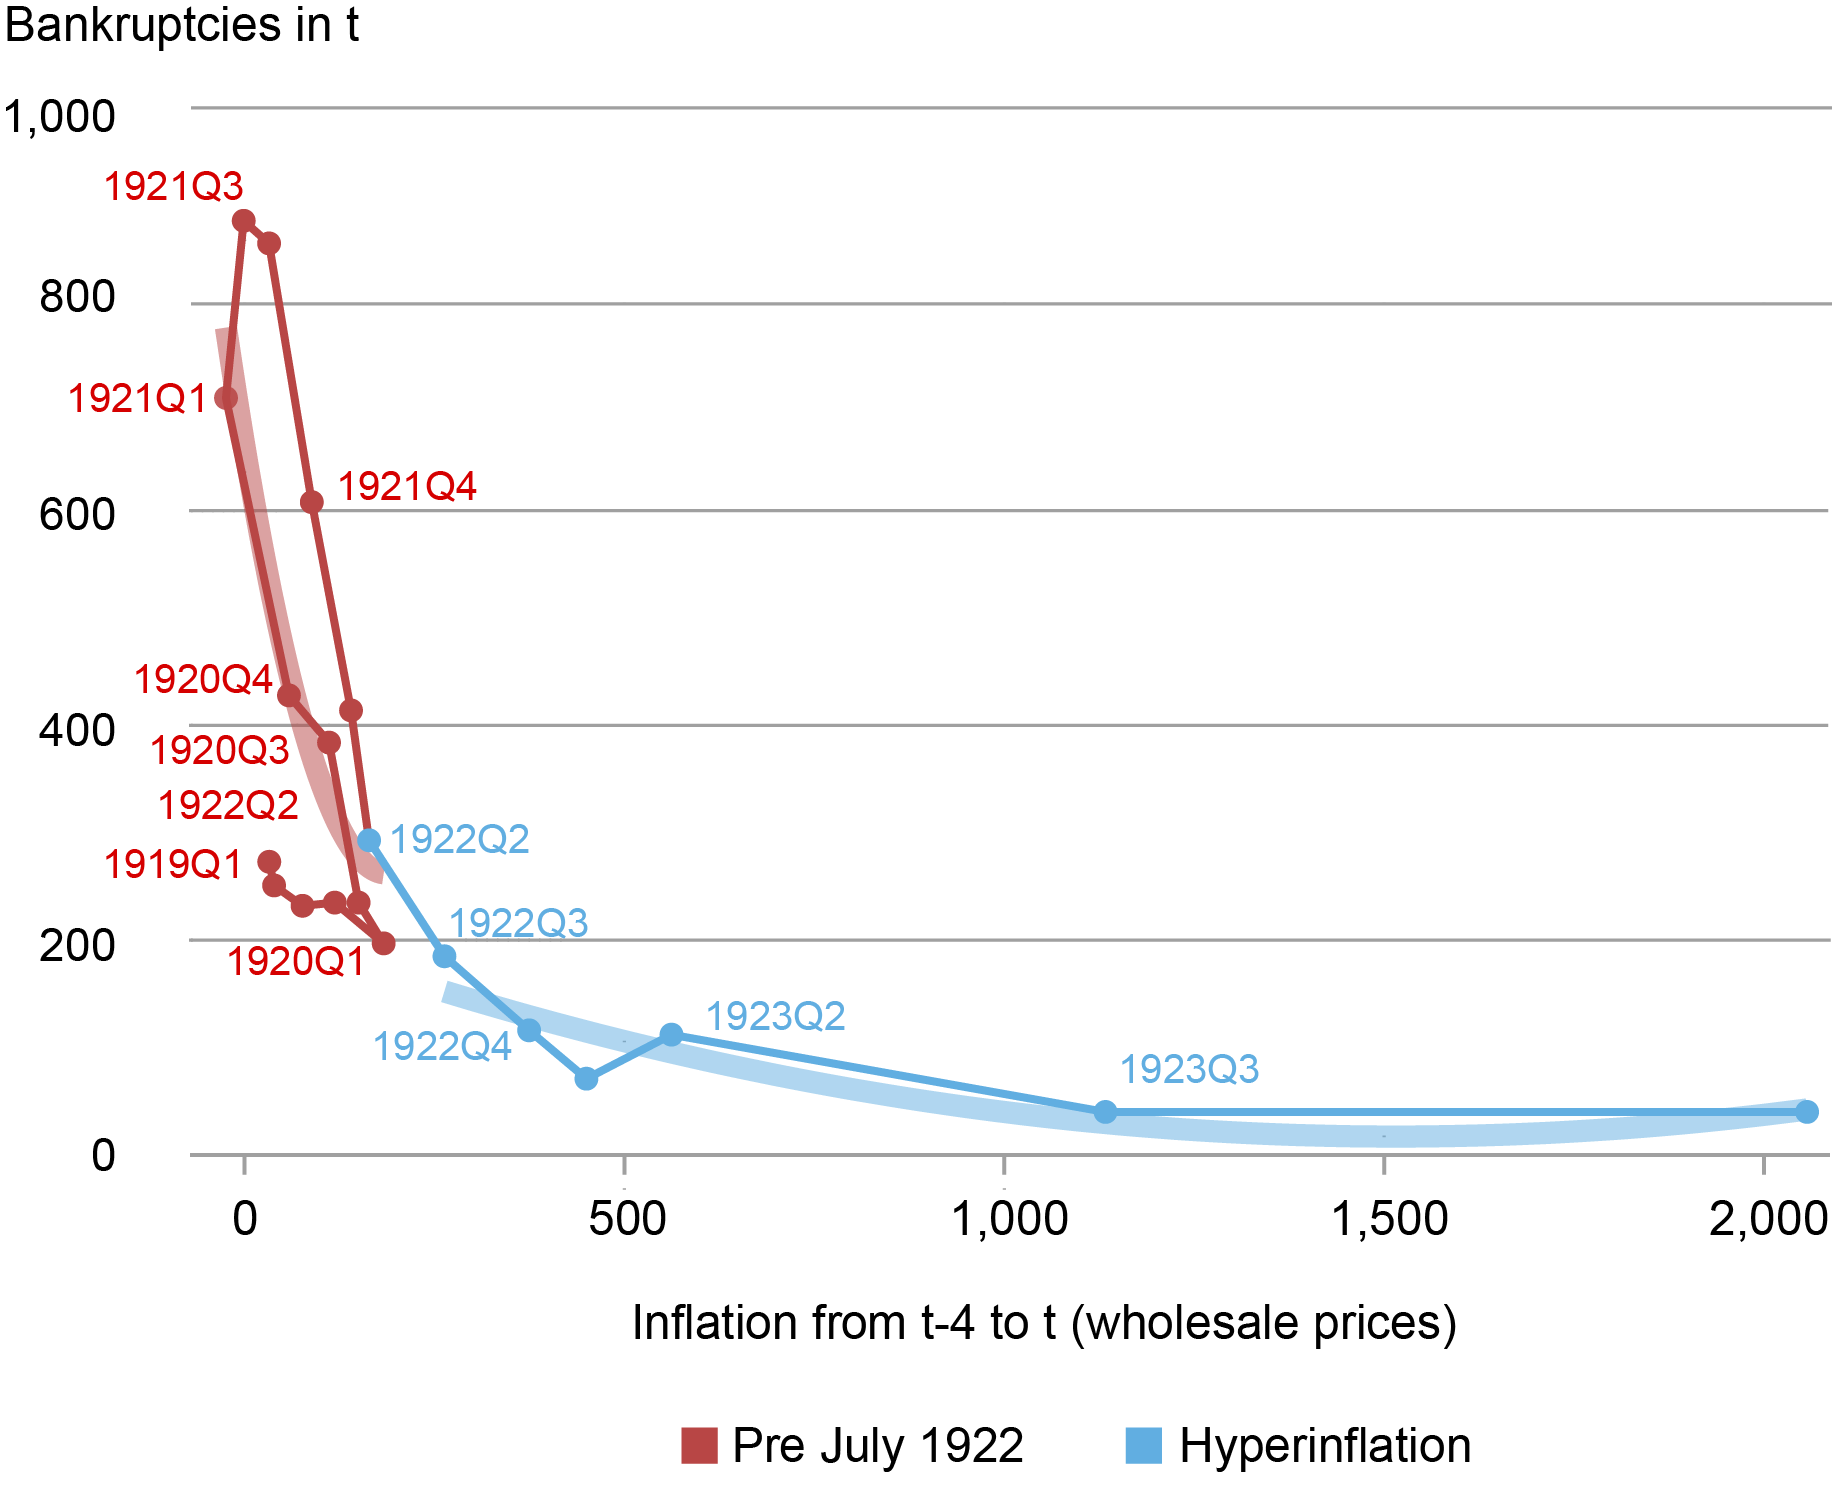
Sources: Vierteljahrshefte zur Statistik des Deutschen Reichs Herausgegeben vom Statistischen Reichsamt; Zahlen zur Geldentwertung.
Notes: This chart plots the number of firm bankruptcies in quarter t against realized inflation over the past four quarters from t − 4 to t. Inflation is calculated as the log change (times 100). Quarterly counts of firm bankruptcies are obtained from the Vierteljahrshefte zur Statistik des Deutschen Reichs Herausgegeben vom Statistischen Reichsamt. Inflation of wholesale prices as reported in Zahlen zur Geldentwertung. The thick lines represent quadratic fits, computed separately for each of the two stages of inflation.
To understand the impact of inflation on real economic activity at the firm level, we examine the cross-section of firms based on their leverage prior to the inflationary shock. Firms with higher leverage before the onset of inflation saw the largest reduction in real debt burdens. Therefore, if the debt-inflation channel affects real activity, then it should operate most strongly for these high-leverage firms.
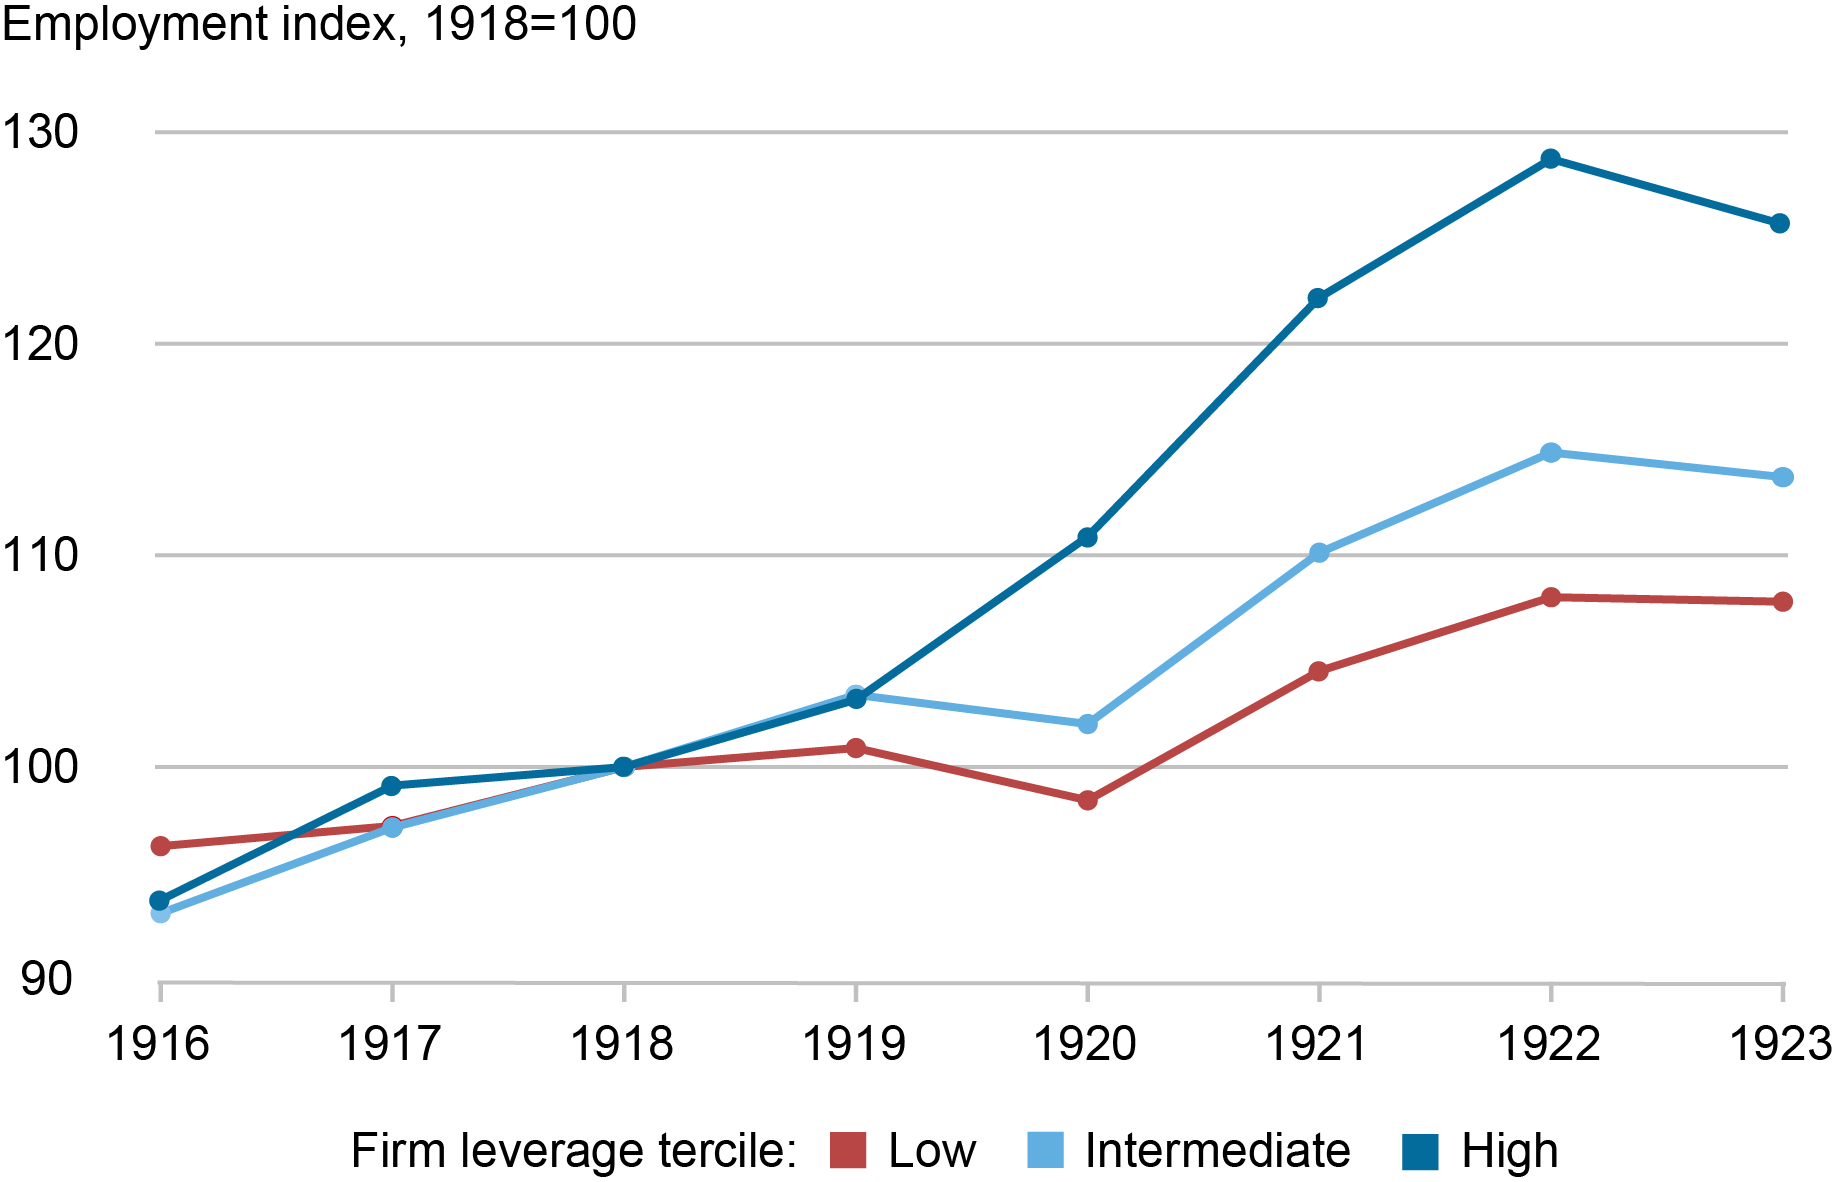
The data support this hypothesis. We find that high-leverage firms experienced larger declines in interest expenses and relative increases in both book and market equity values. Moreover, these firms expanded their real activity. The chart below shows the employment dynamics for low, intermediate, and high leverage firms during the inflation. It shows that high leverage firms saw the fastest employment growth once inflation accelerated in 1919. In terms of magnitudes, the debt-inflation channel can account for the majority of the overall expansion in employment during the German high inflation episode.
Employment Dynamics across Low and High Leverage Firms
Source: Saling’s Börsen-Jahrbuch.
Notes: This chart presents the average cumulated growth of employment for firms in the bottom, middle, and top terciles of leverage. Leverage is defined as the average ratio of liabilities-to-assets over 1918-1919. Employment is indexed to 100 in 1918 for each group.
Wrapping Up
By exploiting a newly digitized firm-level database, our research provides empirical evidence supporting the relevance of the debt-inflation channel in the transmission of unexpected inflation to the real economy. What are the broader implications of these findings? Can the debt-inflation channel be operative during times of moderate inflation?
The relevance of the debt-inflation channel depends on the structure of debt contracts. In cases where debt contracts are nominal, long-term, and denominated in domestic currency, the debt-inflation channel may be relevant even during more moderate bouts of inflation. The debt-inflation channel may also operate through households, especially in a context of fixed-rate, long-term mortgage debt, as suggested in existing academic work such as Doepke and Schneider (2006). At the same time, for firms with floating-rate or foreign-currency debt, inflation may have neutral or even negative effects on heavily leveraged firms.
Other factors can also counteract the expansionary effects of the debt-inflation channel. One example is if monetary policy responds to rising inflation by increasing interest rates and tightening financial conditions. Another potentially important offsetting effect comes from the losers of the debt-inflation channel: creditors. An increase in inflation can erode bank equity and contribute to credit contraction that offsets the expansionary effect from reducing borrower debt burdens.
Markus Brunnermeier is a professor of economics at Princeton University and director of Princeton’s Bendheim Center for Finance.

Sergio Correia is an economist at the Board of Governors of the Federal Reserve System.

Stephan Luck is a financial research advisor in Banking Studies in the Federal Reserve Bank of New York’s Research and Statistics Group.
Emil Verner is the Class of 1957 Career Development Professor and an assistant professor of finance at the MIT Sloan School of Management.
Tom Zimmerman is a professor for data analytics in economics and finance at the University of Cologne.
How to cite this post:
Markus Brunnermeier, Sergio Correia, Stephan Luck, Emil Verner, and Tom Zimmermann, “Inflating Away the Debt: The Debt‑Inflation Channel of German Hyperinflation,” Federal Reserve Bank of New York Liberty Street Economics, July 13, 2023, https://libertystreeteconomics.newyorkfed.org/2023/07/inflating-away-the-debt-the-debt-inflation-channel-of-german-hyperinflation/
BibTeX: View |


Disclaimer
The views expressed in this post are those of the author(s) and do not necessarily reflect the position of the Federal Reserve Bank of New York or the Federal Reserve System. Any errors or omissions are the responsibility of the author(s).
 RSS Feed
 Follow Liberty Street Economics