


Traditional approaches to financial sector regulation view banks and nonbank financial institutions (NBFIs) as substitutes, one inside and the other outside the perimeter of prudential regulation, with the growth of one implying the shrinking of the other. In this post, we argue instead that banks and NBFIs are better described as intimately interconnected, with NBFIs being especially dependent on banks both for term loans and lines of credit.
Are NBFIs Separate from Banks?
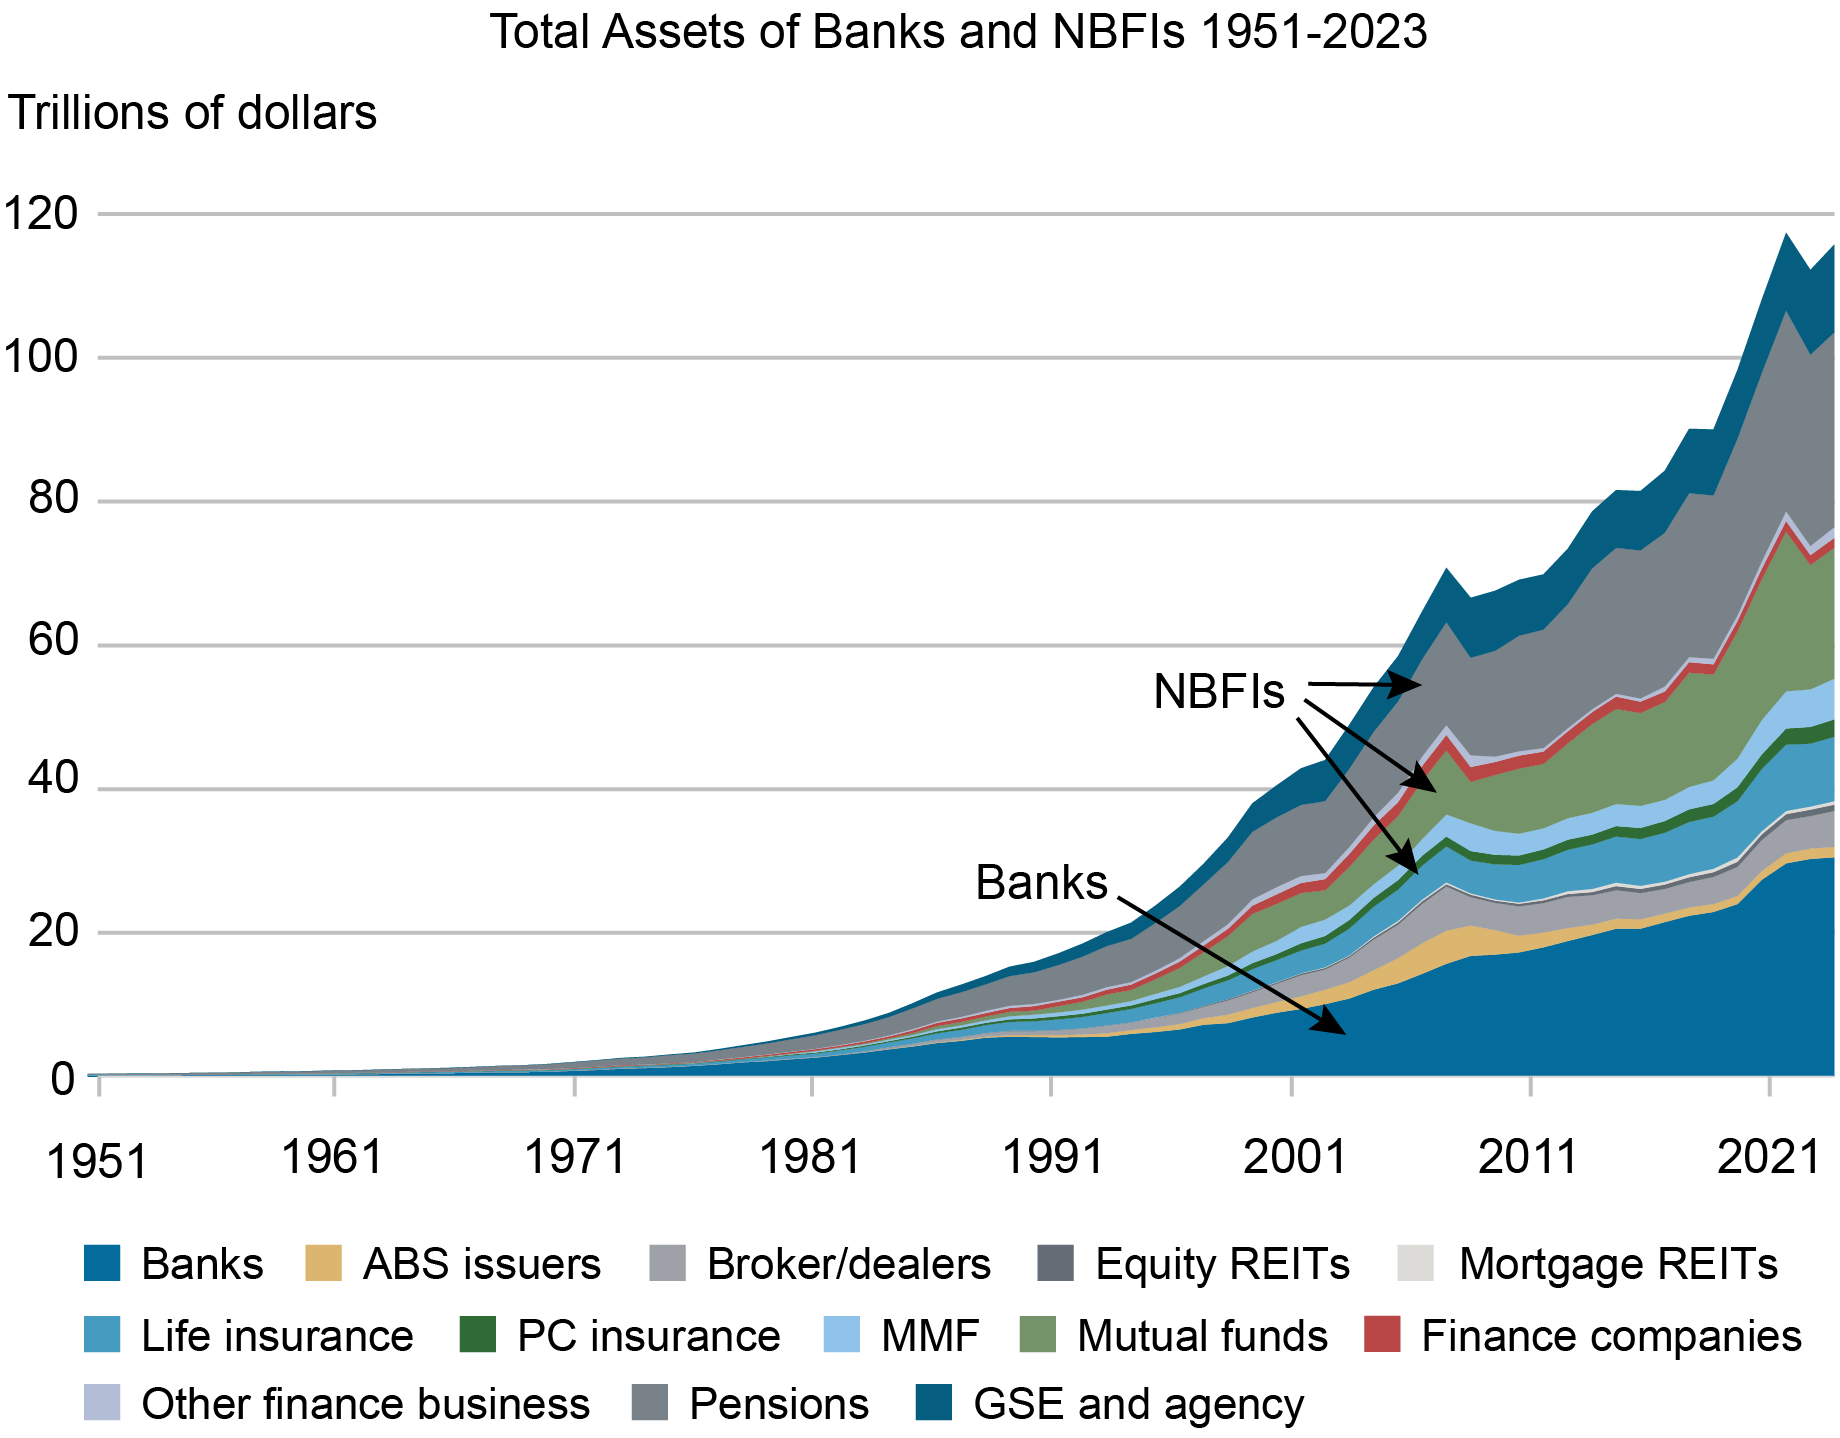
The chart below documents the rapid and relentless growth of NBFIs as their assets have outgrown those of banks, especially in the most recent decade.
NBFIs Have Grown Significantly
In a recent paper, we pose the question: Where do banks end, and where do NBFIs begin? Often, NBFIs are viewed as separate from banks. In particular, traditional approaches to financial sector regulation view banks and NBFIs as substitutes, with the growth of one implying the shrinking of the other. The substitution view of the NBFI and banking sectors, along with the possibility that NBFIs can become systemically important, underlie the powers given by the Dodd Frank Act (DFA) to regulators. These powers enable the Financial Stability Oversight Council (FSOC) to designate NBFIs as systemically important financial institutions (SIFIs) and to regulate them accordingly. Further, the DFA empowers the United States Treasury and Federal Deposit Insurance Corporation to resolve a failing large and complex financial company. In an important recent contribution, Metrick and Tarullo recommend dealing with the substitution problem applying a “congruence principle” that argues for similar activities to be regulated similarly, whether those activities are pursued within NBFIs or banks.
In our paper , we take a different view, arguing that NBFIs do not evolve independently from banks. In fact, to a significant extent, their growth depends on banks providing the funding and liquidity support necessary for NBFIs to provide intermediation services. A key observation is that nonbank financial intermediation involves significant liquidity and funding risk. Managing these risks well requires access to stable short-term funding, and likewise access to contingent sources of liquidity, especially access to funding under stress.
The market sources of financing that NBFIs rely on are, however, cyclical and fragile. In contrast, modern banks are considered relatively stable intermediaries, given their deposit franchise and access to the safety net, whether explicitly in the form of deposit insurance and central bank lender of last resort financing or implicitly in the form of official backstops. Lacking the inherent funding and liquidity advantages of banks, NBFI activity may not be viable, or it may not be easily scaled up, unless backed by routine as well as emergency liquidity support from banks.
Do Banks Fund NBFIs?
The chart below uses data on stress-tested banks (Form FR Y14-Q, Schedule H.1) to show, for the largest bank holding companies, the time trend in aggregate loans to NBFI counterparties. Bank term-lending to NBFIs has grown over the past ten years, in aggregate by about a factor of three, from about $100 billion to $300 billion, and it has been increasing for several NBFI business segments.
Term Loan Committed Exposure by NAICS
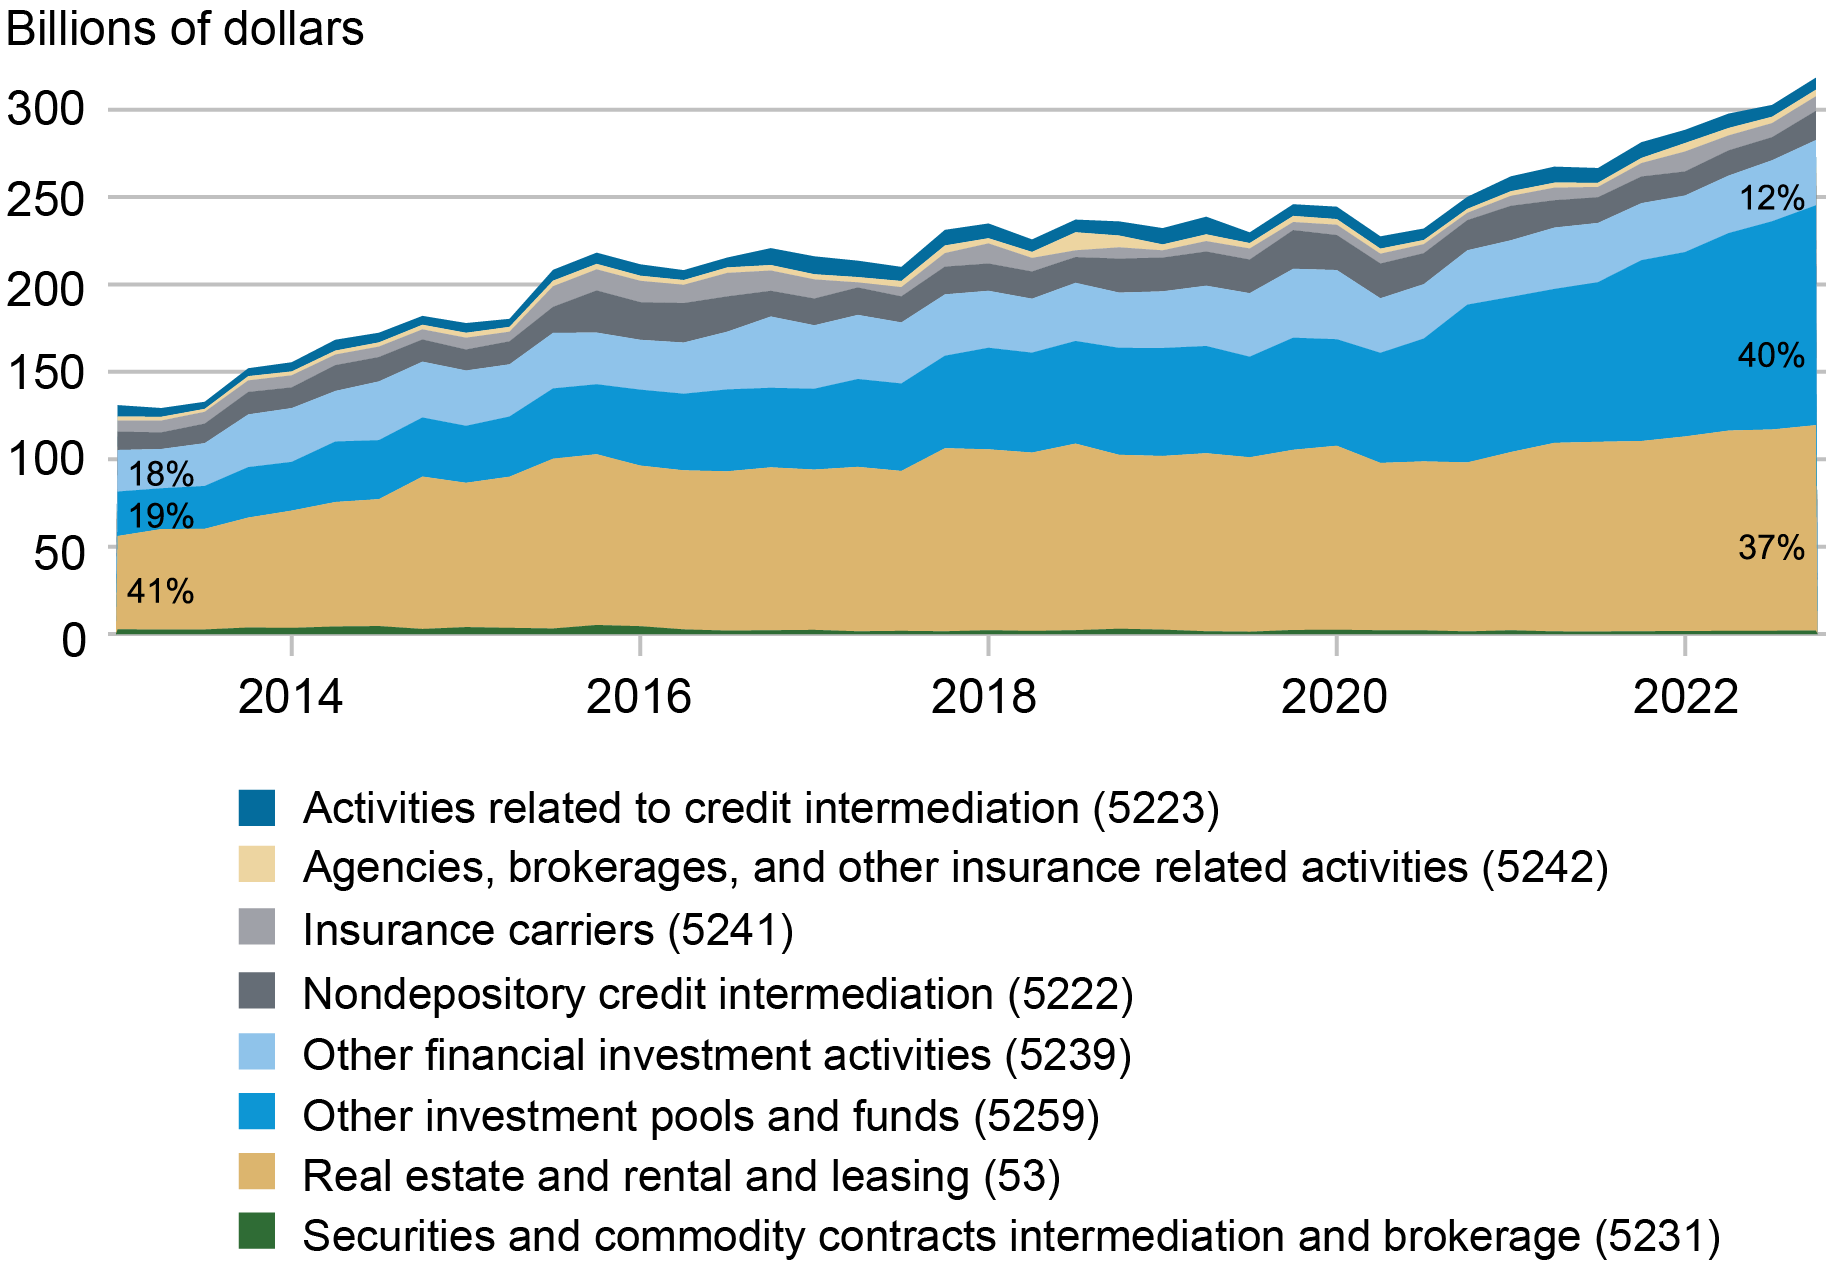
Notes: 5223 Activities Related to Credit Intermediation. Examples: Mortgage and Nonmortgage Loan Brokers; Credit card processing services; Mortgages and other loans servicing
5242 Agencies, Brokerages, and Other Insurance Related Activities. Examples: Insurance agencies and Insurance brokerages; Insurance Advisory Services
5241 Insurance Carriers. Examples: Life Insurers; Property and Casualty Insurers
5222 Nondepository Credit Intermediation. Examples: Credit card issuers; Sales financing and leasing; Mortgage Companies; Auto loan companies, Student Loan Companies
5239 Other Financial Investment Activities. Examples: Venture Capital companies; Private Equity Fund companies; Mutual funds management companies
5259 Other Investment Pools and Funds. Examples: Money market funds and mutual funds; Mortgage REITs; Issuers of asset-backed securities (including CLOs), Business Development Companies and Private Credit Funds
53 Real Estate and Rental and Leasing. Examples; Equity REITs
5231 Securities and Commodity Contracts Intermediation and Brokerage. Examples: Securities brokers; Securities dealers; Securities underwriters.
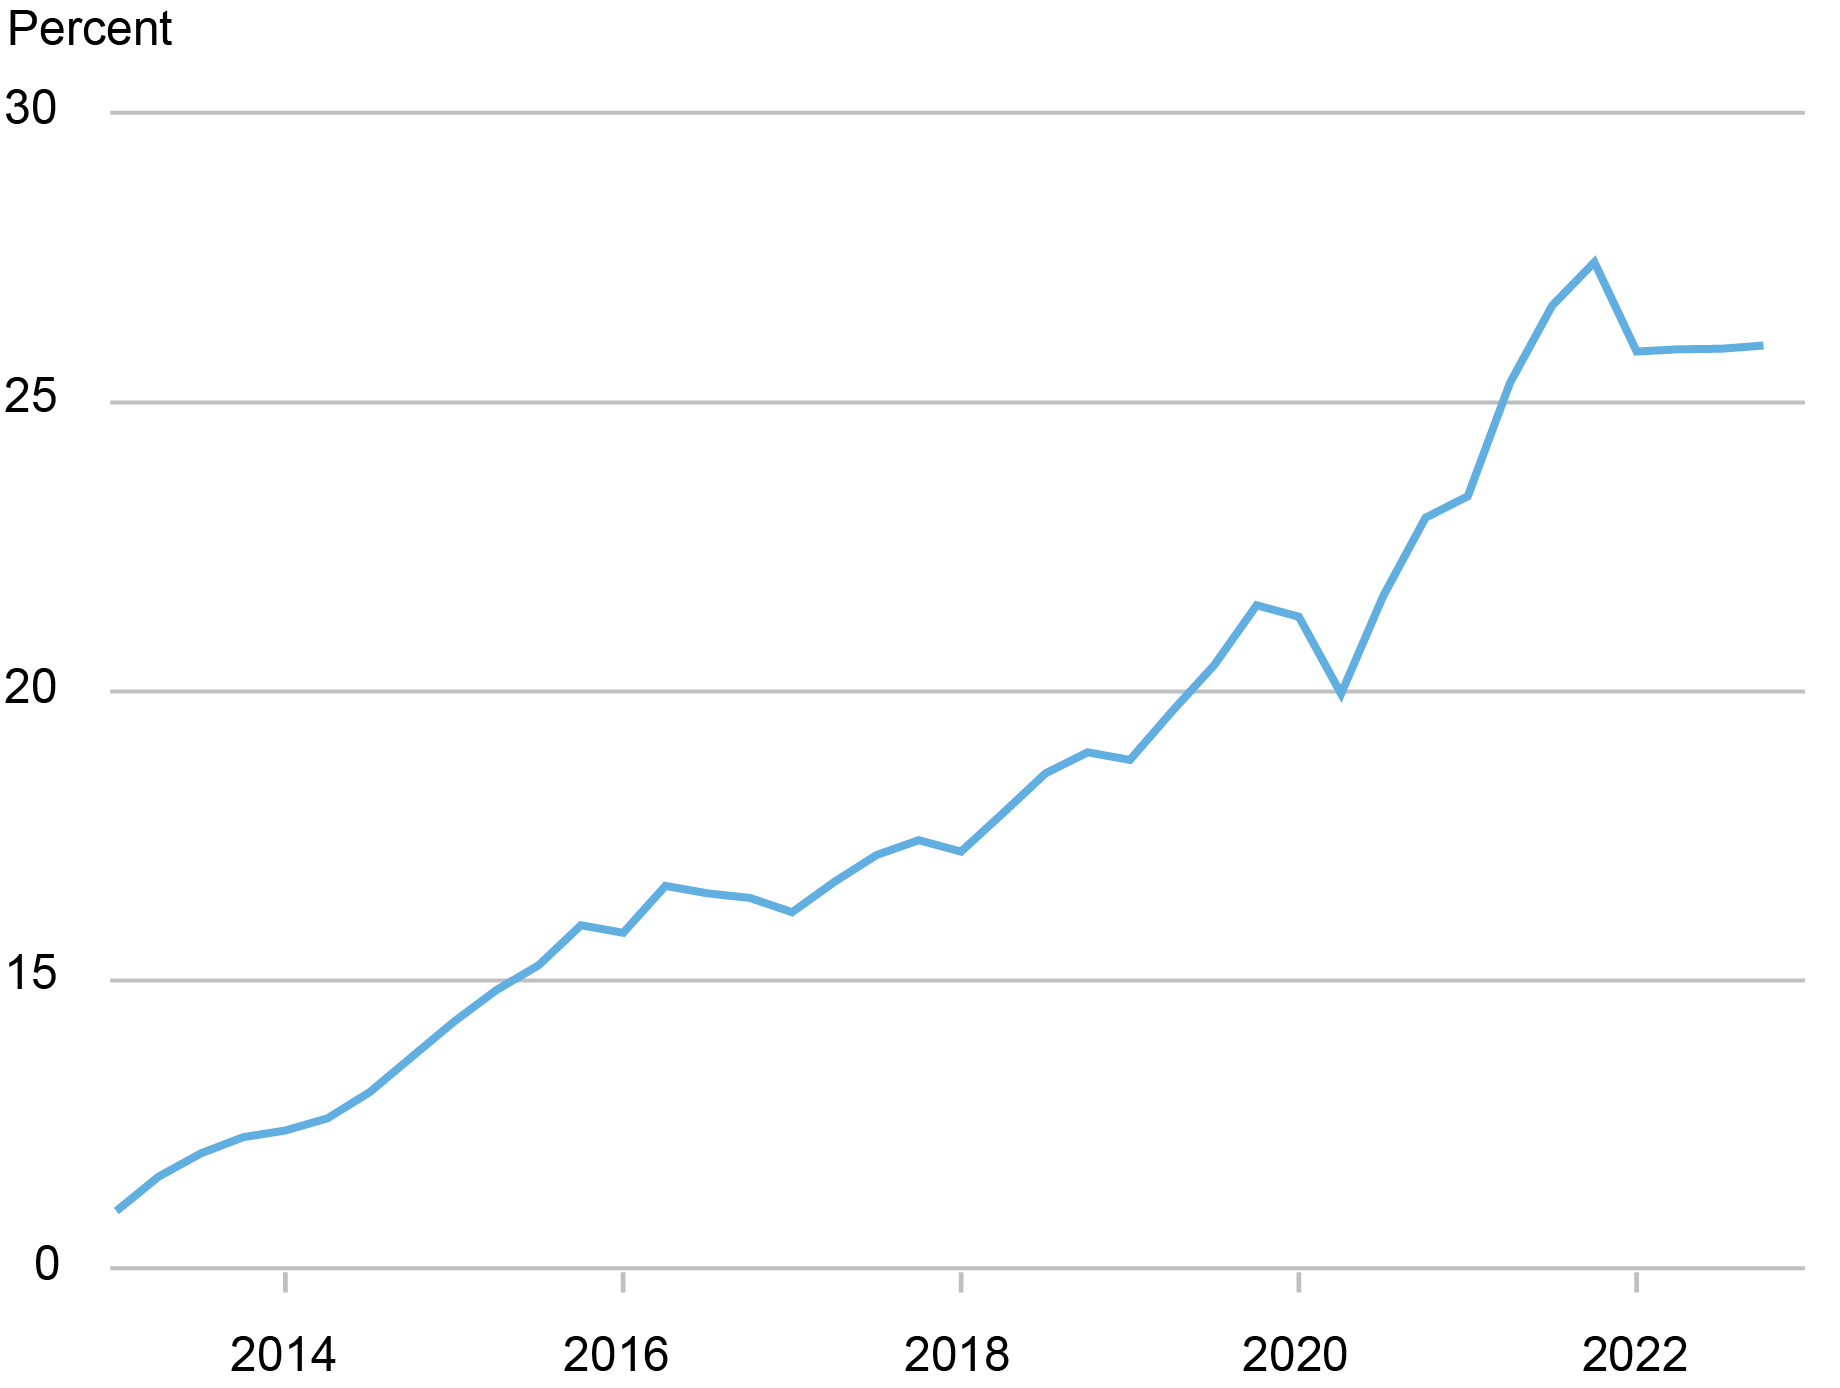
Indeed, the chart below shows that banks’ term-lending to NBFIs grows considerably as a share of their total term-lending (to NBFIs and non-financial corporations), suggesting that the last decade’s growth in NBFI assets has been coincident with an increase in bank financing of NBFIs.
Term Loans to NBFIs as a Share of Total Term Loans
To establish that NBFIs indeed depend on banks for their funding needs, we exploit a new and enhanced version of the Flow of Funds statistics, the so-called “From Whom To Whom.” To the best of our knowledge, we are the first to use such data for research purposes. For every sector reported in the Flow of Funds, the data show its total liabilities broken down by holder type. In particular, one can see how much of the liabilities issued by any given NBFI sector is held by banking institutions, relative to the holdings by the non-banking part of the financial sector and the real economy. The chart below shows one snapshot of the matrix of liabilities issuance and corresponding claim holdings for the first quarter of 2023.
Matrix of Asset- and Liability-Interdependencies, Q1 2023
| HOLDERS | NBFIs | |||||||||||||||||||||||
| ISSUERS: | Banks | ABS Issuers | Broker/ Dealers | Equity REITs | Finance Companies | GSE and Agency | Life Ins. | MMF | Mortgage REITs | Mutual Funds | Other Fin. Bus. | PC Ins. | Pensions | Real Sector | Rest of World | TOTAL | ||||||||
| Banks | 3,127 | 0 | 685 | 43 | 56 | 1,096 | 555 | 429 | 21 | 232 | 247 | 143 | 301 | 18,800 | 4,425 | 30,161 | ||||||||
| NBFIs: | ||||||||||||||||||||||||
| ABS Issuers | 143 | 0 | 4 | 0 | 1 | 11 | 573 | 45 | 0 | 39 | 69 | 116 | 27 | 45 | 375 | 1,448 | ||||||||
| Broker/Dealers | 1,370 | 0 | 1,285 | 0 | 0 | 112 | 9 | 459 | 0 | 30 | 3 | 3 | 0 | 571 | 1,587 | 5,430 | ||||||||
| Equity REITs | 224 | 29 | 0 | 9 | 5 | 12 | 130 | 0 | 15 | 61 | 2 | 24 | 62 | 169 | 160 | 903 | ||||||||
| Finance Companies | 196 | 0 | 0 | 3 | 5 | 2 | 153 | 6 | 1 | 99 | 18 | 35 | 86 | 289 | 445 | 1,338 | ||||||||
| GSE and Agency | 3,209 | 0 | 102 | 1 | 1 | 234 | 276 | 791 | 171 | 543 | 0 | 135 | 408 | 1,892 | 1,361 | 9,123 | ||||||||
| Life Ins. | 328 | 178 | 8 | 7 | 4 | 145 | 519 | 9 | 2 | 10 | 0 | 23 | 1,006 | 6,708 | 206 | 9,152 | ||||||||
| MMF | 0 | 0 | 0 | 0 | 0 | 0 | 77 | 0 | 0 | 237 | 435 | 42 | 288 | 4,385 | 200 | 5,664 | ||||||||
| Mortgage REITs | 44 | 0 | 66 | 1 | 1 | 14 | 42 | 52 | 0 | 29 | 1 | 10 | 24 | 38 | 199 | 519 | ||||||||
| Mutual Funds | 14 | 0 | 0 | 0 | 0 | 0 | 1,471 | 0 | 0 | 0 | 0 | 31 | 4,868 | 10,700 | 1,052 | 18,137 | ||||||||
| Other Fin. Bus. | 49 | 0 | 878 | 5 | 3 | 4 | 27 | 19 | 2 | 11 | 107 | 6 | 68 | 399 | 37 | 1,616 | ||||||||
| PC Ins. | 35 | 1 | 0 | 5 | 3 | 8 | 27 | 1 | 2 | 7 | 0 | 200 | 61 | 1,876 | 326 | 2,551 | ||||||||
| Pensions | 0 | 0 | 0 | 0 | 0 | 0 | 0 | 0 | 0 | 0 | 0 | 0 | 0 | 27,100 | 0 | 27,100 | ||||||||
| Real Sector | 16,200 | 1,275 | 679 | 256 | 1,197 | 10,500 | 3,477 | 1,214 | 333 | 3,365 | 186 | 1,214 | 12,400 | 43,400 | 22,100 | 117,795 | ||||||||
| Rest of World | 3,799 | 1 | 520 | 7 | 466 | 98 | 1,156 | 438 | 4 | 928 | 233 | 570 | 670 | 8,257 | 0 | 17,146 | ||||||||
| TOTAL | 28,737 | 1,483 | 4,226 | 337 | 1,744 | 12,236 | 8,491 | 3,462 | 550 | 5,591 | 1,300 | 2,554 | 20,269 | 124,630 | 32,473 |
For example, the data shows that in the first quarter of 2023, Broker/Dealers borrowed a total of $5.430 trillion (the rightmost column), and that $1.370 trillion of that total borrowing was from banking institutions (“Banks” column entry in the Broker/Dealers row). If we transform the matrix in terms of shares of total liability issuance (dividing each entry in the matrix by its row total), we can see the equivalent matrix of liability dependence:
Matrix of Liability-Interdependencies, Q1 2023
| HOLDERS | NBFIs | |||||||||||||||||||
| ISSUERS: | Banks | ABS Issuers | Broker/ Dealers | Equity REITs | Finance Companies | GSE and Agency | Life Ins. | MMF | Mortgage REITs | Mutual Funds | Other Fin. Bus. | PC Ins. | Pensions | Real Sector | Rest of World | TOTAL | ||||
| Banks | 10 | 0 | 2 | 0 | 0 | 4 | 2 | 1 | 0 | 1 | 1 | 0 | 1 | 62 | 15 | 100 | ||||
| NBFIs: | ||||||||||||||||||||
| ABS Issuers | 10 | 0 | 0 | 0 | 0 | 1 | 40 | 3 | 0 | 3 | 5 | 8 | 2 | 3 | 26 | 100 | ||||
| Broker/Dealers | 25 | 0 | 24 | 0 | 0 | 2 | 0 | 8 | 0 | 1 | 0 | 0 | 0 | 11 | 29 | 100 | ||||
| Equity REITs | 25 | 3 | 0 | 1 | 1 | 1 | 14 | 0 | 2 | 7 | 0 | 3 | 7 | 19 | 18 | 100 | ||||
| Finance Companies | 15 | 0 | 0 | 0 | 0 | 0 | 11 | 0 | 0 | 7 | 1 | 3 | 6 | 22 | 33 | 100 | ||||
| GSE and Agency | 35 | 0 | 1 | 0 | 0 | 3 | 3 | 9 | 2 | 6 | 0 | 1 | 4 | 21 | 15 | 100 | ||||
| Life Ins. | 4 | 2 | 0 | 0 | 0 | 2 | 6 | 0 | 0 | 0 | 0 | 0 | 11 | 73 | 2 | 100 | ||||
| MMF | 0 | 0 | 0 | 0 | 0 | 0 | 1 | 0 | 0 | 4 | 8 | 1 | 5 | 77 | 4 | 100 | ||||
| Mortgage REITs | 8 | 0 | 13 | 0 | 0 | 3 | 8 | 10 | 0 | 6 | 0 | 2 | 5 | 7 | 38 | 100 | ||||
| Mutual Fimds | 0 | 0 | 0 | 0 | 0 | 0 | 8 | 0 | 0 | 0 | 0 | 0 | 27 | 59 | 6 | 100 | ||||
| Other Fin. Bus. | 3 | 0 | 54 | 0 | 0 | 0 | 2 | 1 | 0 | 1 | 7 | 0 | 4 | 25 | 2 | 100 | ||||
| PC ins. | 1 | 0 | 0 | 0 | 0 | 0 | 1 | 0 | 0 | 0 | 0 | 8 | 2 | 74 | 13 | 100 | ||||
| Pensions | 0 | 0 | 0 | 0 | 0 | 0 | 0 | 0 | 0 | 0 | 0 | 0 | 0 | 100 | 0 | 100 | ||||
| Real Sector | 14 | 1 | 1 | 0 | 1 | 9 | 3 | 1 | 0 | 3 | 0 | 1 | 11 | 37 | 19 | 100 | ||||
| Rest of World | 22 | 0 | 3 | 0 | 3 | 1 | 7 | 3 | 0 | 5 | 1 | 3 | 4 | 48 | 0 | 100 |
This representation of the data confirms that many NBFI segments, especially those dedicated to credit activity, are particularly dependent on banks for their total funding needs. For instance, we see that banks hold about 10 percent of ABS issuers’ total liabilities, 25 percent of total broker/dealers’ liabilities, and 25 percent of equity REITS’ liabilities.
This level of funding/liquidity dependence of NBFIs on banks is even stronger if we look beyond the balance sheet and focus our attention on contingent liabilities, that is contractual obligations under which banks provide committed lines of credit that NBFIs can draw down as needs arise. The chart below shows the aggregate time-series of banks’ credit lines to NBFI counterparties, as reported by the stress-tested largest bank holding companies.
Credit Line Committed Exposure by NAICS
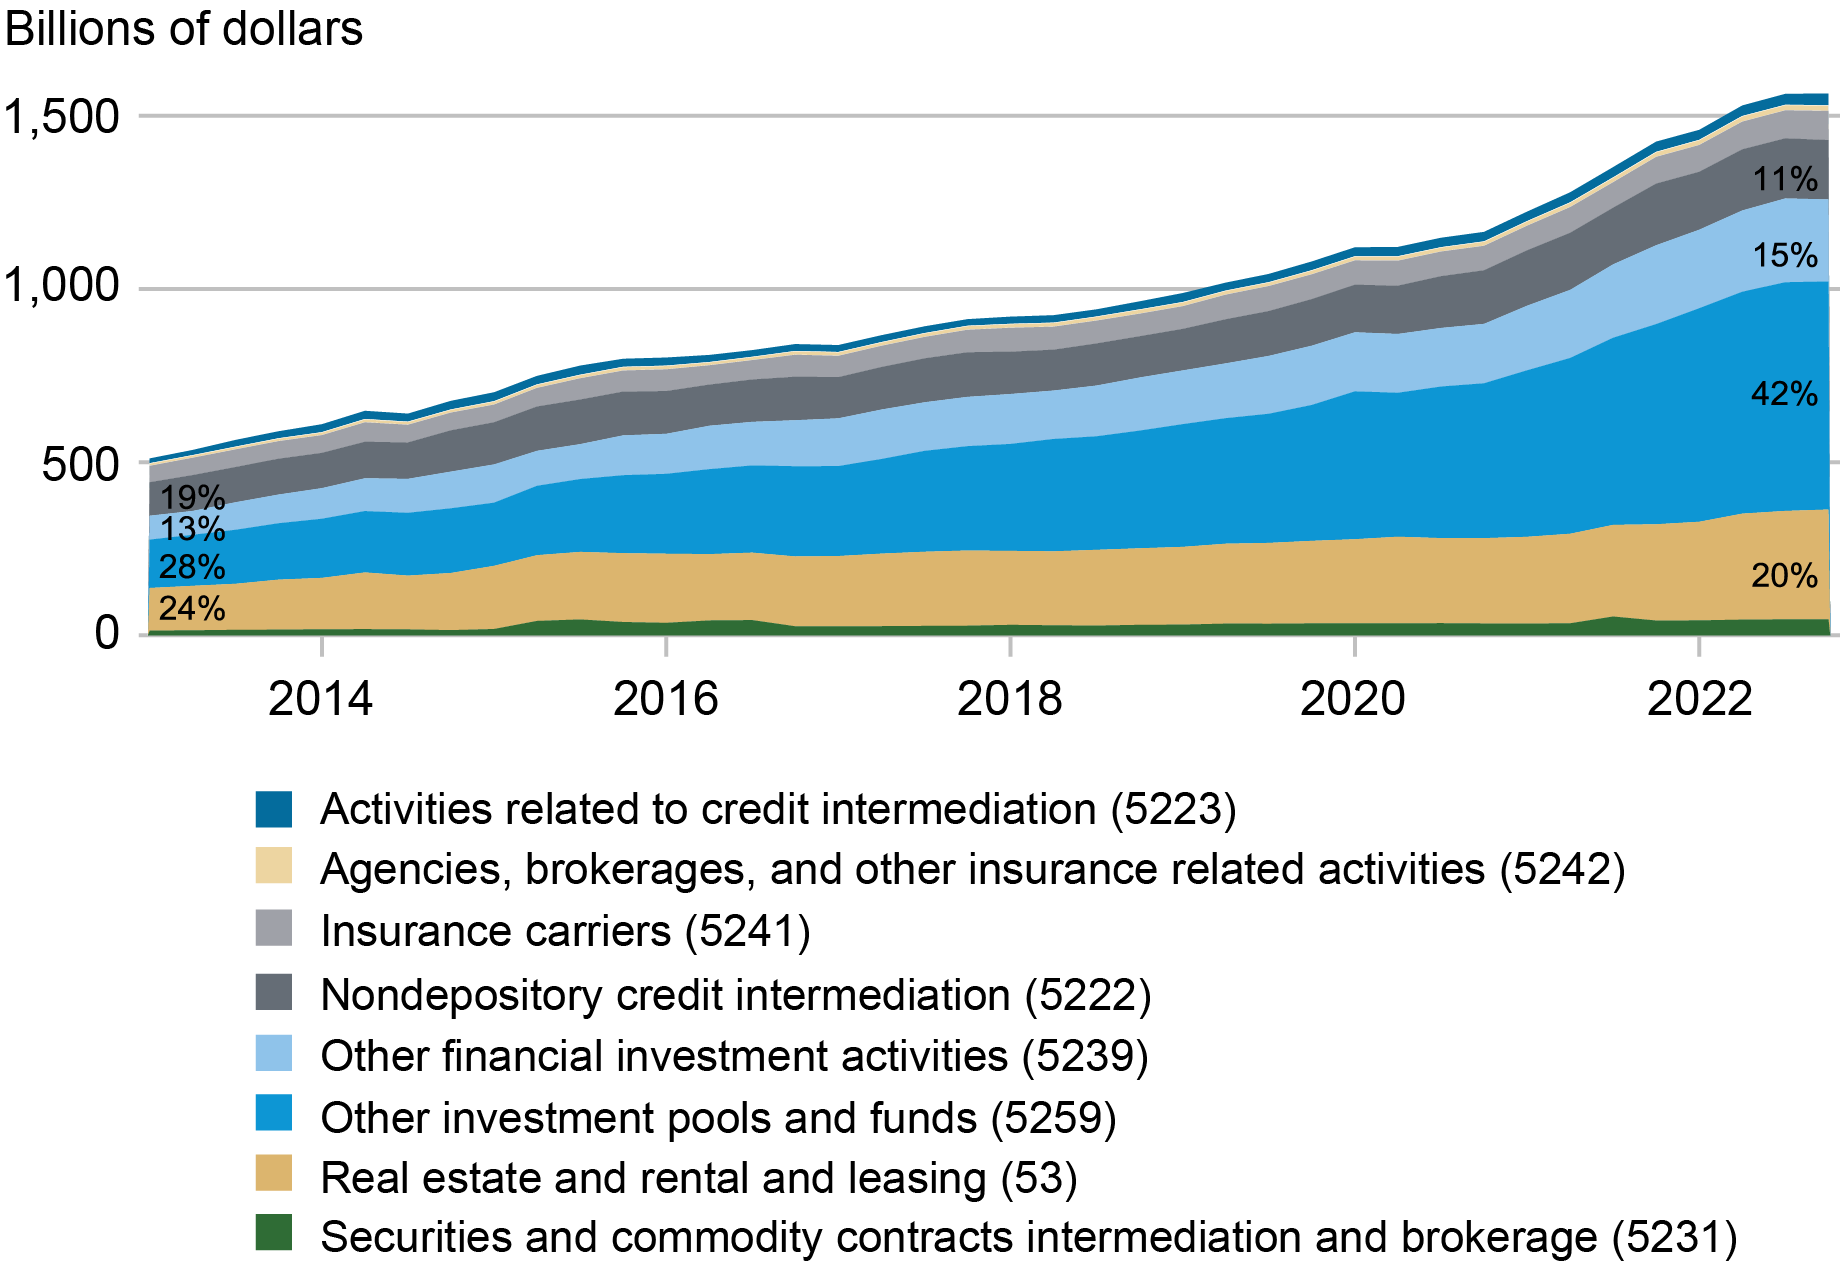
The time trend shows a steeper growth pattern in bank credit lines to NBFIs relative to bank term-lending to NBFIs, across a range of NBFI segments. Since there is no significant alternative to banks in the business of systematically providing credit lines, we can interpret these numbers to show an important, and growing, level of dependence of NBFIs on banks for their contingent liquidity needs.
Summing Up
NBFIs seem highly dependent on banks for their activity, and much of their growth seems backed by banks. But how has this interconnected nature of banks and NBFIs come about? In the next posts in this series, we will discuss specific type of intermediation products that are now increasingly provided by NBFIs, and the associated bank activities. Moreover, we will focus on the implications of this bank-NBFI linkage for aggregate risk, and for policy and regulation.
Viral Acharya is a professor of finance at New York University Stern School of Business.

Nicola Cetorelli is the head of Non-Bank Financial Institution Studies in the Federal Reserve Bank of New York’s Research and Statistics Group.
Bruce Tuckman is a professor of finance at New York University Stern School of Business.
How to cite this post:
Viral V. Acharya, Nicola Cetorelli, and Bruce Tuckman, “Nonbanks Are Growing but Their Growth Is Heavily Supported by Banks,” Federal Reserve Bank of New York Liberty Street Economics, June 17, 2024, https://libertystreeteconomics.newyorkfed.org/2024/06/nonbanks-are-growing-but-their-growth-is-heavily-supported-by-banks/
BibTeX: View |


Disclaimer
The views expressed in this post are those of the author(s) and do not necessarily reflect the position of the Federal Reserve Bank of New York or the Federal Reserve System. Any errors or omissions are the responsibility of the author(s).
 RSS Feed
 Follow Liberty Street Economics