


In this post, we evaluate how deposits have evolved over the latter portion of the current monetary policy tightening cycle. We find that while deposit betas have continued to rise, they did not accelerate following the bank runs in March 2023. In addition, while overall deposit funding has remained stable, we find that the banks most affected by the March 2023 events are offering higher deposit rates and are growing their deposit funding relative to the broader banking industry.
Monetary Policy and Banks’ Security Losses
The beginning of 2022 saw unique conditions in the banking sector relative to prior cycles. Deposits and reserves were at their highest levels since the global financial crisis (GFC) of 2007-08, while policy rates were effectively at the zero lower bound. These conditions were in part attributable to the unique nature of the COVID recession and the various forms of government support that sought to minimize disruptions to banks, businesses, and households.
The Federal Reserve embarked on a rapid tightening cycle in March 2022 to counter a significant increase in inflation. By March 2023, interest rate increases had reduced the value of various fixed-rate assets, like securities and mortgages, resulting in substantial unrealized losses in the banking sector. Typically, such losses remain unrealized because banks can hold their fixed-rate assets to maturity since these are funded by relatively fixed, long-maturity liabilities (see this April 2023 post for more on this phenomenon). In this case, however, several banks experienced depositor flight in response to solvency concerns.
Given these disruptions, there was a risk that pervasive unrealized losses might inspire a revision in depositor behavior that would imperil the broader banking system by forcing additional institutions to raise deposit rates or seek expensive funding to avoid selling assets and realizing interest-rate-related losses.
Industry Deposit Conditions Appear Stable
The cost of deposits relative to prevailing interest rates has continued to increase, but the pace of change has appeared stable following the events in March 2023. The chart below depicts the change in overall deposit rates relative to changes in the federal funds rates—or the cumulative beta—over the course of the last five tightening cycles for the banking industry. Since 2023:Q1, the cumulative beta of deposits has continued to rise. While the current tightening cycle now resembles those prior to the GFC, there does not appear to have been a sharp change in the progression of deposit pricing following the events in March.
Industry Deposit Beta Continues to Rise at a Steady Rate
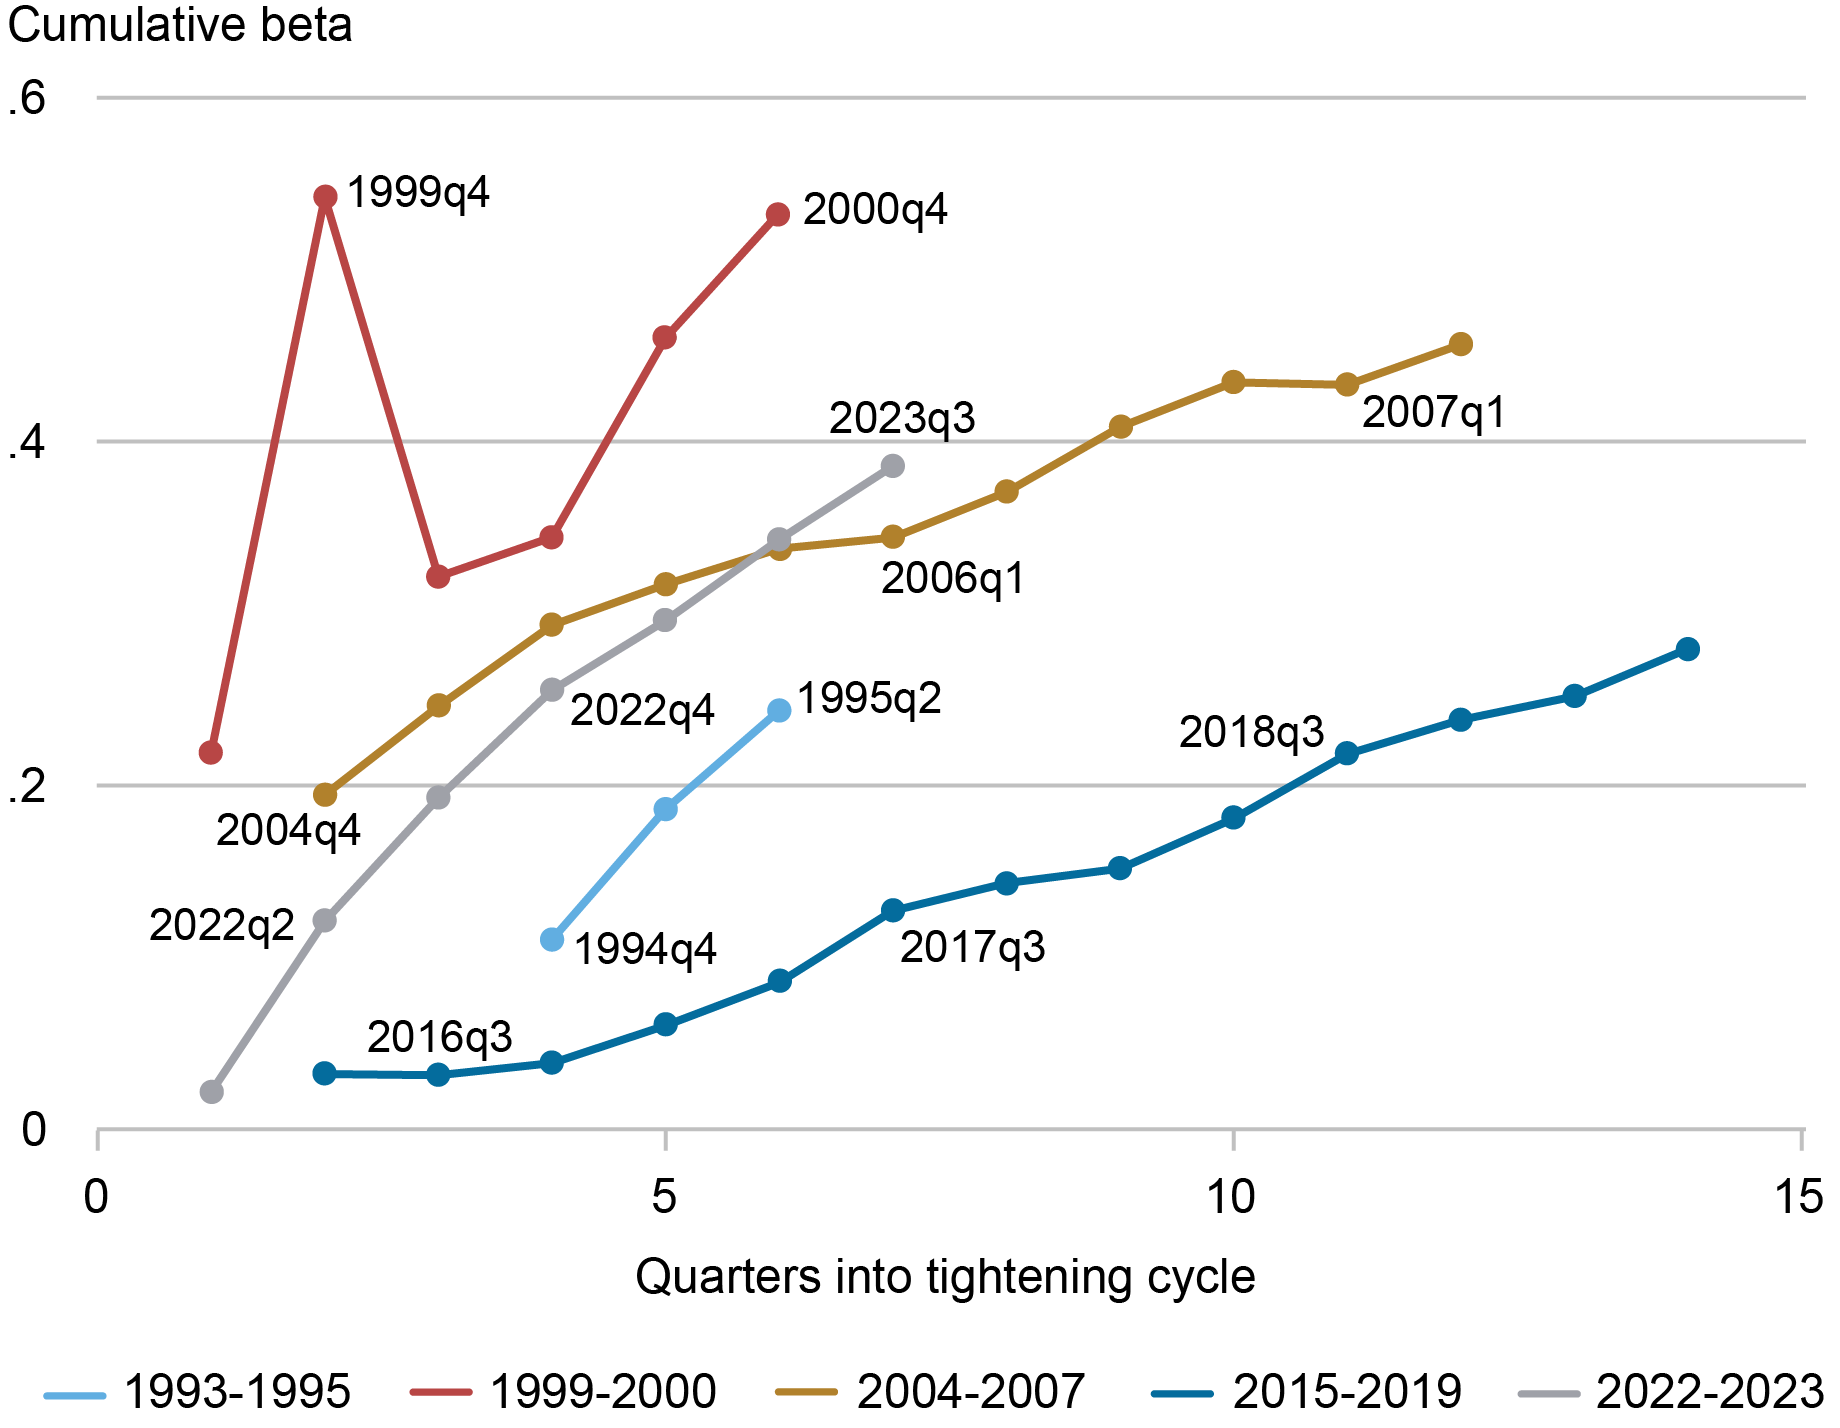
Notes: Betas are the cumulative change of implied deposit rates on total deposits (interest-bearing and noninterest-bearing) relative to the change in the average quarterly federal funds rate. Implied deposit rates are estimated as the interest expense on deposits divided by the average deposit balance in the quarter.
Nevertheless, the composition of bank funding has continued to evolve. The chart below depicts the evolution of sources of industry funding relative to total assets in 2019:Q2. For this exercise we maintain a balanced panel of banks and exclude the banks that failed in March 2023. This approach allows us to study the relative importance of each category of funding as well as the change in funding over time.
The chart shows that the industry grew substantially during the downturn, with assets up approximately 30 percent through 2021:Q4 relative to 2019:Q2 (the dark blue line). The growth in assets was primarily funded by the growth in interest-bearing (the light blue line) and noninterest-bearing (the red line) deposits. Since 2021:Q4, assets have remained roughly flat: declines in noninterest deposits were offset by a rise in other debt (the gold line) such as advances from Federal Home Loan Banks (FHLB) and interest-bearing deposits (including time deposits). These trends appear unchanged following the events of 2023:Q1.
Industry Asset Growth Has Slowed, but Overall Funding Is Stable
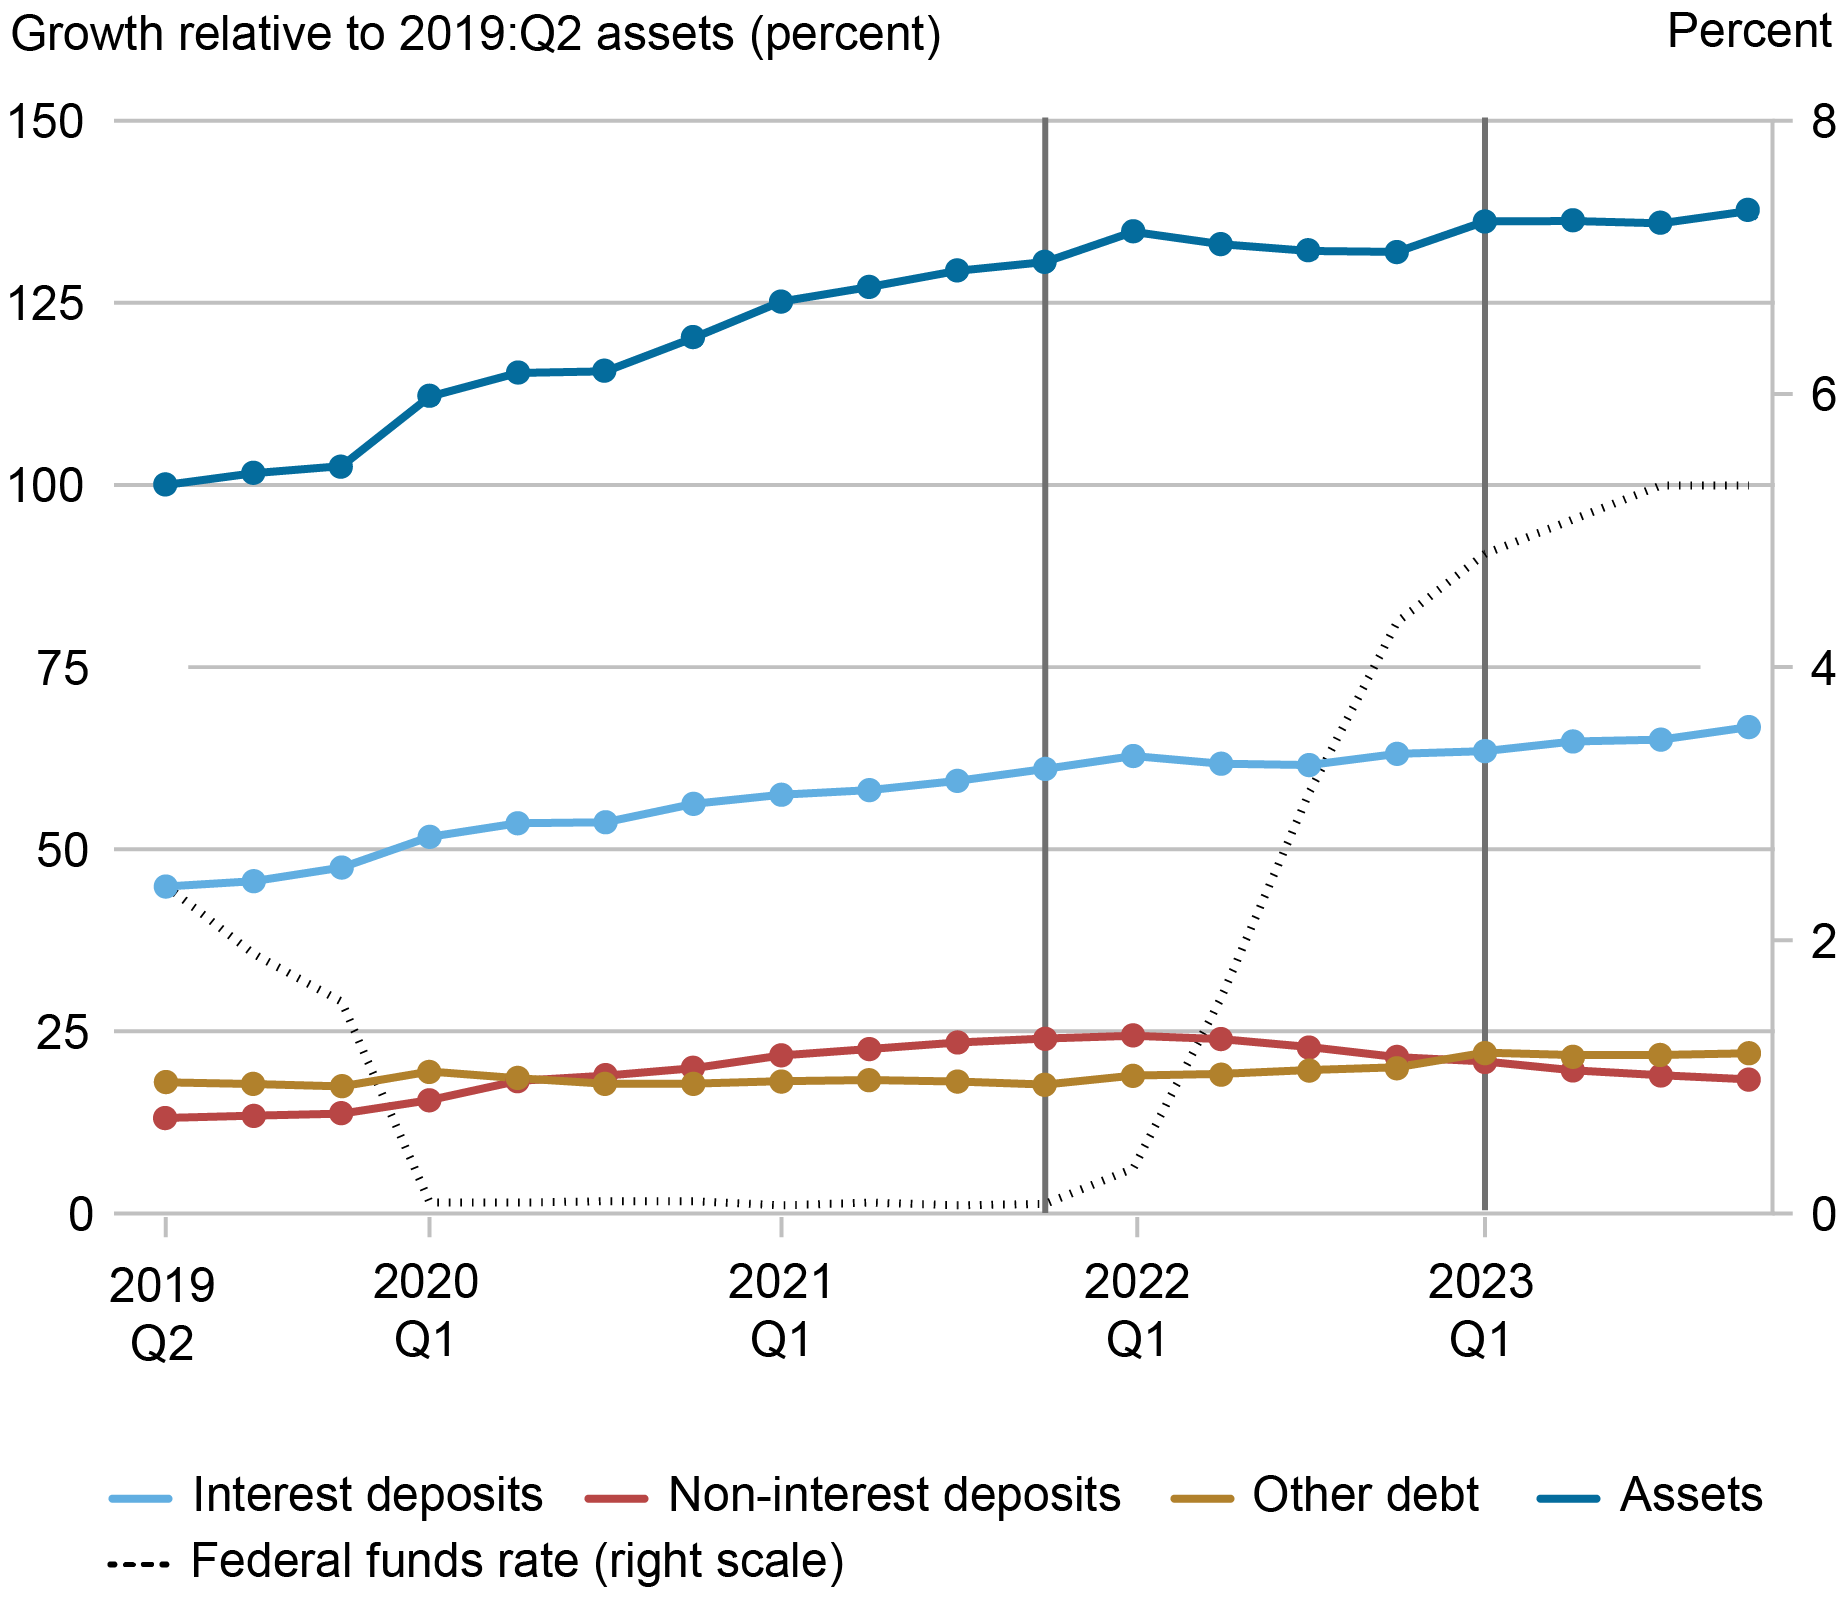
Notes: Industry quantities are plotted relative to total assets in 2019:Q2, which illustrates dynamics over time as well as their importance relative to the size of the industry. The first vertical line indicates the start of the current tightening cycle; the second indicates the turmoil in the banking sector in March 2023.
Deposit Pricing and Funding across Banks
Since the events in March, bank distress has been concentrated in a subset of banks and not readily observed at the industry level. Here we examine how deposit price and funding conditions changed for banks of different sizes. This is particularly insightful because much of the immediate distress following the events in March 2023 was concentrated among bank holding companies (BHCs) between $50 billion and $250 billion in assets, also known as “super-regionals” (see this May 2023 blog post). These banks experienced large deposit outflows that were mostly directed toward the largest banks (those with assets of at least $250 billion).
The chart below illustrates the evolution of cumulative deposit betas during the current tightening cycle across the distribution of bank size. There are meaningful differences in the cumulative deposit betas, with super-regionals (the gold line) being a key outlier. Deposit betas for these institutions have generally been higher than those of smaller banks throughout this tightening cycle. However, the difference with smaller banks emerged prior to 2023:Q1 and remained consistent through the March episode. Indeed, there do not appear to have been meaningful shifts in the betas of super-regionals relative to those of smaller banks since the bank run.
For the largest banks, betas have been going up at a slower pace than those of other banks. This may reflect the perceived safety of these institutions relative to other banks and is consistent with the flow of deposits to the largest banks around the Silicon Valley Bank episode.
Super-Regionals Exhibit Consistently Higher Deposit Betas
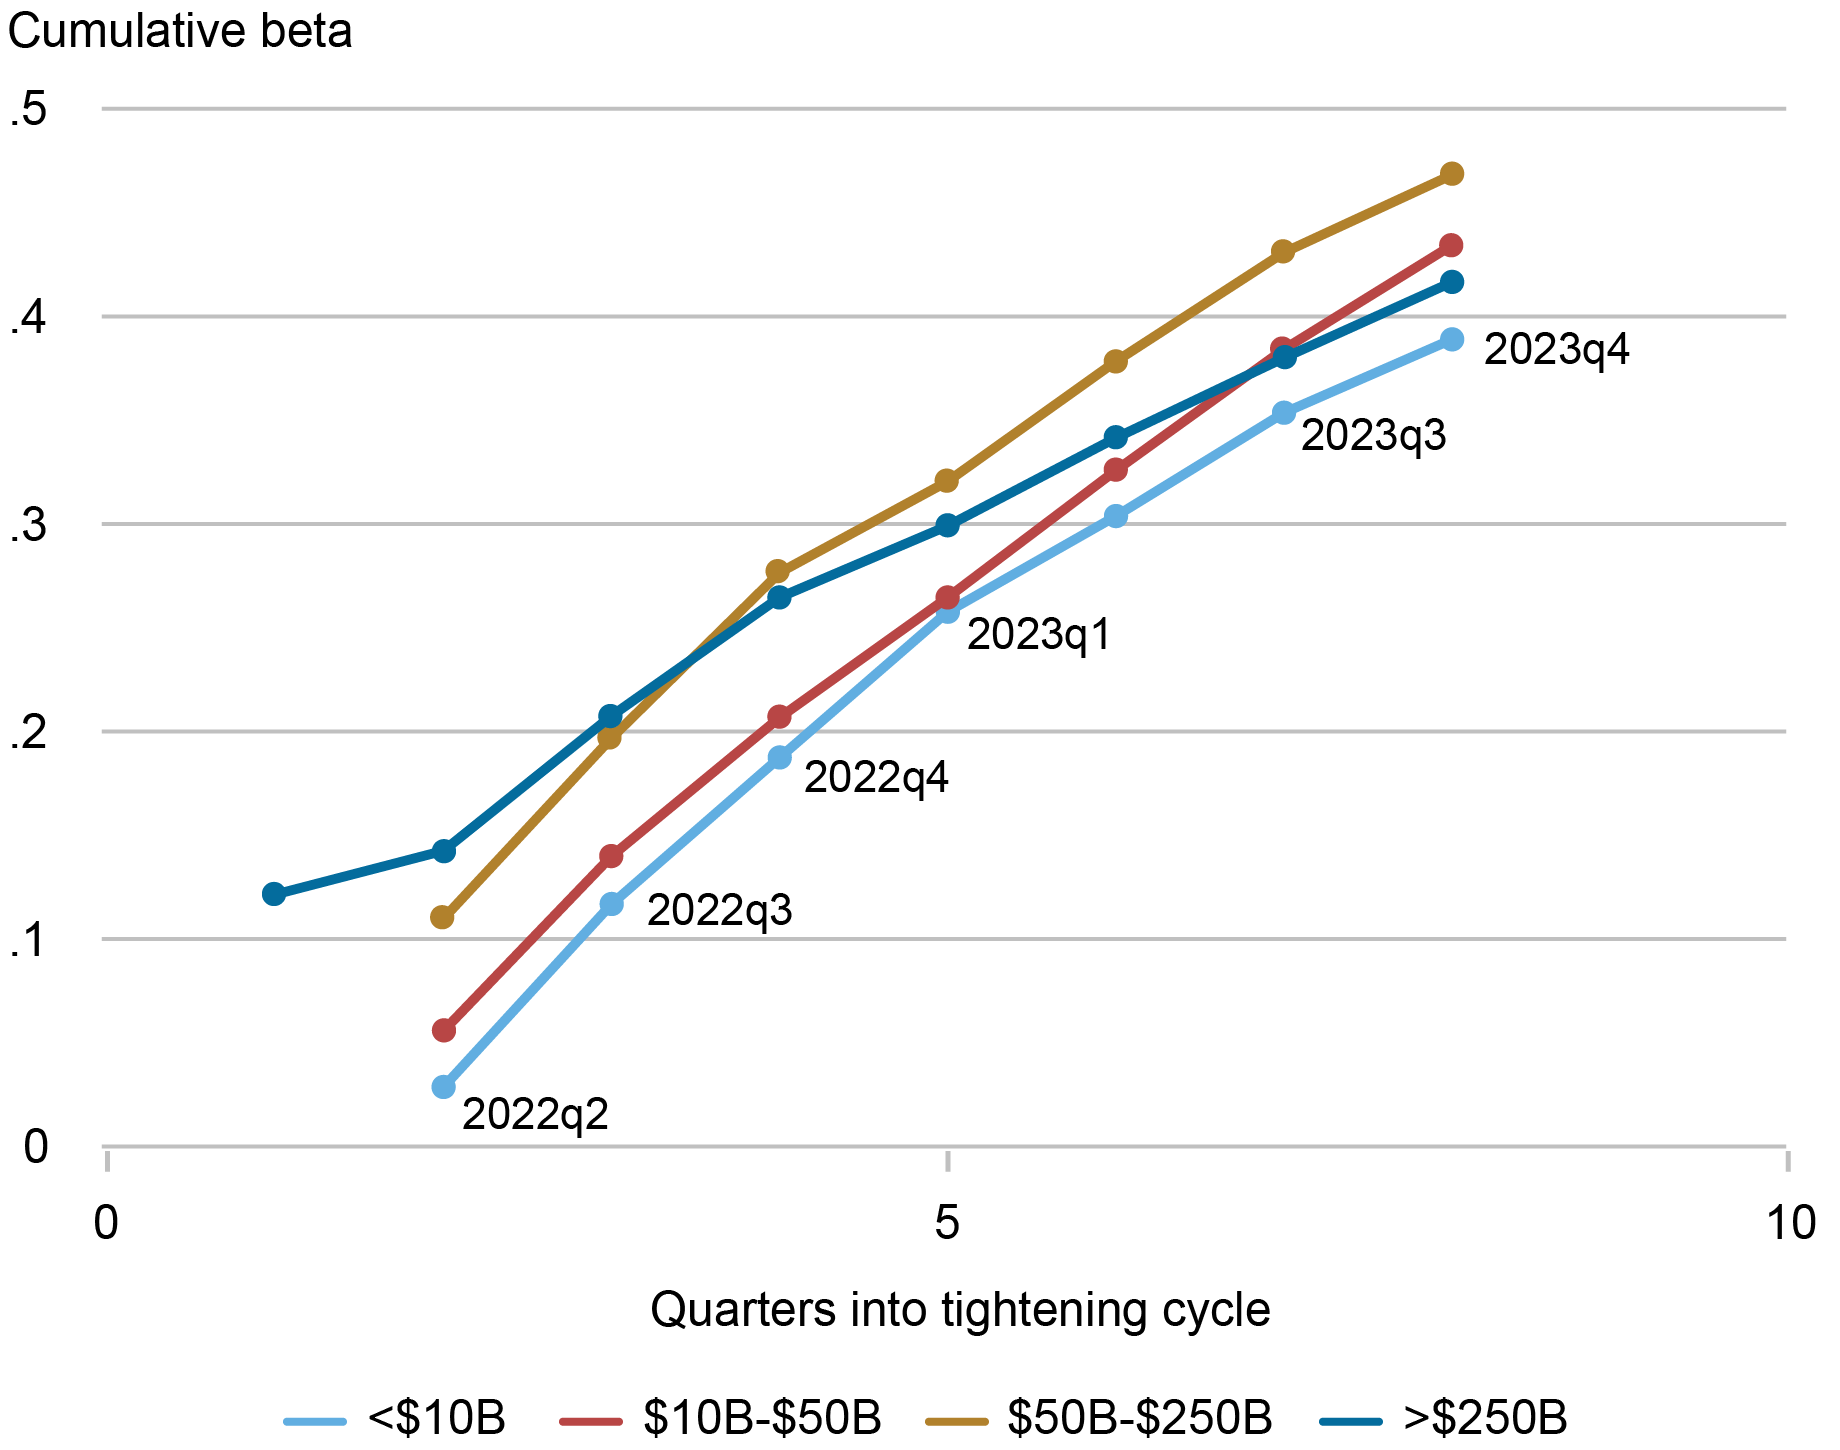
Sources: FR Y-9C data; authors’ calculations.
Notes: Betas are the cumulative change of implied deposit rates on total deposits (interest-bearing and noninterest-bearing) relative to the change in the average quarterly federal funds rate. Implied deposit rates are estimated as the interest expense on deposits divided by the average deposit balance in the quarter. BHCs are placed in size buckets using asset size in 2009:Q4 dollars.
Turning to balances, super-regionals have also experienced differential funding patterns relative to the industry as a whole. The chart below summarizes the relative importance of each funding category along with the evolution since 2019:Q2. For the super-regionals, assets grew in line with the industry up to the quarter in which rates increased. However, after rates began to rise, the super-regionals continued to grow while the industry has remained roughly flat. The growth in super-regional BHCs reflects the continued increase in interest-bearing deposits and, to a lesser degree, other debt. In association with super-regionals’ greater responsiveness to interest rates, these results suggest that these banks have raised their rates by more but have also been able to grow interest-bearing deposits relative to the industry.
Super-Regional Asset and Deposit Growth Exceeds the Industry
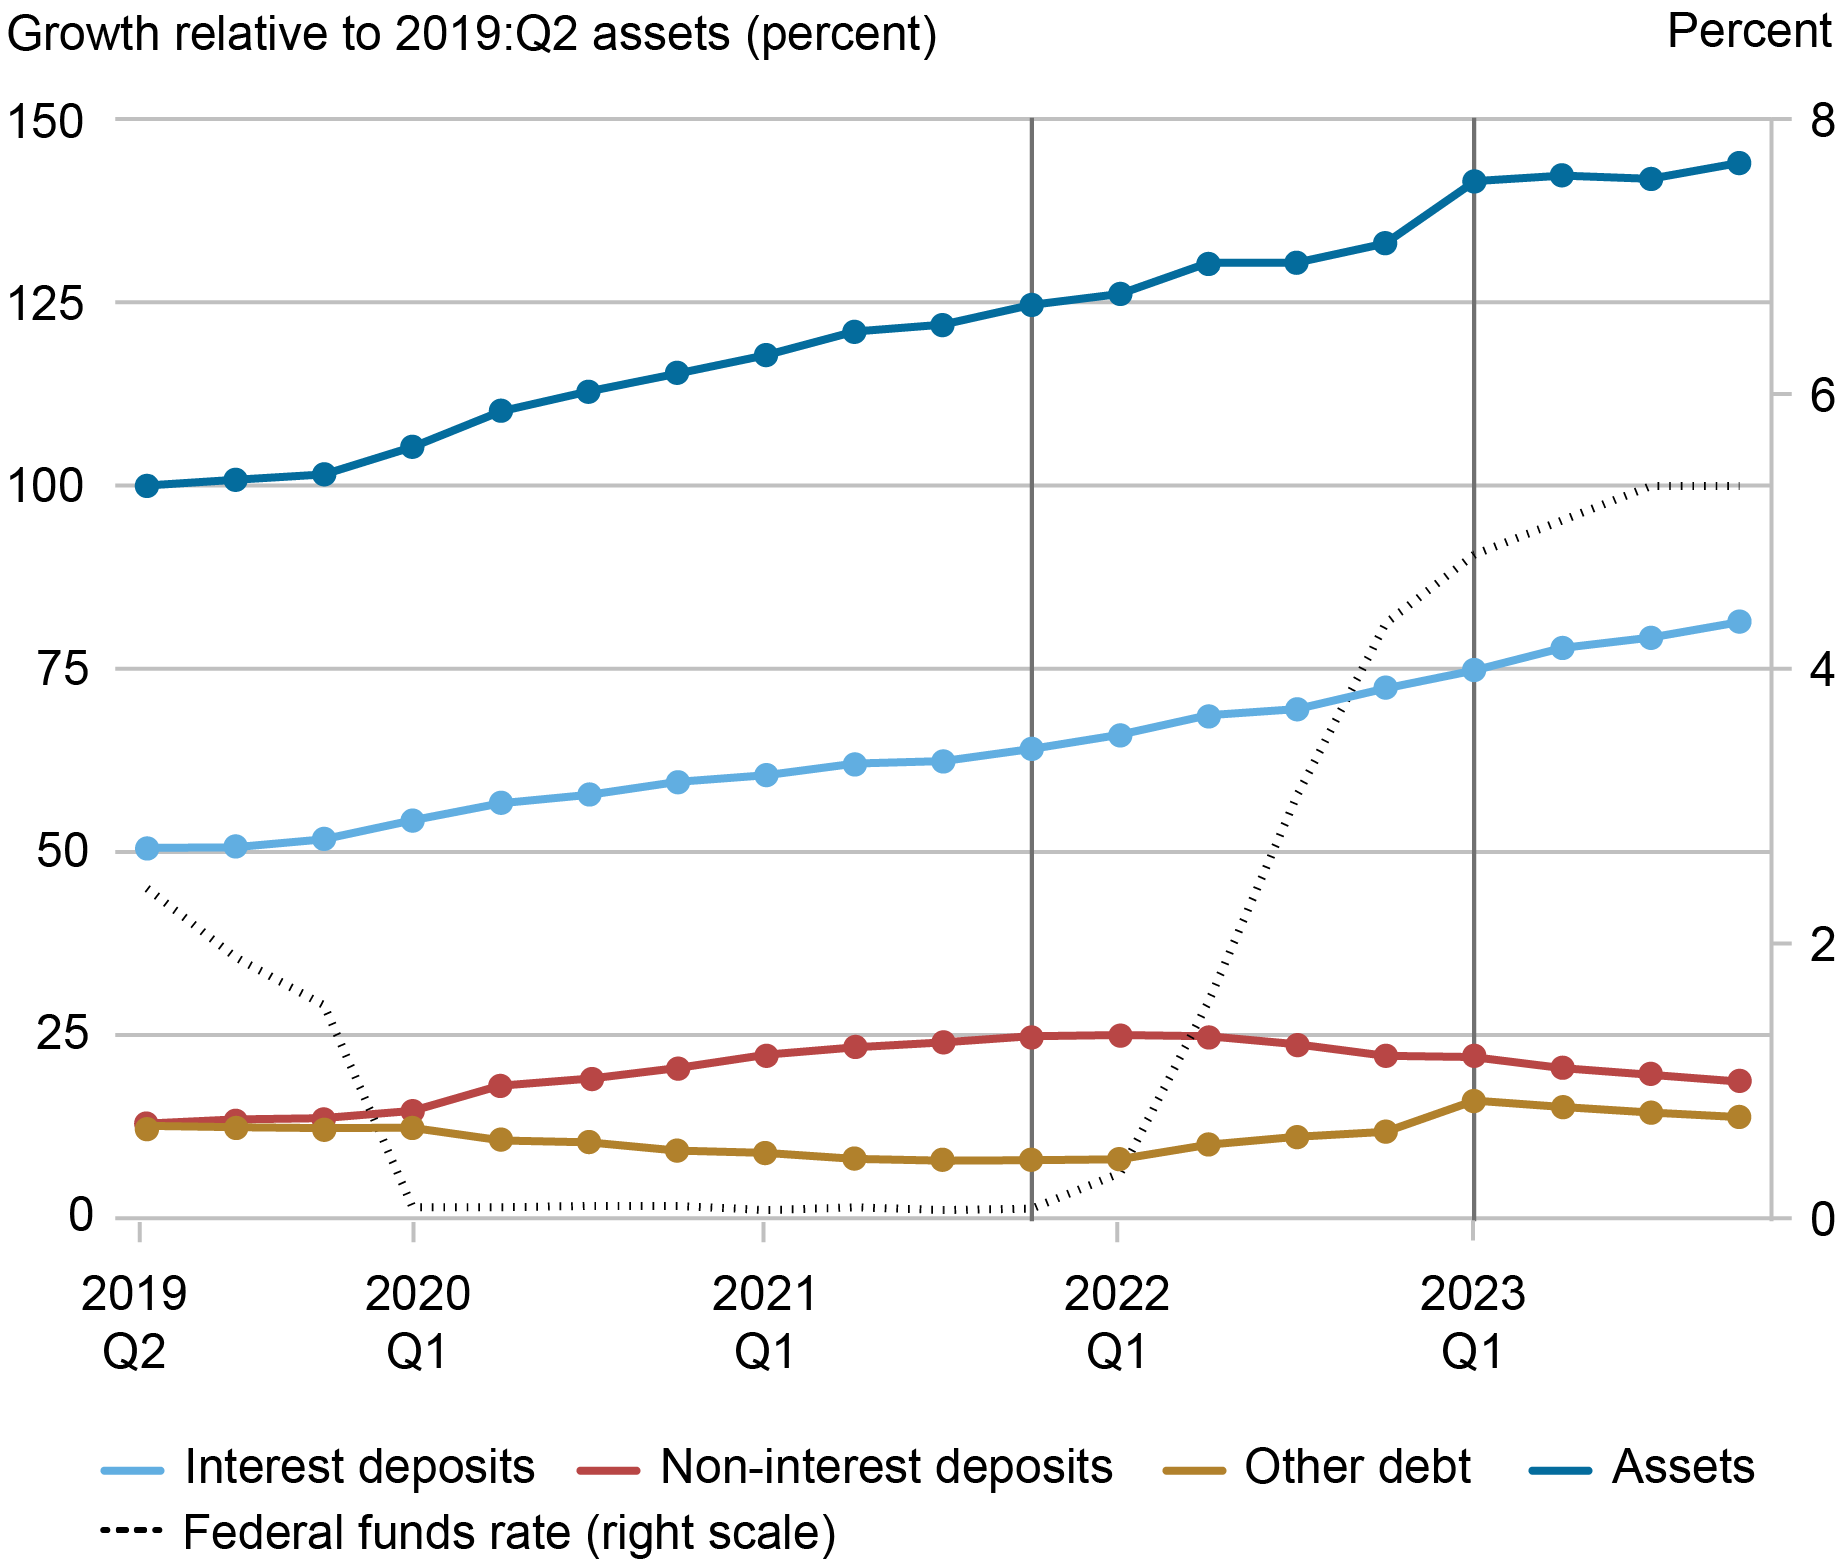
Sources: FR Y-9C data; authors’ calculations.
Notes: Industry quantities are plotted relative to total assets in 2019:Q2, which illustrates dynamics over time as well as their importance relative to the size of the industry. The first vertical line indicates the start of the current tightening cycle; the second indicates the turmoil in the banking sector in March 2023.
Summing Up
The events of March 2023 increased the saliency of the sensitivity of deposit funding to macroeconomic and bank-specific conditions. Our review of deposit pricing and funding since that time indicates that the industry appears to have avoided a significant change in depositor behavior that would further pressure earnings and capital. This may in part have been due to government interventions, such as the guarantees extended to depositors and creation of the Bank Term Funding Facility.
Further, we document that the deposit pricing of super-regional banks has exhibited a greater sensitivity to rising rates. In line with higher rates, these banks have also grown deposit funding relative to the broader banking industry. In our next post, we will explore the future path of deposit rates given the current neutral stance of monetary policy.

Stephan Luck is a financial research advisor in Banking Studies in the Federal Reserve Bank of New York’s Research and Statistics Group.

Matthew Plosser is a financial research advisor in Banking Studies in the Federal Reserve Bank of New York’s Research and Statistics Group.
How to cite this post:
Stephan Luck and Matthew Plosser, “Deposits and the March 2023 Banking Crisis—A Retrospective,” Federal Reserve Bank of New York Liberty Street Economics, March 27, 2024, https://libertystreeteconomics.newyorkfed.org/2024/03/deposits-and-the-march-2023-banking-crisis-a-retrospective/
BibTeX: View |

Disclaimer
The views expressed in this post are those of the author(s) and do not necessarily reflect the position of the Federal Reserve Bank of New York or the Federal Reserve System. Any errors or omissions are the responsibility of the author(s).
 RSS Feed
 Follow Liberty Street Economics