


A previous post explored the potential implications for U.S. growth and inflation of a manufacturing-led boom in China. This post considers spillovers to the U.S. from a downside scenario, one in which China’s ongoing property sector slump takes another leg down and precipitates an economic hard landing and financial crisis.
China’s Policy Space Is Becoming More Constrained
In this scenario, Chinese authorities’ policy space proves insufficient to forestall a deep and protracted downturn. Our view is that this scenario is less likely to materialize than the upside scenario described in our previous post. We share the consensus view that the Chinese authorities retain considerable scope for managing the economy and associated financial risks.
In earlier work, we examined the Chinese authorities’ policy space and its potential limits. To recap, China’s policy tools draw added power from unique features of the country’s political and financial system. China’s government maintains direct and indirect control of the country’s financial and nonfinancial sectors. Moreover, the domestic economy is shielded from external shocks by the country’s current account surplus, large stock of foreign exchange reserves, and system of capital controls. Overall, the authorities possess considerable scope for using monetary, credit, and central government fiscal policies to dampen economic fluctuations.
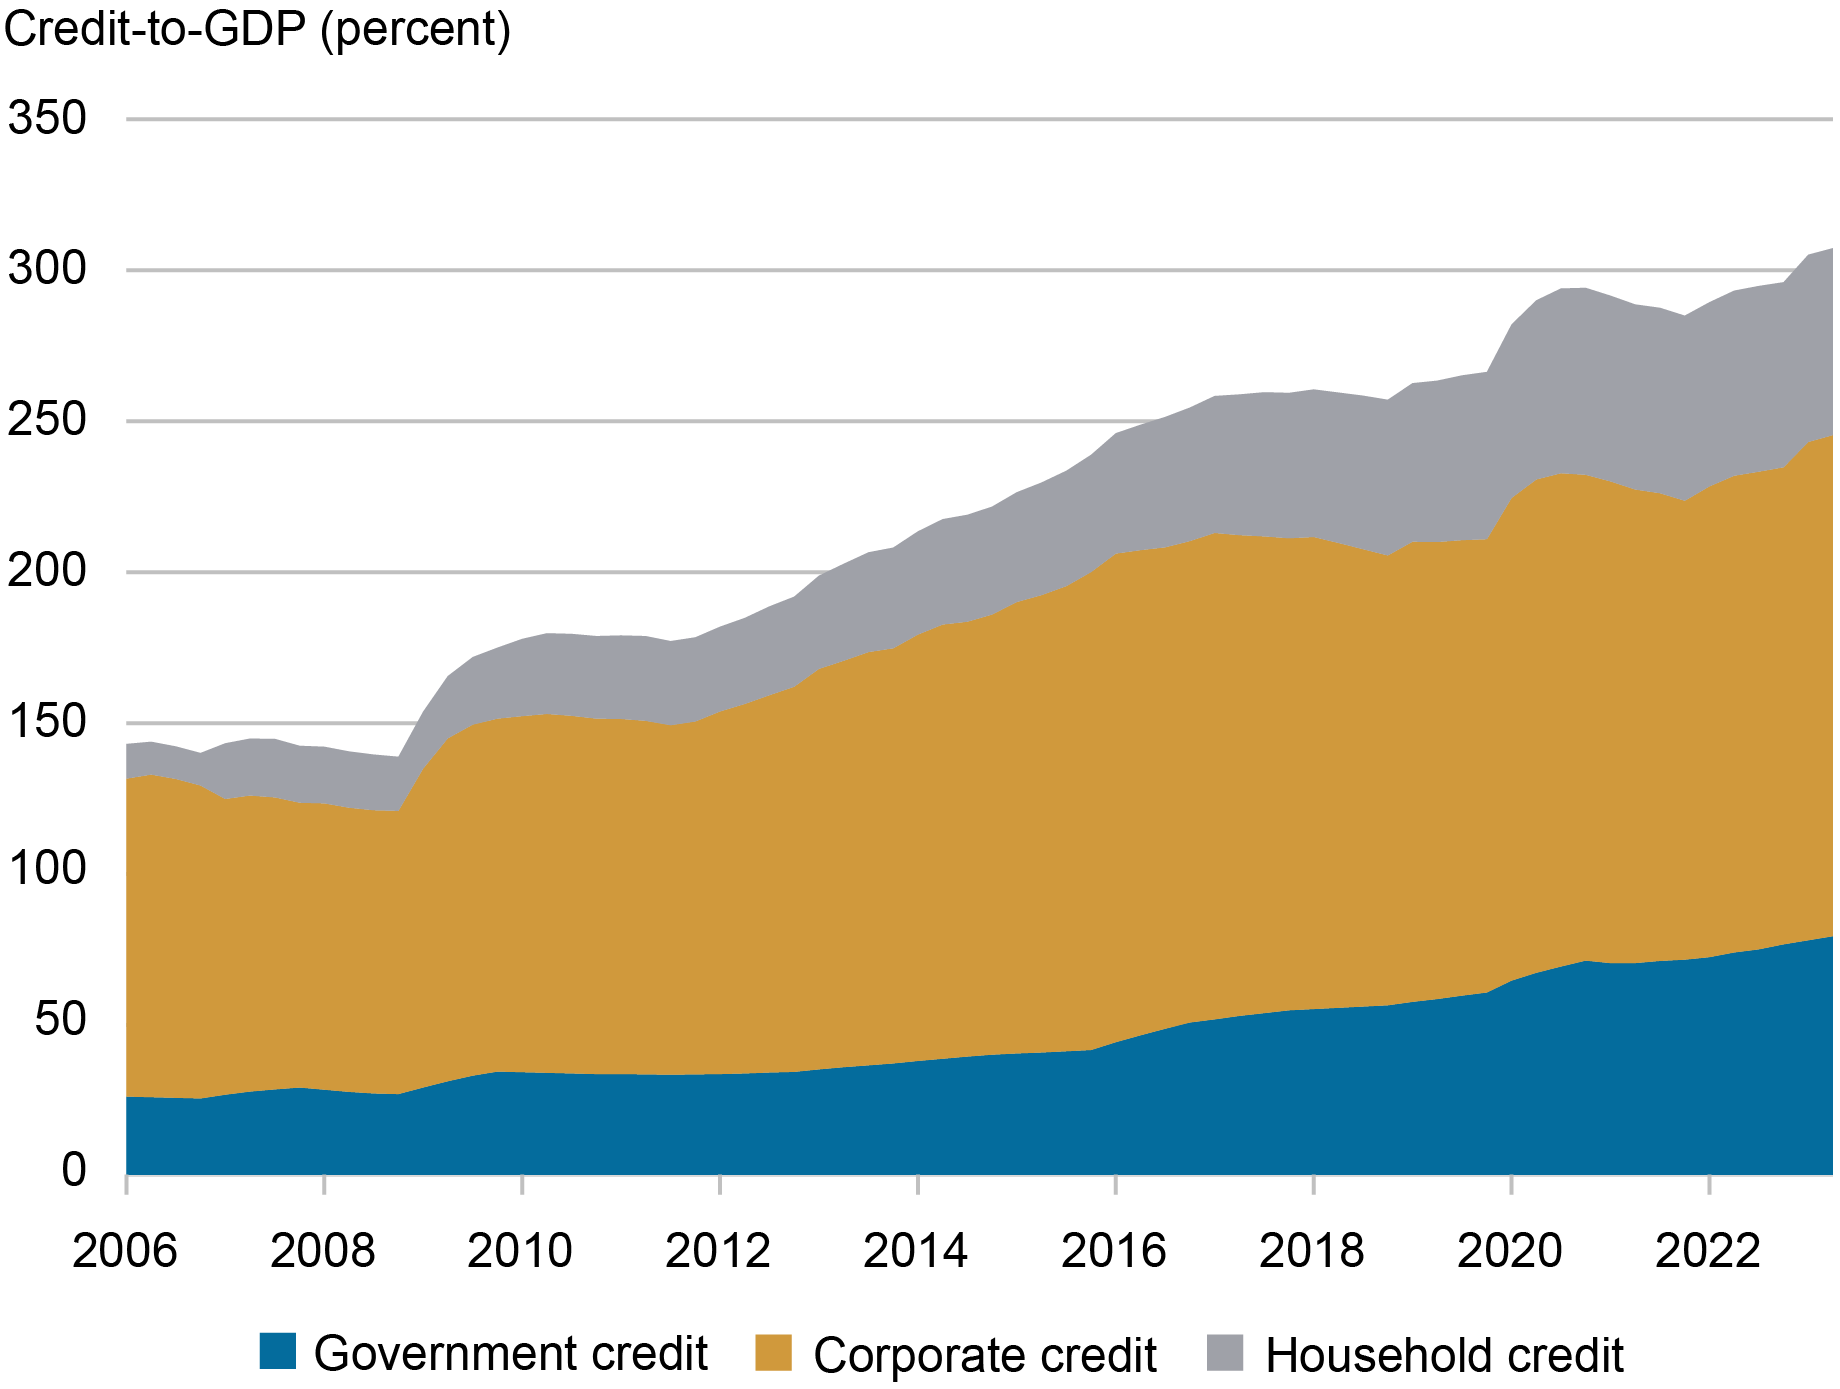
However, policy space is growing more constrained as debt continues to build. The ratio of nonfinancial sector debt to GDP surged again in 2023 and now tops 300 percent (chart below). International experience suggests that rapid debt accumulation is often a harbinger of financial crises or extended periods of sluggish economic growth. This conclusion is also backed by academic research, and explored elsewhere on Liberty Street Economics.
China’s Debt Levels Continue to Climb
The Potential for Another Leg Down in the Property Sector
The key driver for our downside scenario would be further stress in the property sector. Since late 2020, new property starts and sales have fallen by two-thirds and one-third, respectively (chart below). Lending to developers came to a nearly complete halt through the end of 2022 before modest net lending resumed when government policy on property sector lending was eased. But total active construction projects have fallen a much smaller 13 percent since peaking in 2021, with stronger state-owned or supported developers continuing work on uncompleted projects. Construction activity could fall further if stronger developers begin to face increased financial pressure.
Further stress in the property sector would amplify ongoing fiscal tightening at the local level. In this case, unique features of China’s political and economic system would work against it. Local governments have traditionally derived a large portion of their revenues from land sales, a source that dries up in a falling price environment. In turn, these fiscal pressures would undermine local governments’ ability to support developers and other local firms, including local manufacturing champions.
Could Property Sector Activity Fall Further?
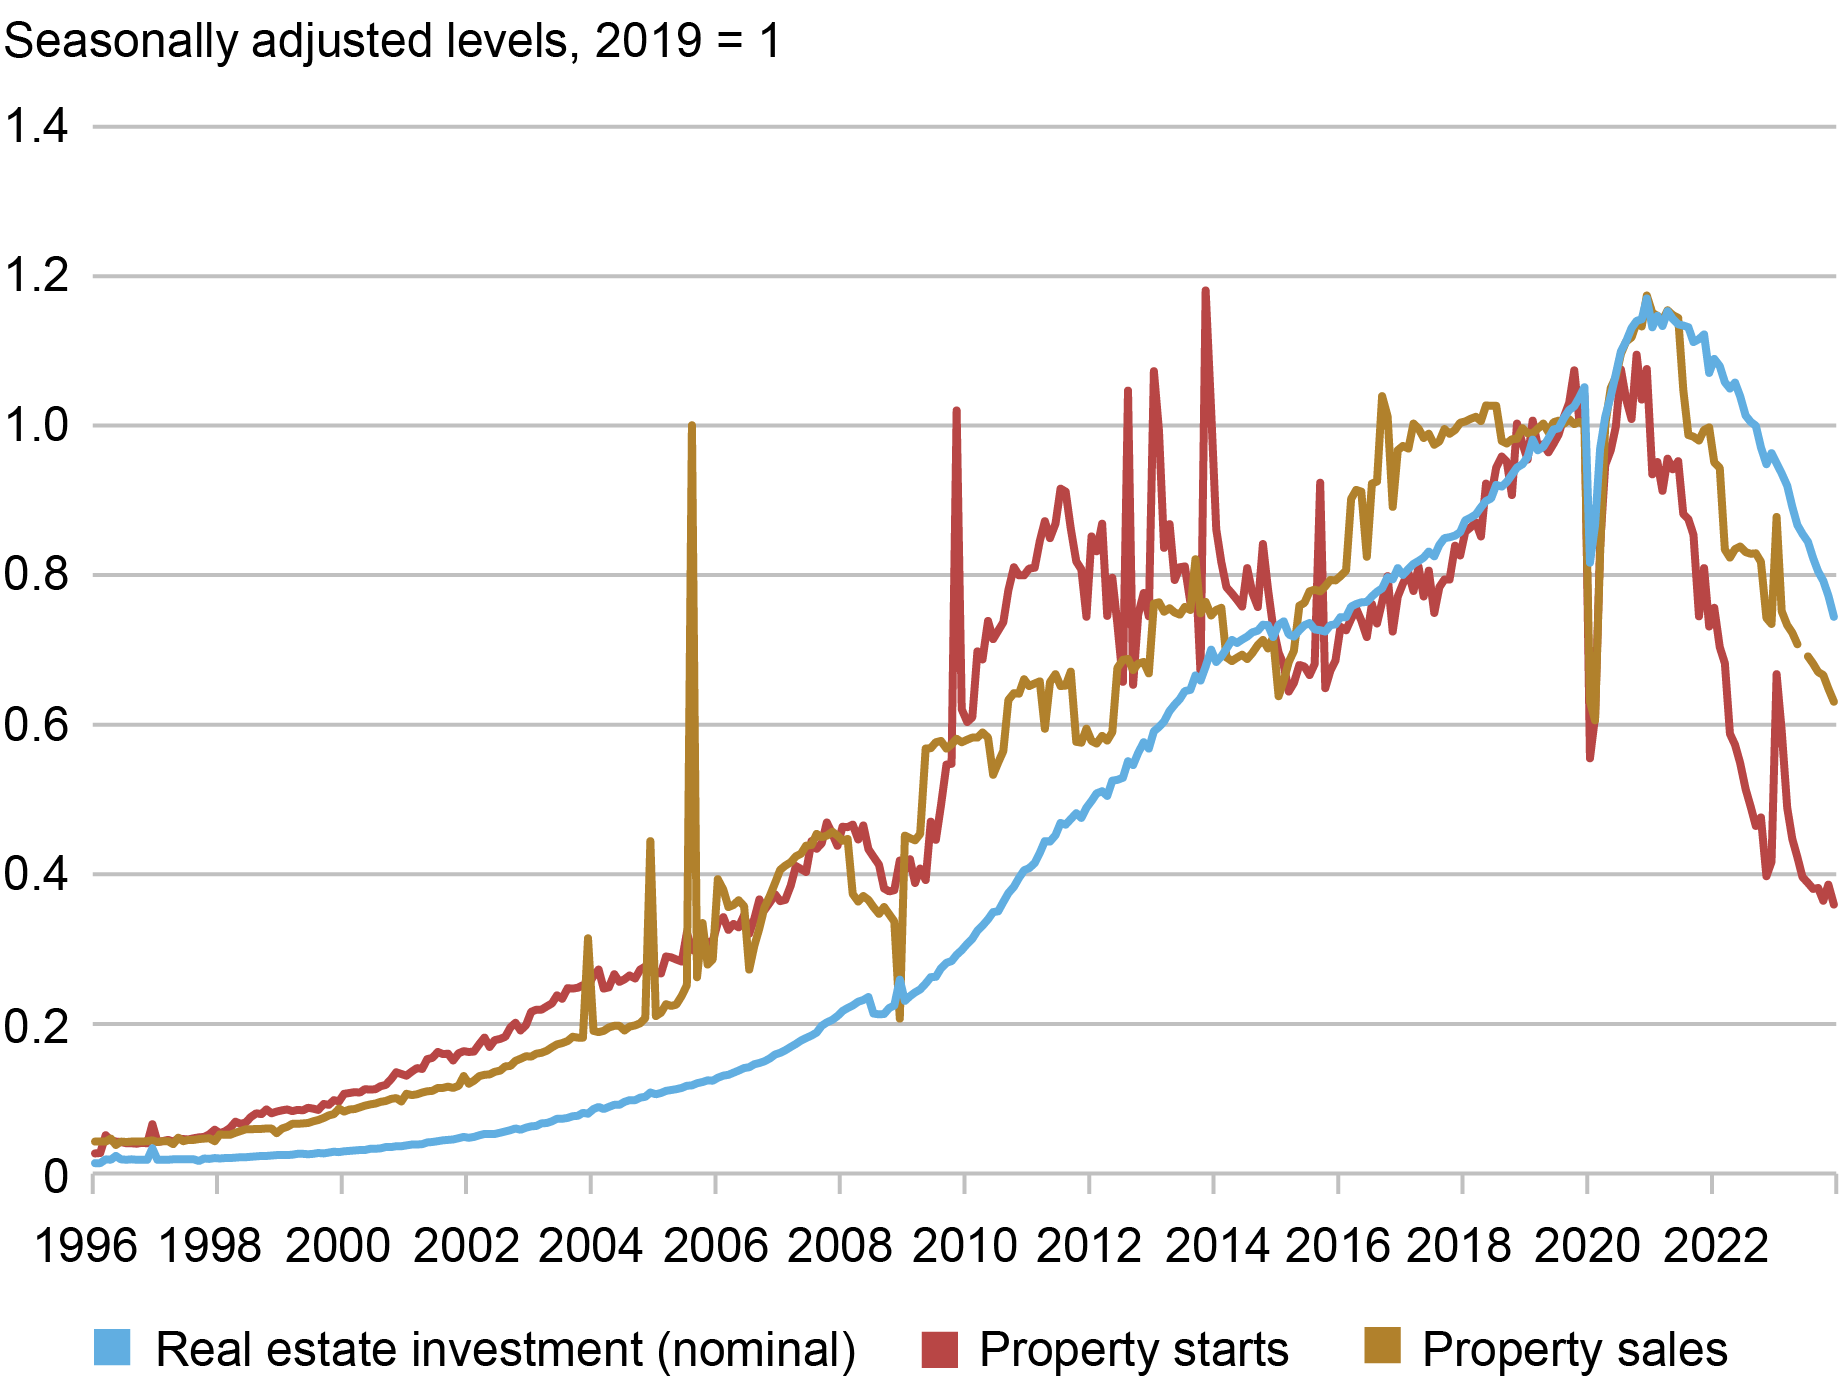
Note: Figures are calculated from official published levels.
The key role of the property sector in the Chinese economy makes troubles there a plausible trigger for an economic hard landing and financial crisis. Property-related activity accounted for roughly one-quarter of Chinese GDP before the recent slump and still represents an outsized share of activity by international standards. Property-related credit continues to account for roughly one-quarter of total debt outstanding. And property accounts for roughly two-thirds of household assets. Given this backdrop, it’s no surprise that the property slump has coincided with a severe erosion in household and business confidence.
A Downside Scenario for China and Its Implications for the U.S.
Under our property crash scenario, GDP growth in China falls to zero in 2024. This is followed by a tepid recovery to about 2 percent over the next year. This level represents dramatic underperformance relative to the International Monetary fund (IMF) baseline, which calls for growth of 4.6 percent in 2024 and 4.0 percent the following year. Credit growth (total social financing) also falls below the IMF baseline, albeit less dramatically.
To quantify the impact of this downside scenario on the U.S. economy, we rely on the Bayesian VAR model introduced in our previous post. This model is designed to capture the historical joint dynamics of the U.S. and Chinese economies. We use the estimated model relationships to construct counterfactual paths for U.S. macroeconomic aggregates while constraining Chinese output and credit growth to follow the paths in our crash scenario. As in our previous exercise, we measure scenario impacts against a baseline in which the Chinese economy evolves according to the IMF projections.
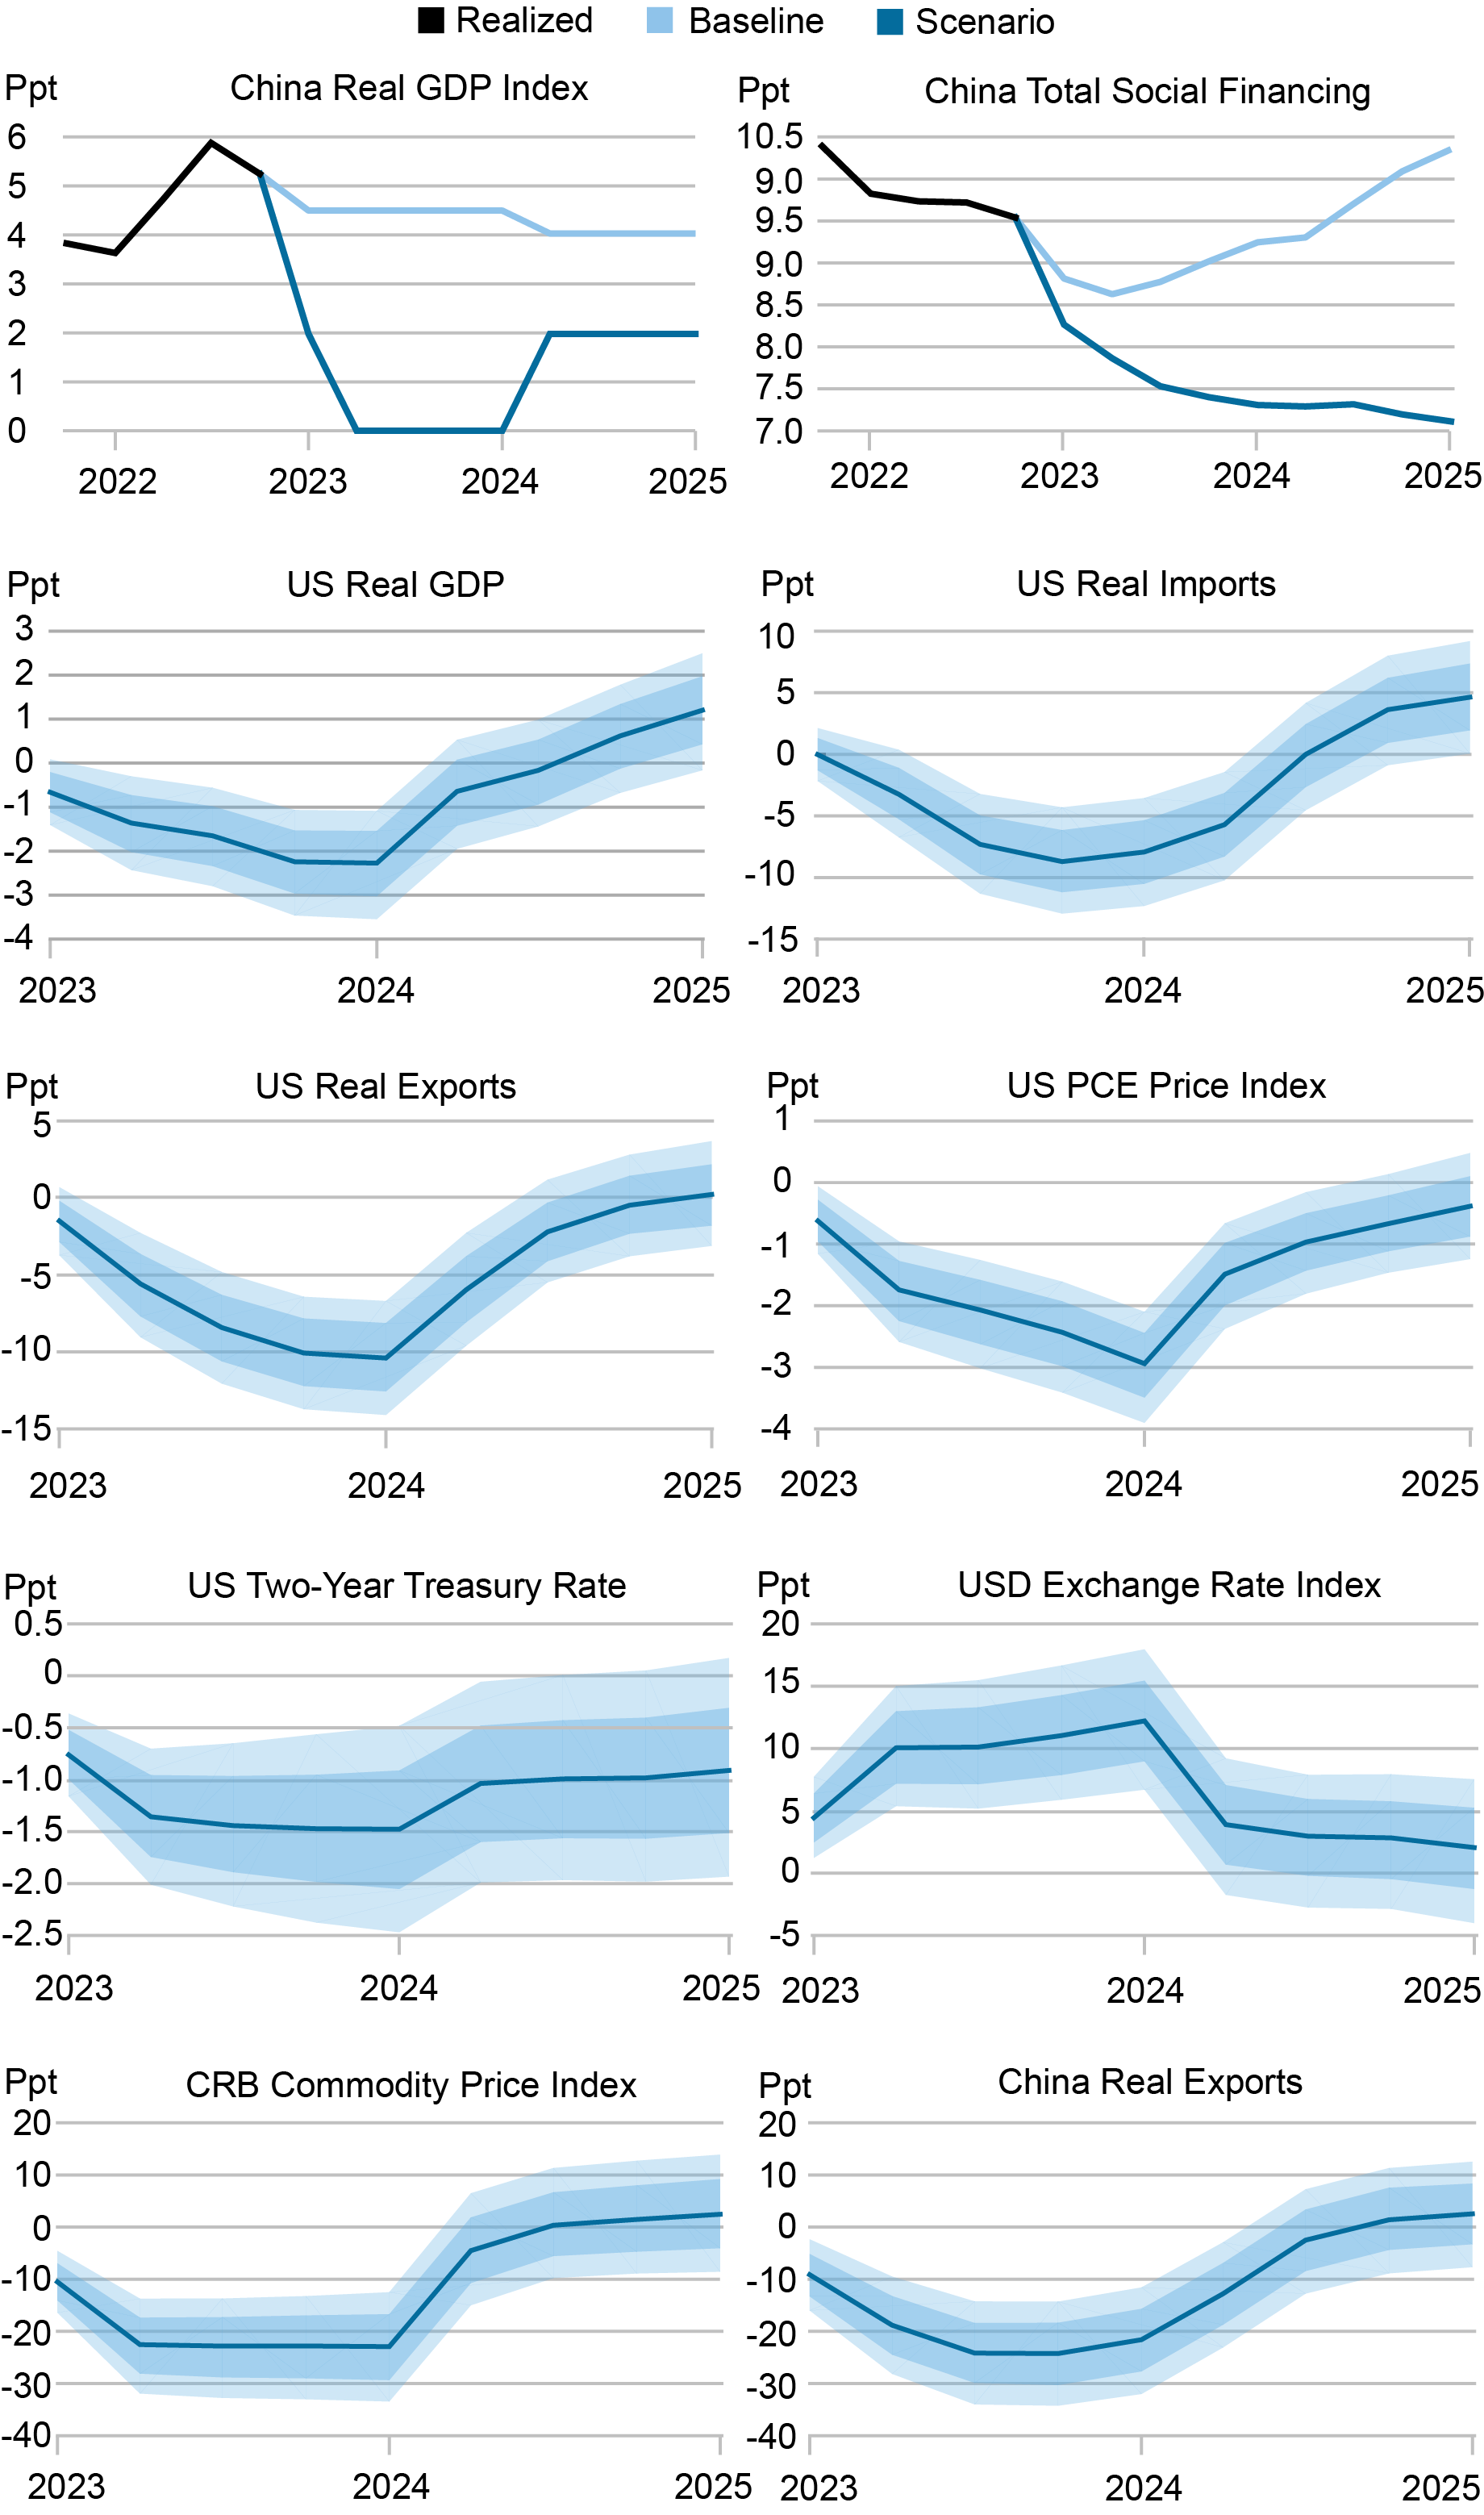
The top two panels in the chart below show the behavior of GDP and credit growth—our key conditioning variables—under the crash and baseline scenarios, reported as year-over-year percent changes. As already noted, the crash scenario involves dramatic GDP-growth underperformance relative to the baseline. The remaining panels show the implications of the crash scenario for U.S. and selected Chinese and global macro variables, measured as percentage deviations from the baseline, with the blue shading showing estimated confidence intervals.
This exercise shows that a Chinese hard landing could result in materially weaker U.S. growth and trade performance and lower U.S. inflation, with the largest impacts occurring over the first four quarters following a crash. Real GDP growth falls as much as 2 percentage points (ppt) below baseline before beginning to recover, while export volumes fall as much as 10 ppt below baseline. The PCE price index, for its part, falls some 3 ppt below baseline before crisis impacts begin to fade.
Projected Path for Key Macro Variables in a Hard Landing Scenario
The magnitude of these impacts is larger than in our earlier post premised on a manufacturing-led boom in China, consistent with the larger deviation of GDP growth from baseline. The underlying mechanisms are however the same, albeit now working in the opposite direction.
The sudden plunge in Chinese domestic demand growth leads to sharp falls in global commodity prices and Chinese exports. These impacts reflect the key role China plays in global trade and production networks. Weaker Chinese demand translates into weaker demand for China’s worldwide value chain partners, with this impact amplified by the knock-on tightening of those firms’ financing constraints. The deterioration in global trade, of course, feeds into the similar deterioration in U.S. trade volumes.
The U.S. dollar, meanwhile, sees significant appreciation, in line with its longstanding negative correlation with global commodity prices. In the context of our property crash scenario, this strength can be understood as reflecting risk-off behavior among global investors, who seek refuge in U.S. financial markets and U.S. dollar assets. The stronger dollar, in turn, contributes to a tightening in global financial conditions. In fact, the main impact of weaker Chinese demand on global financial conditions is via this indirect channel.
In short, the materialization the property crash scenario in China would tilt the balance of risks for U.S. growth and inflation to the downside. As we’ve discussed, however, the Chinese authorities appear to have adequate tools to contain new downward pressures on the country’s economy. At present, we regard the materialization of this scenario as less likely than the upside manufacturing boom scenario.
The two scenarios, of course, would carry different policy implications. A deep Chinese slowdown would contribute to lower U.S. and global inflation, likely bringing forward investor expectations for policy easing. In contrast, materially faster growth in China might add to the challenges of bringing inflation back to central bank targets, likely pushing out investor expectations for easing.

Ozge Akinci is head of International Studies in the Federal Reserve Bank of New York’s Research and Statistics Group.

Hunter L. Clark is an international policy advisor in International Studies in the Federal Reserve Bank of New York’s Research and Statistics Group.

Jeffrey B. Dawson is an international policy advisor in International Studies in the Federal Reserve Bank of New York’s Research and Statistics Group.

Matthew Higgins is an economic research advisor in International Studies in the Federal Reserve Bank of New York’s Research and Statistics Group.

Silvia Miranda-Agrippino is a research economist in International Studies in the Federal Reserve Bank of New York’s Research and Statistics Group.

Ethan Nourbash is a research analyst in the Federal Reserve Bank of New York’s Research and Statistics Group.

Ramya Nallamotu is a senior research analyst in the Federal Reserve Bank of New York’s Research and Statistics Group.
How to cite this post:
Ozge Akinci, Hunter Clark, Jeff Dawson, Matthew Higgins, Silvia Miranda-Agrippino, Ethan Nourbash, and Ramya Nallamotu, “What Happens to U.S. Activity and Inflation if China’s Property Sector Leads to a Crisis?,” Federal Reserve Bank of New York Liberty Street Economics, March 26, 2024, https://libertystreeteconomics.newyorkfed.org/2024/03/what-happens-to-u-s-activity-and-inflation-if-chinas-property-sector-leads-to-a-crisis/
BibTeX: View |


Disclaimer
The views expressed in this post are those of the author(s) and do not necessarily reflect the position of the Federal Reserve Bank of New York or the Federal Reserve System. Any errors or omissions are the responsibility of the author(s).
 RSS Feed
 Follow Liberty Street Economics