


While the slump in China’s property sector has been steep, Chinese policymakers have responded to the falloff in property activity with policies designed to spur activity in the manufacturing sector. The apparent hope is that a pivot toward production-intensive growth can help lift the Chinese economy out of its current doldrums, which include weak household demand, high levels of debt, and demographic and political headwinds to growth. In a series of posts, we consider the implications of two alternative Chinese policy scenarios for the risks to the U.S. outlook for real activity and inflation over the next two years. Here, we consider the impact of a scenario in which a credit-fueled boom in manufacturing activity produces higher-than-expected economic growth in China. A key finding is that such a boom would put meaningful upward pressure on U.S. inflation.
A Surge in Bank Lending to Manufacturing
The shift in China’s policy focus is evident in recent credit trends. While aggregate bank lending growth has remained relatively stable, lending has been redirected from the property sector and toward the manufacturing sector. Indeed, as shown in the chart below, the growth rate for new industrial lending has roughly quintupled since 2020 and has doubled in just the last eighteen months. Growth in new “green loans”—which overlap with other sectors but are heavily concentrated in manufacturing—has picked up even more dramatically. Growth in new lending for property-related activity, meanwhile, has fallen to near zero.
A Notable Rotation in Credit Allocation
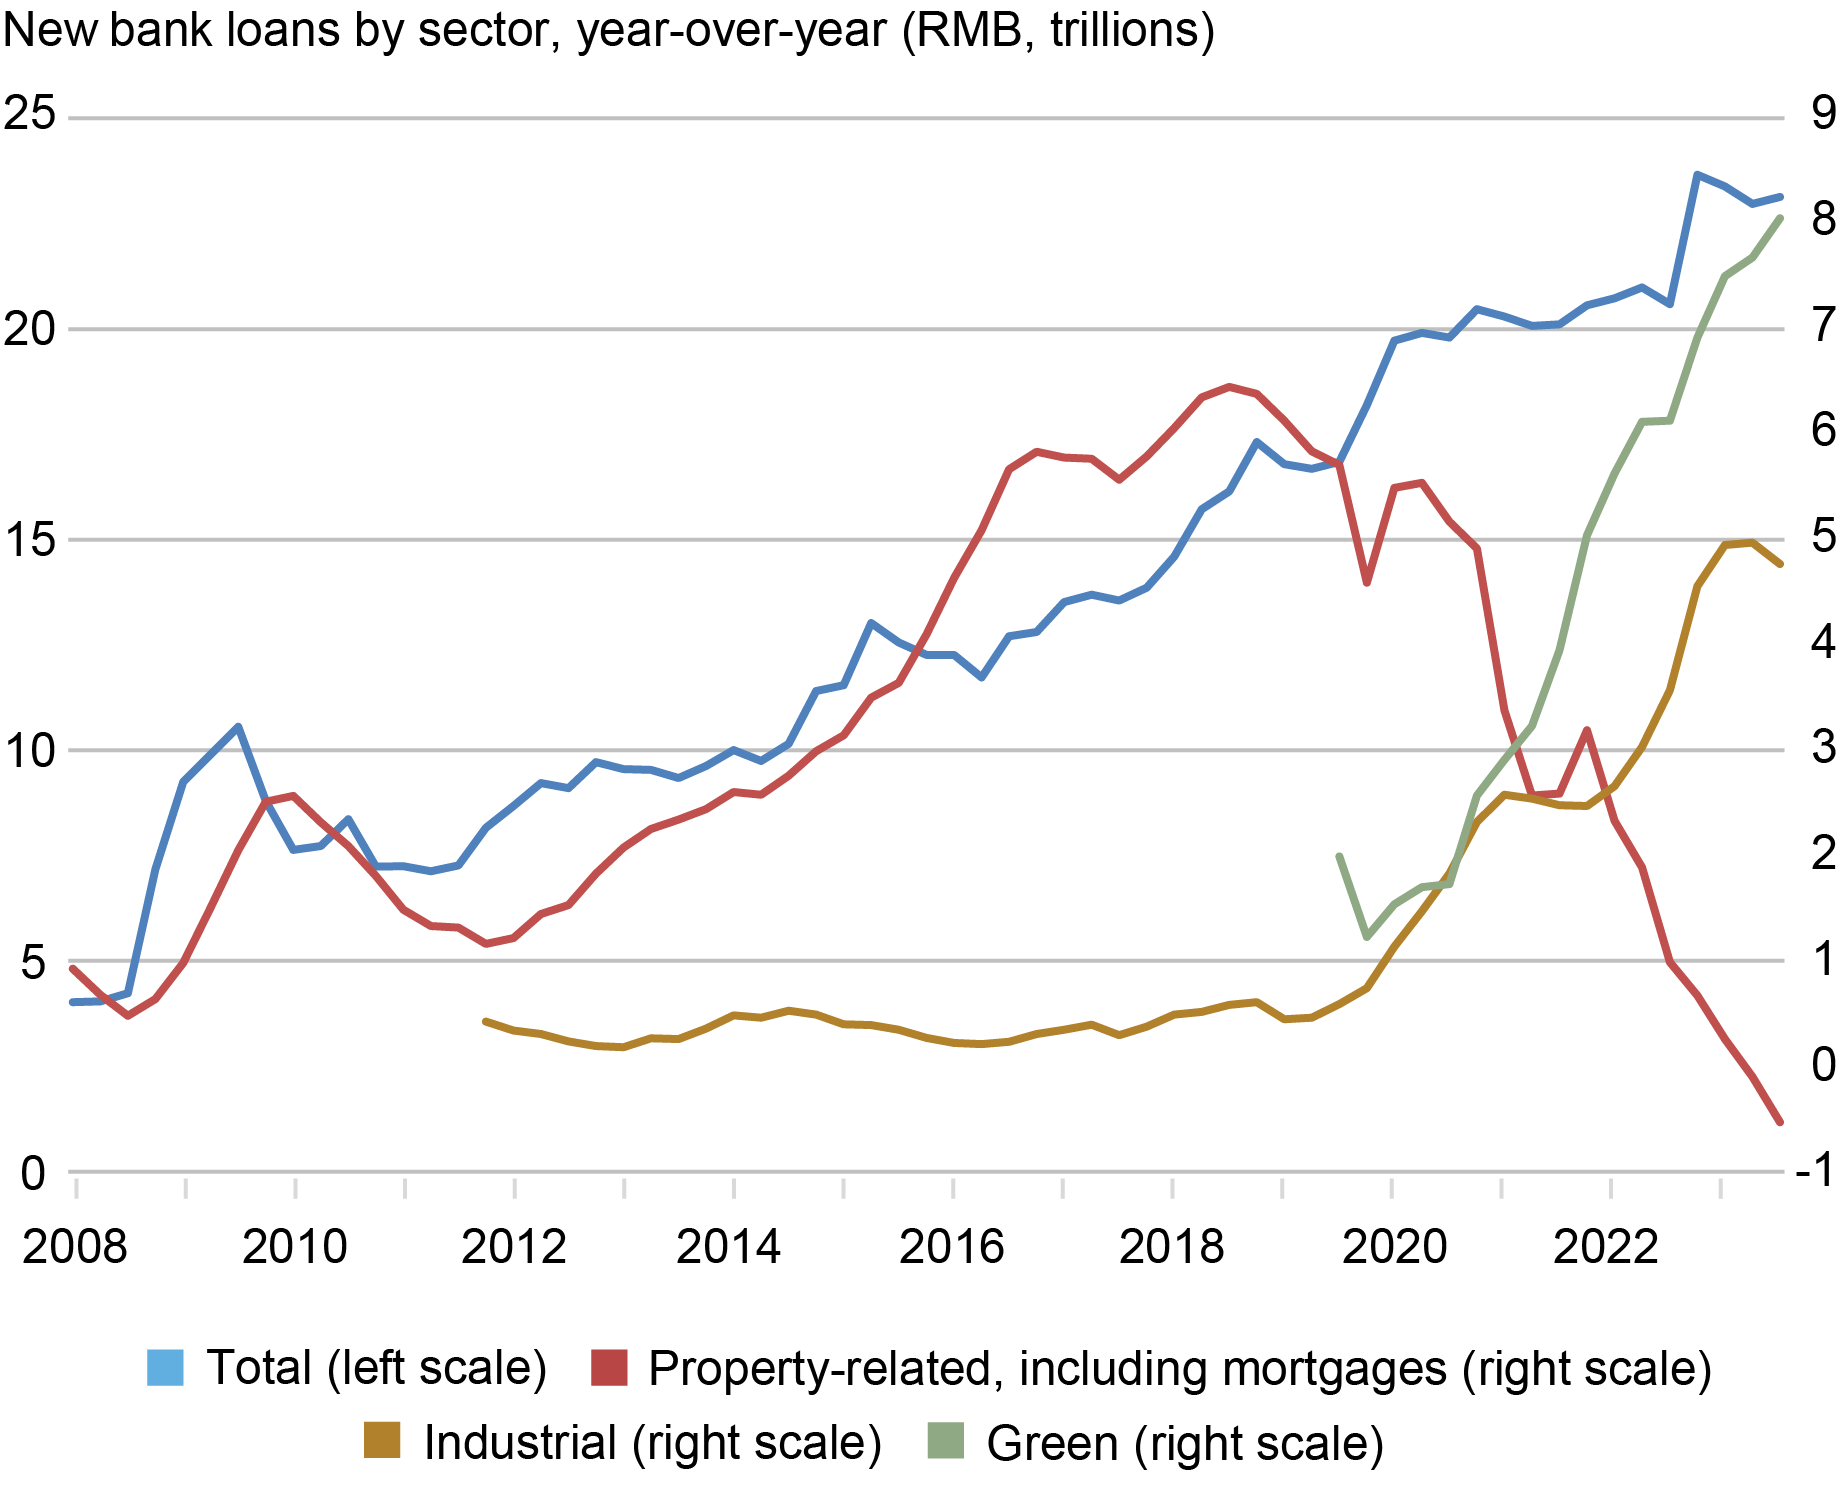
Note: China’s classification of “green” overlaps with other sectors. It is shown for illustrative purposes.
To be sure, official credit data by sector and firm in China are limited and imprecise. For example, authorities have discontinued credit data comparing state-owned enterprises and privately owned firms. Analysis of publicly listed Chinese banks’ quarterly reports, however, also shows a notable increase in lending to the manufacturing sector over the past eighteen months. According to data from fifty publicly listed Chinese banks (accounting for roughly three-quarters of aggregate credit), growth in bank lending to manufacturing came to 18 percent year-over-year in 2022. The data in hand for 2023 suggest new manufacturing lending could have accounted for one-third of total lending last year. Private equity and venture capital investment trends in China mirror this shift.
The redirection in lending comes on top of existing financial incentives for high-tech manufacturing industries, including electric vehicles, lithium batteries, solar panels, and semiconductors. In some cases, these incentives have recently been sweetened. Last September, for example, authorities announced the creation of a new state-backed investment fund to boost development of the semiconductor sector. And while purchase subsidies for electric vehicles were phased out at the end of 2022, tax exemptions on both the purchase and production side have been retained.
The redirection in lending is also consistent with a notable shift in the Chinese leadership’s official rhetoric on industrial policy, which now emphasizes the pursuit of economies of both scope and scale. For strategic as much as economic reasons, China’s government aims to keep all aspects of the value chain in China, preserving and improving competitiveness in a wide range of industries, not just specializing in the most profitable ones. In President Xi’s words at the May 2023 meeting of the Central Commission on Economic and Financial Affairs, the industrial system should be “complete, advanced, and secure.”
An Upside Scenario for Growth in China and Its Implications for the U.S.
We now consider the implications of a scenario in which the state-directed credit support for the manufacturing sector is successful in reviving China’s near-term economic fortunes, generating a period of above-trend, production-intensive growth. Under the scenario, China’s GDP growth increases to 6 percent over the next two years, up from officially reported growth of 5.2 percent in 2023 and 4.9 percent in 2022. Growth under the scenario also exceeds the International Monetary Fund (IMF) baseline, which calls for GDP growth of 4.6 percent in 2024 and 4.0 percent in 2025. As we discuss below, we believe any period of manufacturing-led growth would prove unsustainable over the medium term—thus our characterization of the scenario as involving a “sugar high.”
We assess the implications of the scenario for the U.S. by comparing it with the IMF baseline. The key assumptions for calibration of the scenario involve the relationship between GDP growth and aggregate credit growth. We measure aggregate credit growth by total social financing (TSF), a broad measure of lending that includes shadow finance. (Our measure of TSF differs from China’s official measure by adjusting for local government bond redemptions and stripping out equity issuance, loan write-offs, and central government bonds.) Using our aggregate credit measure, we can calculate an implied “credit impulse,” the flow of new credit relative to GDP. This allows us to gauge the boost to growth consistent with the assumed scale of official monetary and quasi-fiscal stimulus. Given our calibration, aggregate credit growth would need to rise to 12 percent over the next two years from the recent 9.5 percent to generate the sugar high growth path. This generates an outsized rise in the associated credit impulse, totaling about 7 1/2 percentage points.
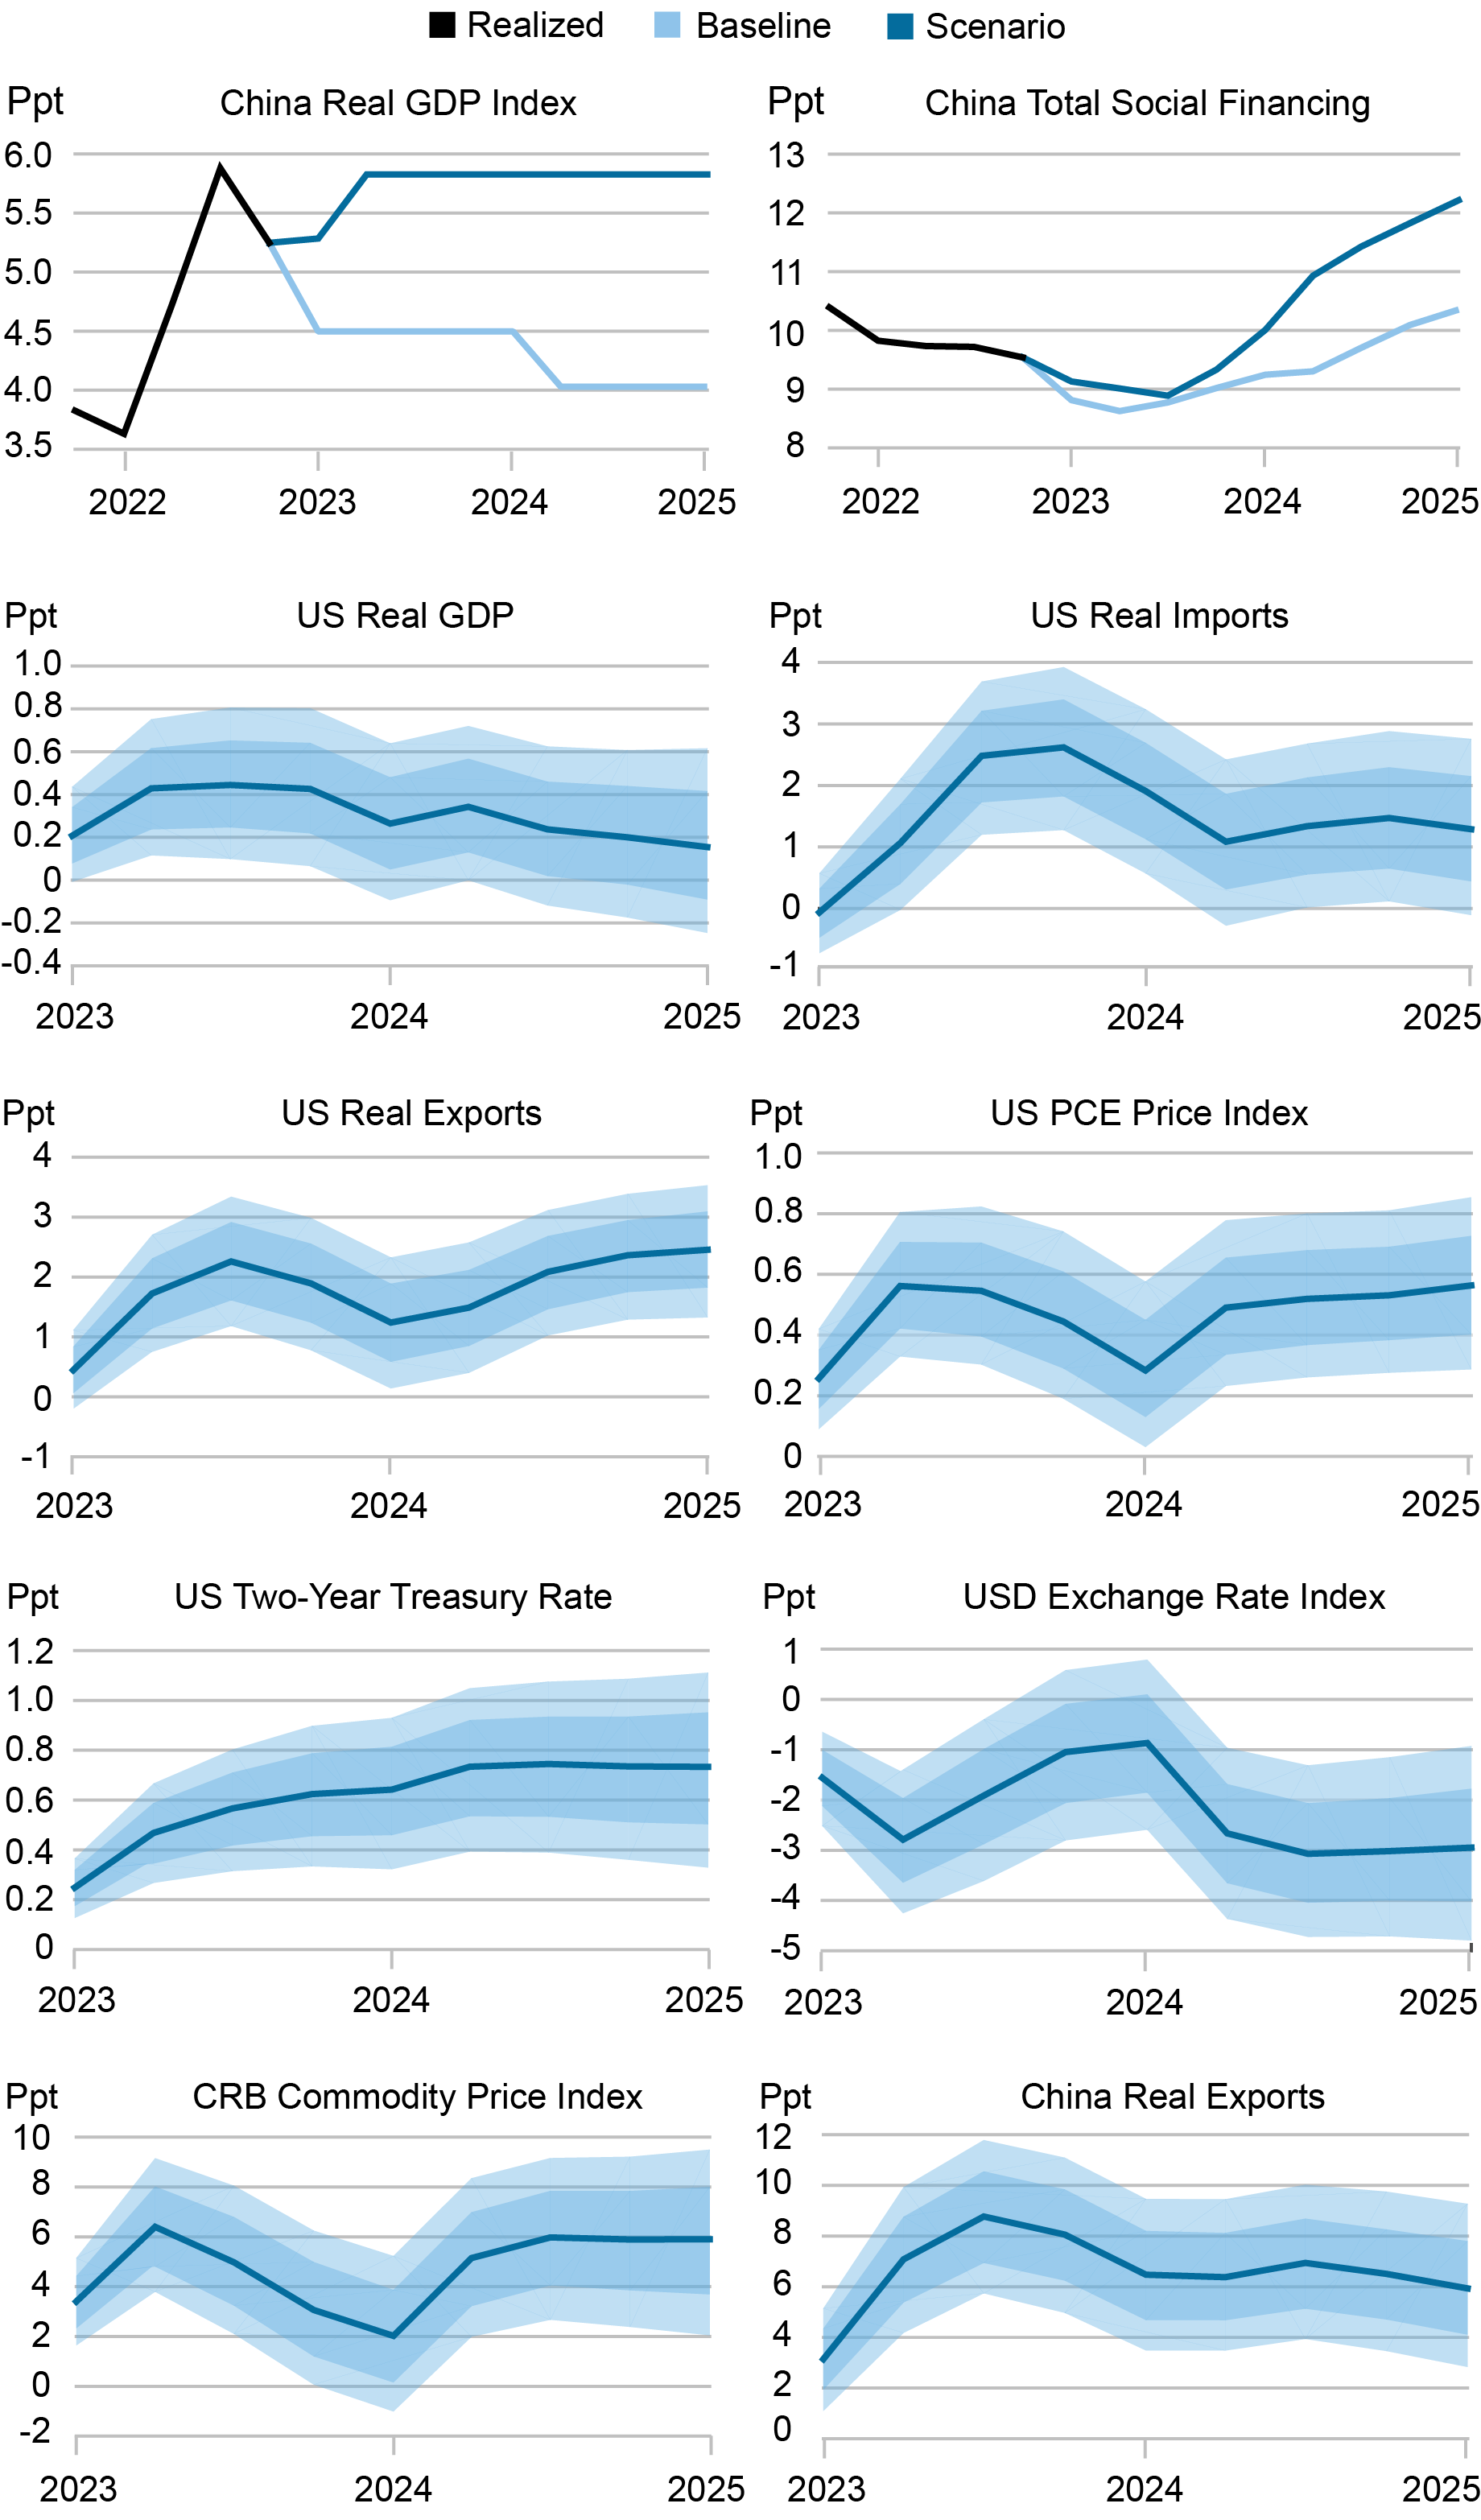
To quantify the implications of the sugar high scenario for the U.S. outlook, we rely on a Bayesian vector autoregression (VAR) that includes both Chinese and U.S. macro aggregates. Given the historical relationships among these variables, the VAR allows us to generate conditional paths for the variables of interest consistent with the sugar high and IMF baseline paths for GDP and TSF (the top two panels in the chart below). The difference between the projected conditional paths under the two simulations gives our measure of sugar high impacts. The results are reported in year-on-year percentage growth rates, together with associated error bands (the bottom eight panels in the chart below).
A “Sugar High” Scenario Could Generate Persistently Higher Inflation in the U.S.
It is worth stressing that the IMF baseline projection already assumes a rather optimistic outlook. Indeed, our VAR estimates imply that a 2 1/2 percentage point increase in the credit impulse from its 2023 level would be needed to generate growth at this pace.
Our exercise shows that the materialization of this upside scenario could generate persistently higher inflation in the U.S. over the next two years. This implication owes to the importance of the Chinese economy in global manufacturing. (China accounts for some 30 percent of global manufacturing value added and an even larger share of intermediate production.) The boost in Chinese demand generates higher demand for foreign goods, including both final goods and intermediate inputs. This pushes up U.S. exports while generating significant upward pressure on global commodity and intermediate goods prices. Absent new restrictions on international trade, Chinese exports increase persistently and substantially, adding to the increase in global trade volumes. The boost to commodity prices and global trade volumes is accompanied by a weakening of the U.S. dollar.
These factors—higher commodity and intermediate goods prices together with a weaker dollar—contribute to increased U.S. producer price inflation. This in turn leads to higher PCE inflation, which under our calibration remains persistently above the IMF growth baseline by about 0.5 percentage point. This finding is at odds with the apparent conventional wisdom, which holds that a manufacturing-led expansion in China would be disinflationary for the U.S. To be sure, an increase in the supply of Chinese manufactures would tend to lower prices for these goods. But this reasoning ignores the pressures that increased Chinese production would place on global commodity markets and the broader manufacturing supply chain. Our estimates and calibration imply that, based on historical comovements, these upward pressures would dominate.
The impact on U.S. GDP growth would also be positive, but it would be somewhat smaller and would fade more quickly. In short, the materialization of the sugar high scenario would persistently tilt the balance of risks for U.S. inflation to the upside. At the current juncture, such an impetus to inflation could potentially delay market expectations for policy easing.
Limits to Sustained Manufacturing-Led Growth
A manufacturing sugar high represents a plausible account of how China’s growth might exceed consensus expectations in the near term. (This assumes of course that the authorities succeed in stabilizing the property sector.) But redoubled policy support for manufacturing is unlikely to provide the right nutrition for longer-term development. China’s economy is already heavily manufacturing oriented, with the share of manufacturing in GDP at 28 percent, above the global 95th percentile, as illustrated on the left panel of the chart below. Given the country’s size, this translates into an already outsized presence in the global manufacturing ecosystem, at some 30 percent of global manufacturing output and 20 percent of global exports (right panel of the chart). Most important, the goal of maintaining a “complete” manufacturing ecosystem amounts to a commitment to subsidize low-return, labor-intensive industries where China no longer enjoys a comparative advantage. The risk for China is that a sustained focus on manufacturing will lead to low returns and a new cycle of bad debt.
China: Large and In Charge
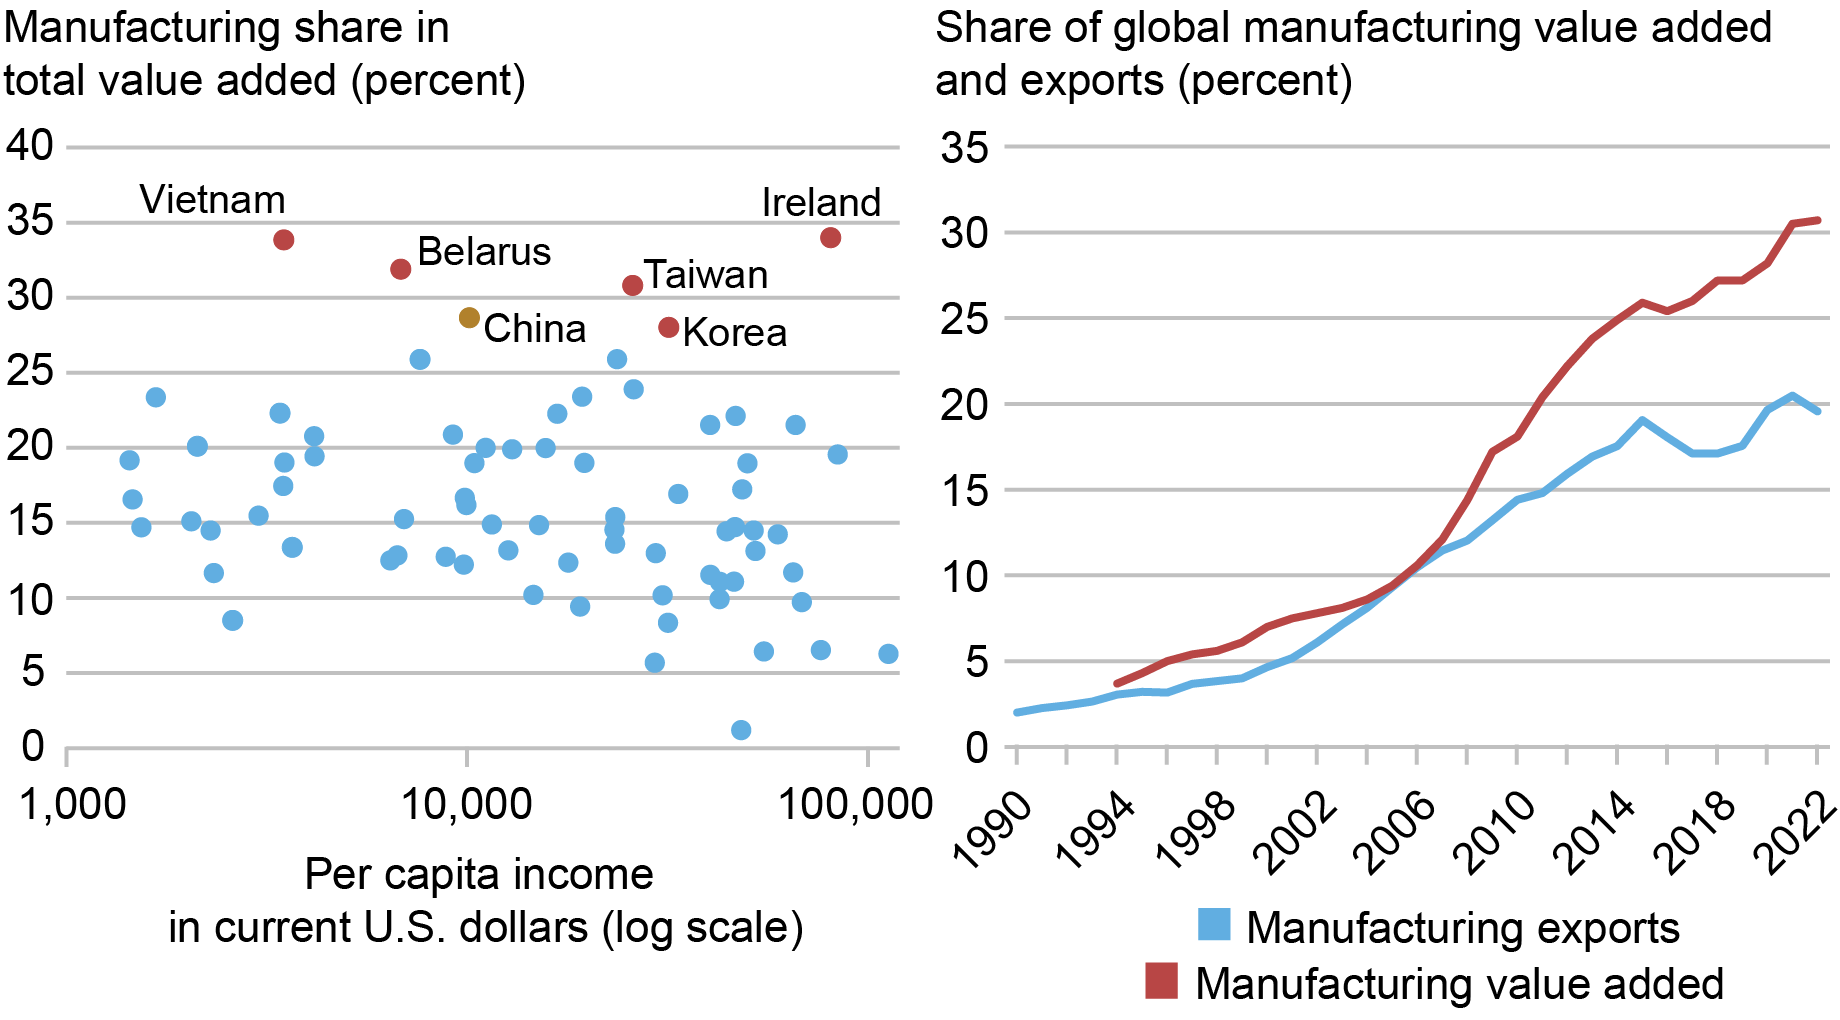
Note: Data in left panel refer to 2019.
The scope for manufacturing-led growth will also be limited by trading partners’ willingness to absorb a new flood of Chinese products. In this connection, China’s manufacturing trade surplus now stands at a massive $1.6 trillion, more than 10 percent of GDP. Complaints that China is dumping excess capacity on the rest of the world have been a commonplace in global policy debates, stretching from steel in the 2000s to solar panels, autos, and lithium batteries more recently. Continued growth in China’s manufacturing trade surplus would likely accelerate trading partners’ efforts to protect local markets. Notably, our sugar high scenario assumes that there will be no new restrictions over the near term.

Ozge Akinci is head of International Studies in the Federal Reserve Bank of New York’s Research and Statistics Group.

Hunter L. Clark is an international policy advisor in International Studies in the Federal Reserve Bank of New York’s Research and Statistics Group.

Jeffrey B. Dawson is an international policy advisor in International Studies in the Federal Reserve Bank of New York’s Research and Statistics Group.

Matthew Higgins is an economic research advisor in International Studies in the Federal Reserve Bank of New York’s Research and Statistics Group.

Silvia Miranda-Agrippino is a research economist in International Studies in the Federal Reserve Bank of New York’s Research and Statistics Group.

Ethan Nourbash is a research analyst in the Federal Reserve Bank of New York’s Research and Statistics Group.

Ramya Nallamotu is a research analyst in the Federal Reserve Bank of New York’s Research and Statistics Group.
How to cite this post:
Ozge Akinci, Hunter Clark, Jeff Dawson, Matthew Higgins, Silvia Miranda-Agrippino, Ethan Nourbash, and Ramya Nallamotu, “What if China Manufactures a Sugar High?,” Federal Reserve Bank of New York Liberty Street Economics, March 25, 2024, https://libertystreeteconomics.newyorkfed.org/2024/03/what-if-china-manufactures-a-sugar-high/
BibTeX: View |


Disclaimer
The views expressed in this post are those of the author(s) and do not necessarily reflect the position of the Federal Reserve Bank of New York or the Federal Reserve System. Any errors or omissions are the responsibility of the author(s).
 RSS Feed
 Follow Liberty Street Economics
Are you ignoring the RMB devaluation that would be required for China to goose credit growth to 12.5%. The market is already revolting from being force-Fed more M2 liabilities created to fund continued malinvestment.
If inflation is at all times too much money too few goods, China’s increase in production would be the opposite and reduce inflation.
This is not an unusual phenomenon in a country’s economy. America had experienced more serous economic downturn in July 2008 precipitated mainly by huge home loan scamp. Obviously the Chinese economy had to turn its muzzle from the housing sector to the industrial sector of the economy. I’m afraid, because that of the USA’s unprecedented recession for the similar reason, the Chinese economy may also have to face the like-situation! This will as well affect the linkage enterprises adversely at home and plenty of other countries’ economies that are closely linked through international trade and transactions with China including the economy of the USA. The USA and China are considered to be the growth engine of the global economy. Elsewhere Global finance officials systematically defended their efforts to free trade and closer international links against the rising tide of populism. Former world Bank President, Jim Yong Kim said “It often feels like our increasingly interconnected world is in fact falling apart and countries and people are pulling away from each other”. He further said “….what affects one city, one country, one region can have immediate and lasting impacts on us all.”