


A perennial challenge with China’s growth model has been overly high investment spending relative to GDP and unusually low consumer spending, something which China has long struggled to rebalance. As China attempts to move away from credit-intensive, investment-focused growth, the economy’s growth will have to rely on higher consumer spending. However, a prolonged household borrowing binge, COVID scarring and a deep slump in the property market in China have damaged household balance sheets and eroded consumer sentiment. In this post, we examine the impact of recent shocks on Chinese household behavior for clues around the outlook for reviving consumption and economic growth in China.
Consumption and Household Balance Sheets
China’s long delayed emergence from COVID lockdowns in late 2022 led to speculation that there would be a sizable jump in consumption in 2023. Consumer spending did increase over the first half of the year, but only modestly, meaning China’s “revenge spending” has, thus far, been muted.
Over the ten years preceding the start of COVID, households binged on debt, primarily fueled by China’s property boom. Unbridled growth in household borrowing averaged over 25 percent annually from 2009-19. As a result of prolonged robust borrowing, household debt increased rapidly, now accounting for 62 percent of GDP. This pushed household debt in China to levels that are quite high by developing country standards, raising concerns around stretched household balance sheets—particularly among lower income cohorts.
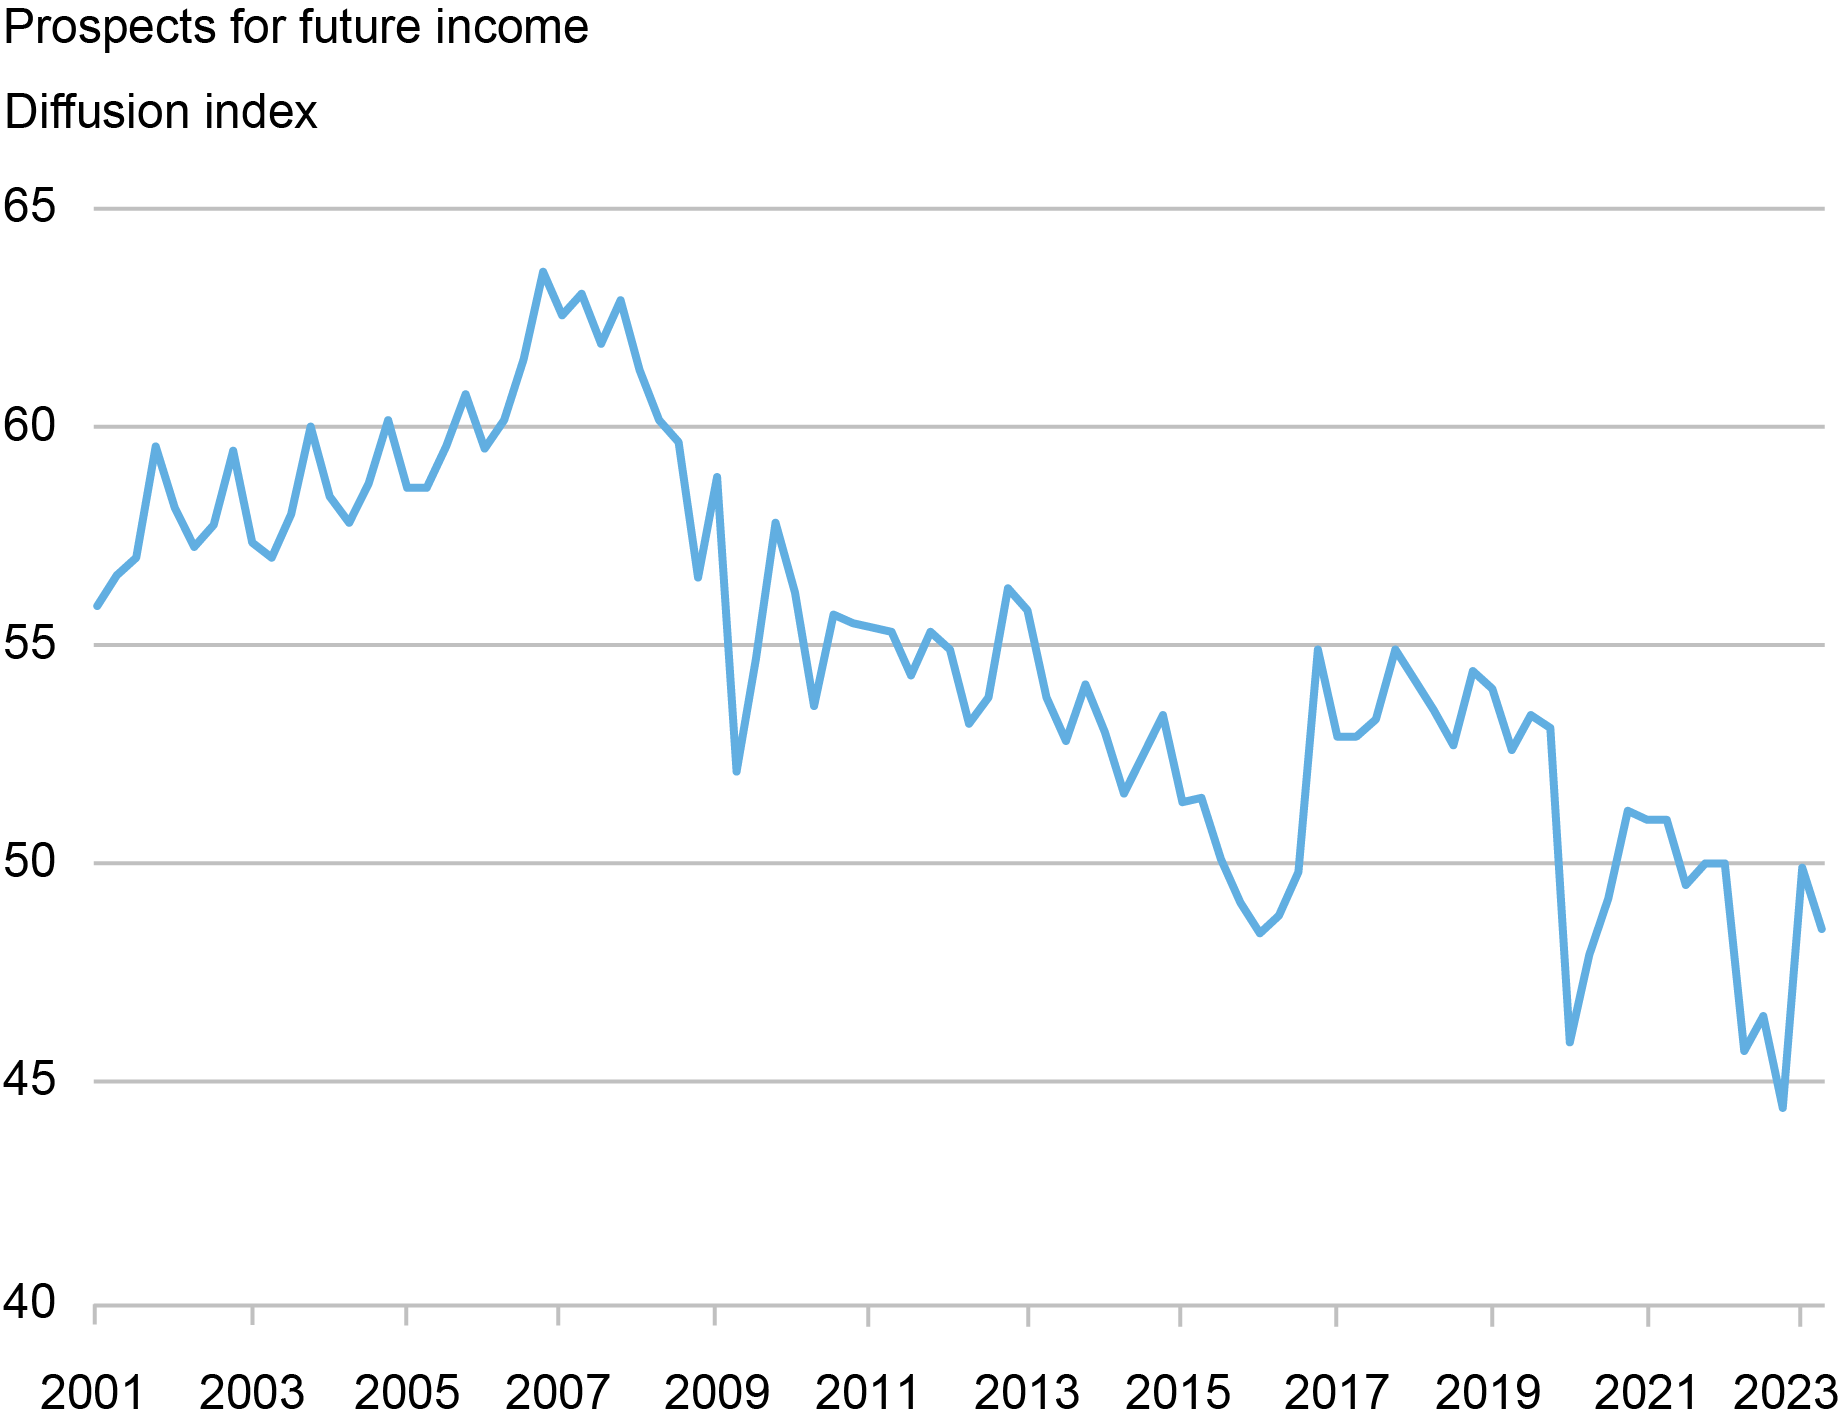
Extended pandemic lockdowns in China further exacerbated balance sheet damage among the most vulnerable households impacted by the collapse in economic activity, job losses, pay cuts, and a weaker social safety net. While households’ pessimism around the future has been declining for some time, recent surveys show households’ confidence in the outlook for future income gains hovering near the lowest level on record (see chart below). China’s younger generations, which have traditionally helped fuel the country’s consumption spending, have been particularly hard hit; youth unemployment rose to a historic high of 21.3 percent in June, before the government stopped publishing the data. Government restrictions on China’s vibrant private sector, where recent college graduates typically find jobs, has also undermined confidence in the future.
Confidence Survey Shows Optimism about the Future Has Eroded
Property as the Biggest Household Asset
Chinese households endured the longest pandemic lockdowns in the world and, in August 2020, the government prioritized curbing excesses in the property sector. These factors contributed to the collapse of a major property developer, and the resulting property sector crisis about a year later. Indicators of housing activity have been in virtual freefall (as illustrated in the left panel of the next chart), with starts data pointing to a continued decline in residential investment spending in the near term. Property is the most important store of wealth for households in China, accounting for roughly two-thirds of household assets. Homeownership is also high in China, with over 80 percent of households owning a home.
China’s Housing Market Has Slowed; Few Households See Home Prices Rising
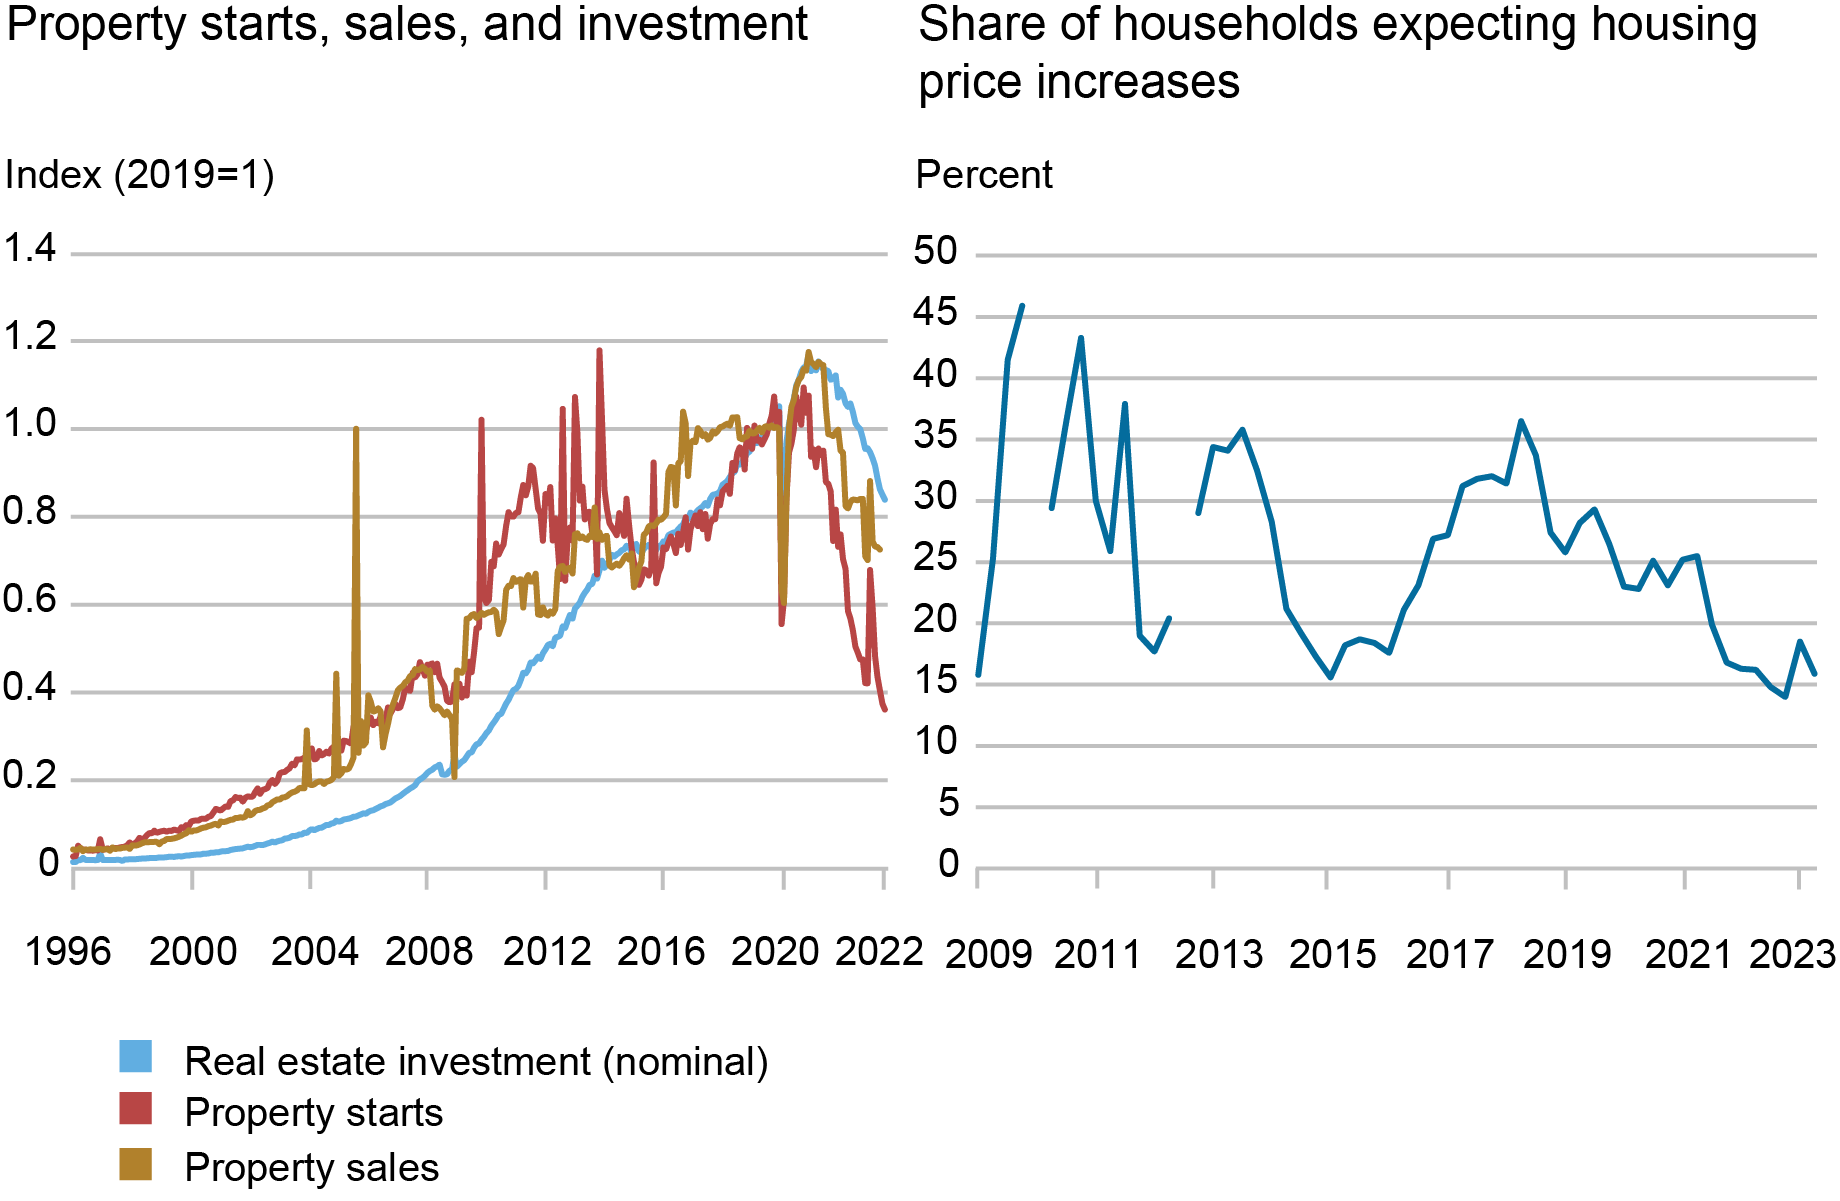
Note: Data in left panel are seasonally adjusted.
Skepticism surrounds official property price statistics, which can be distorted by government price controls. Official data suggest only a modest fall in nationwide property prices, but there is significant divergence across city tiers and regions, with some estimates noting that prices have fallen by roughly 20 percent in lower-tier cities. Chinese sentiment has shifted notably with fewer households assuming prices will continue to rise. The right panel of the chart above shows the most recent People’s Bank of China quarterly household survey where household expectations for price rises are close to all-time lows. Property developers’ struggles to complete construction of pre-sold properties and related financial distress of developers have also increased the risks around buying a new home.
Chinese authorities’ efforts to revive demand for new homes have failed to tempt homebuyers back to the market. The central bank has cut interest rates to the lowest level on record and reduced a range of macroprudential measures. However, unlike in past property cycles, policy easing has not led to increases in home sales.
Households Are Increasingly Risk Averse
With all this, households have responded by paying down their mortgage debt. As of July 2023, mortgage loans accounted for over 50 percent of total household debt ($6 trillion and a third of GDP). Over the past year, the amount of mortgage loans outstanding has declined for the first time ever in China as households have prioritized mortgage repayments. Note that other forms of consumer credit have also slowed sharply as highlighted in the left panel of the chart below.
Households Have Stopped Borrowing, while Savings Deposits Have Surged
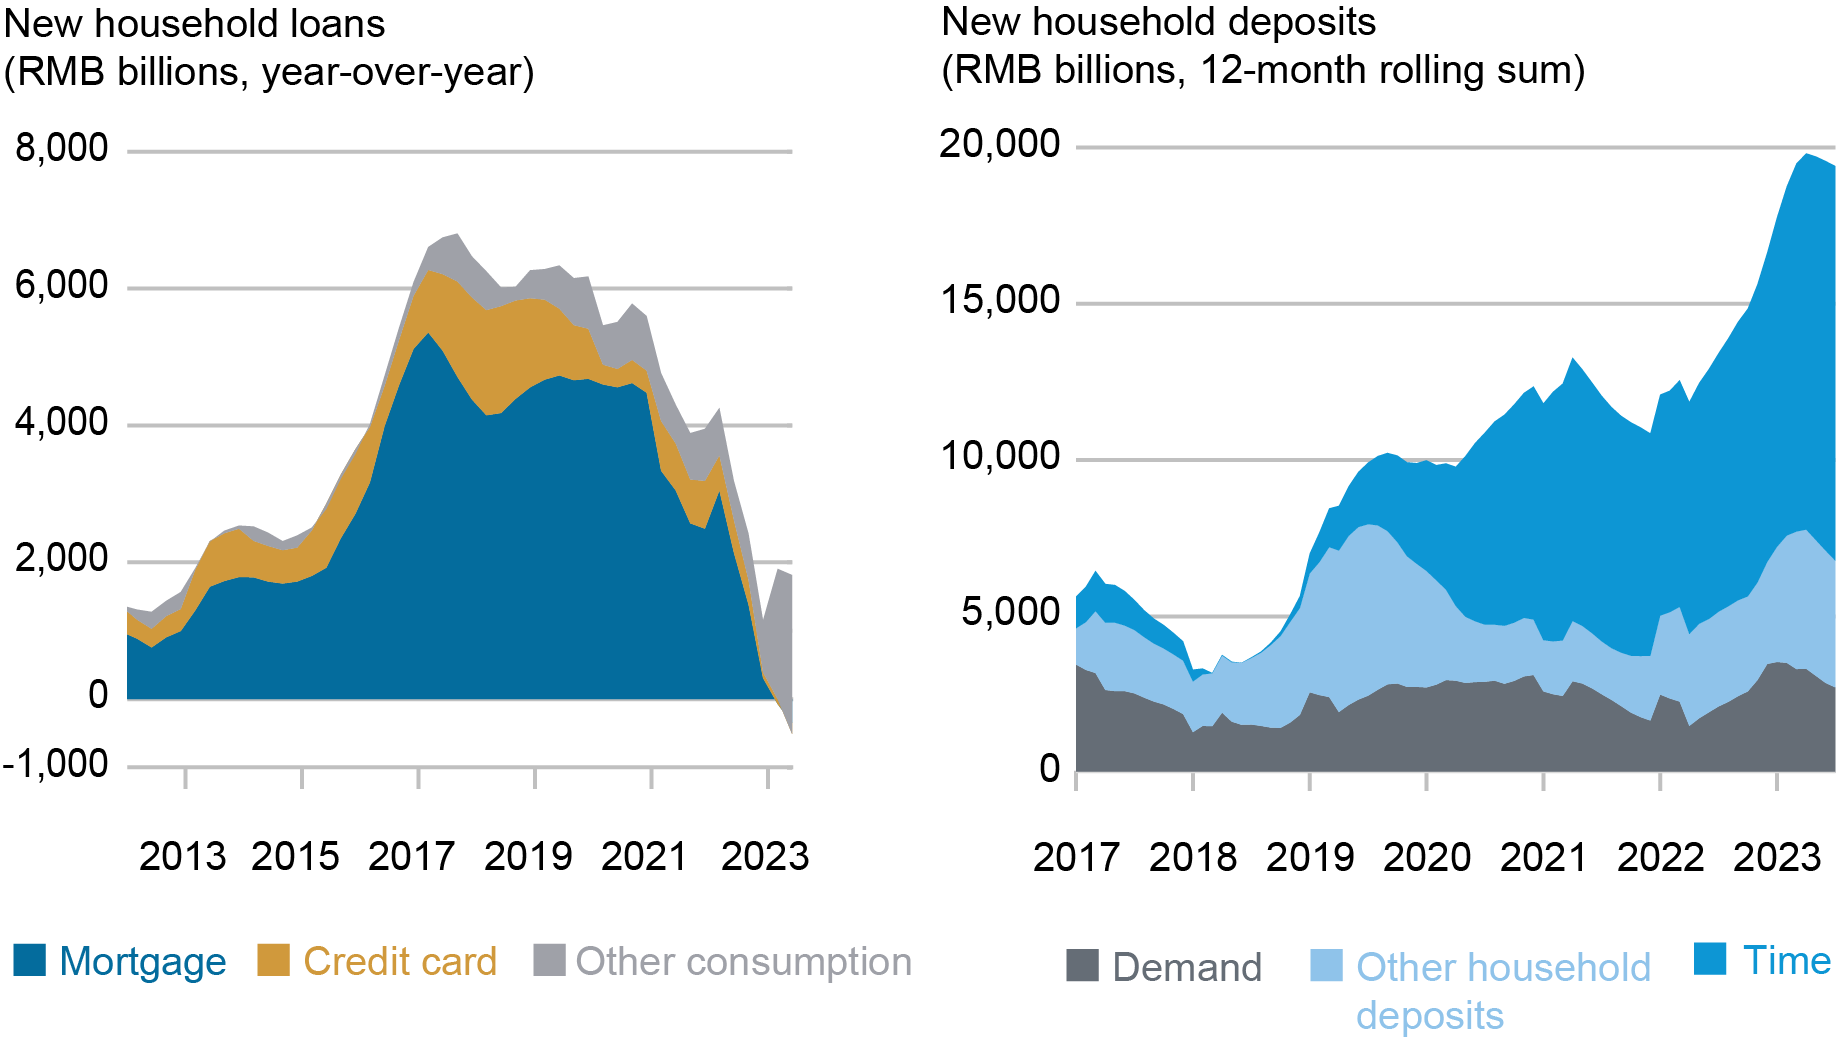
Note: Left panel excludes “operational loans,” which China classifies as household debt, but in effect are bank loans to sole proprietorships.
Starting in 2019, there has also been sharp rise in new bank deposits. The initial increase corresponds with the final implementation of new rules on the asset management business in China. The lockdown’s impact on consumer spending helped push up deposits in the 2020-21 period. New deposit growth has accelerated notably over the past year. One key driver is poor performance and disruption in domestic financial markets, causing a reallocation of some assets to bank deposits. The other is the slump in the property market, which has led to a major reduction in residential home purchases and mortgage borrowing, with property sales declining over 30 percent over the past year.
This surge in new bank deposits suggests consumer pessimism around the real estate outlook. Notably, households have opted overwhelmingly to hold longer-term savings deposits, as illustrated in the right panel of the chart above, even as interest rates in China continue to fall. Recent survey data suggest household preferences are for further increasing holdings of term deposits in the future. News around failures of alternative investment products tied to property developers in China will likely only increase risk aversion among households.
Paradox of Thrift?
Some have suggested consumer pessimism in China has already become entrenched, akin to “economic long COVID.” Consequently, households can be expected to borrow less, pay down their debt, shy away from buying homes, and hold more savings deposits. With problems in the property sector likely to be protracted and direct support for households not traditionally part of Chinese authorities’ playbook, policymakers face a tall task of reversing households’ attitudes about the future that will be key to bolstering consumption and reviving economic growth momentum.

Jeffrey B. Dawson is an international policy advisor in International Studies in the Federal Reserve Bank of New York’s Research and Statistics Group.
How to cite this post:
Jeff Dawson, “Why Are China’s Households in the Doldrums?,” Federal Reserve Bank of New York Liberty Street Economics, September 27, 2023, https://libertystreeteconomics.newyorkfed.org/2023/09/why-are-chinas-households-in-the-doldrums/
BibTeX: View |


Disclaimer
The views expressed in this post are those of the author(s) and do not necessarily reflect the position of the Federal Reserve Bank of New York or the Federal Reserve System. Any errors or omissions are the responsibility of the author(s).
 RSS Feed
 Follow Liberty Street Economics