


One of the most fundamental concepts in finance is the notion of a risk-free rate. This interest rate tells us how much money investors are guaranteed to receive in the future by saving one dollar today. As a result, risk-free rates reflect investors’ preferences for payoffs in the future relative to the present. Yields on U.S. Treasury securities are generally viewed as a standard benchmark for the risk-free rate, but they may also feature a “convenience yield,” reflecting Treasuries’ special, money-like properties. In this post, we estimate a risk-free rate implicit in the prices of S&P 500 index options—called the box rate—to measure investors’ time preference separate from Treasury convenience yields.
Risk-Free Payoffs from Options
Options with a European-style expiration can be used to replicate a risk-free payoff using the put-call parity relationship. By buying a put option and selling a call option of the same strike price and maturity, an investor receives the strike price in exchange for delivering the underlying asset on which the option is written. By then selling a put option and buying a call option for a different strike price with the same maturity, an investor can construct a risk-free payoff equal to the difference in strike prices, as shown in the chart below. In industry jargon, this trade is sometimes called the box spread. The difference between the price of the box spread portfolio today and its payoff at maturity reveals a risk-free rate that we call the box rate—the rate at which investors can borrow or lend in the option market. Historical estimates of the box rate from a recent paper are available here.
The Box Spread Trade: Replicating Risk-Free Payoffs with Options
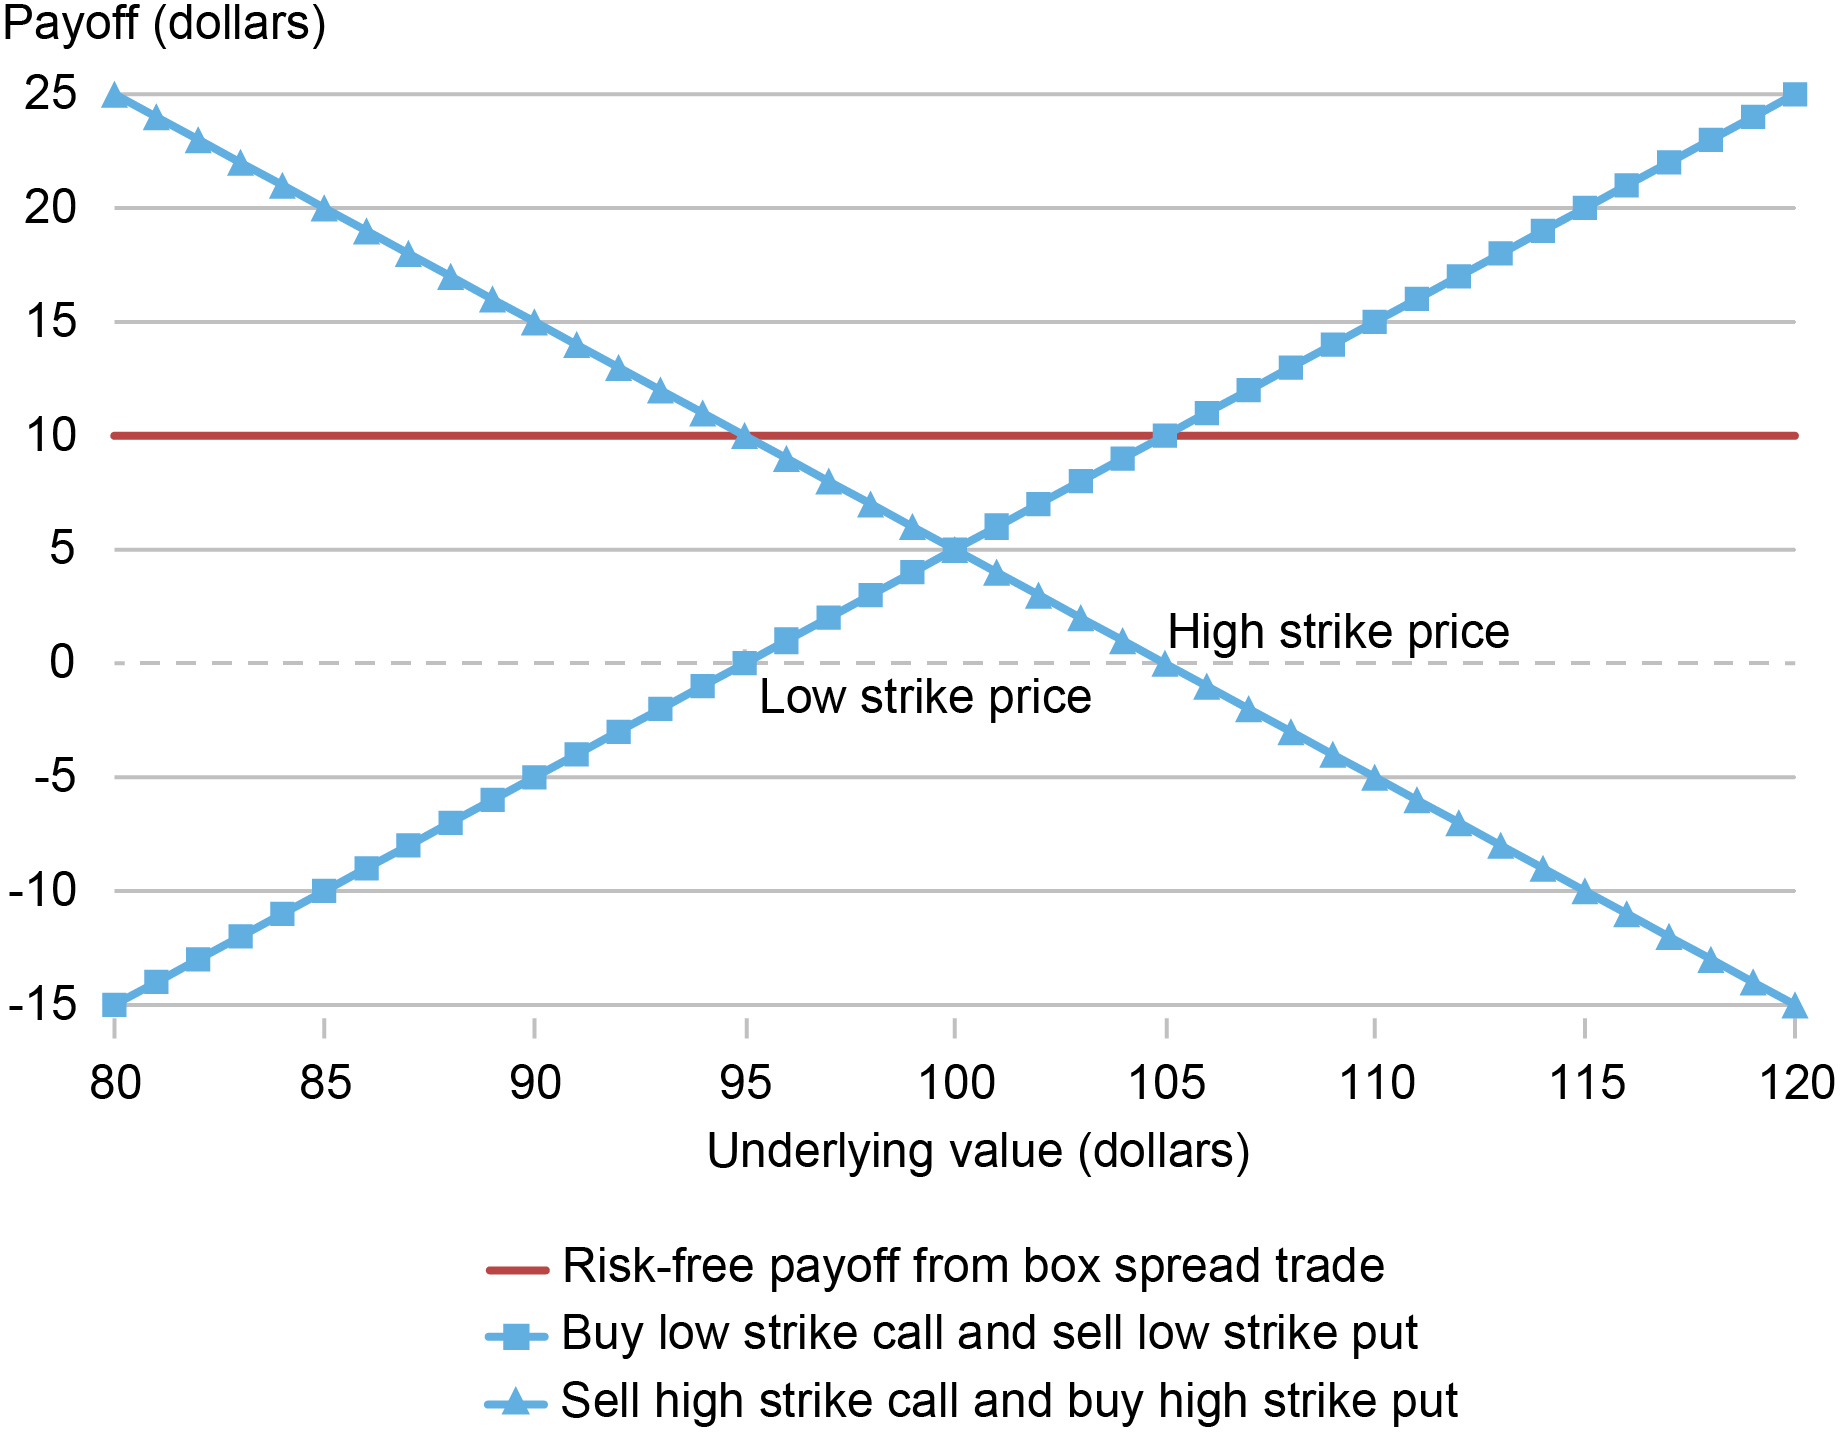
Source: Authors’ calculation.
Notes: The chart plots the combined payoff at maturity (solid blue line) from purchasing a 95-strike call and selling a 95-strike put (squares) while also selling a 105-strike call and buying a 105-strike put (triangles). Regardless of the value of the underlying asset at maturity, the combined payoff is a constant value of $10, equal to the difference in the strike prices. This trade is known as the “box spread.”
Estimating Box Rates
We estimate box rates using S&P 500 index options (SPX options). SPX options are among the most liquid and heavily traded options in the world. They have a European-style expiration and long time-series of available historical data, serving as the basis for the Cboe Volatility Index (VIX Index).
The chart below presents an example of estimating box rates on March 15, 2022, the day before the Federal Open Market Committee (FOMC) began its most recent rate hiking cycle. The top panel estimates the one-year box rate from an ordinary least squares (OLS) regression that exploits put-call parity. The box rate implied by the slope coefficient is 1.59 percent. Since option markets are close to arbitrage-free because of the competitive forces in financial markets, put-call parity holds almost exactly. In this example, the R-squared is .99999992 out to seven nines and the standard error of the box rate estimate is less than .01 percent, or one basis point.
The bottom panel extends the analysis to multiple maturities. The box rates and Treasury yield curve have a similar upward slope. The convenience yield, which is the spread between these curves, ranges from 10 to 30 basis points across different maturities.
Example of Estimating the Box Rate
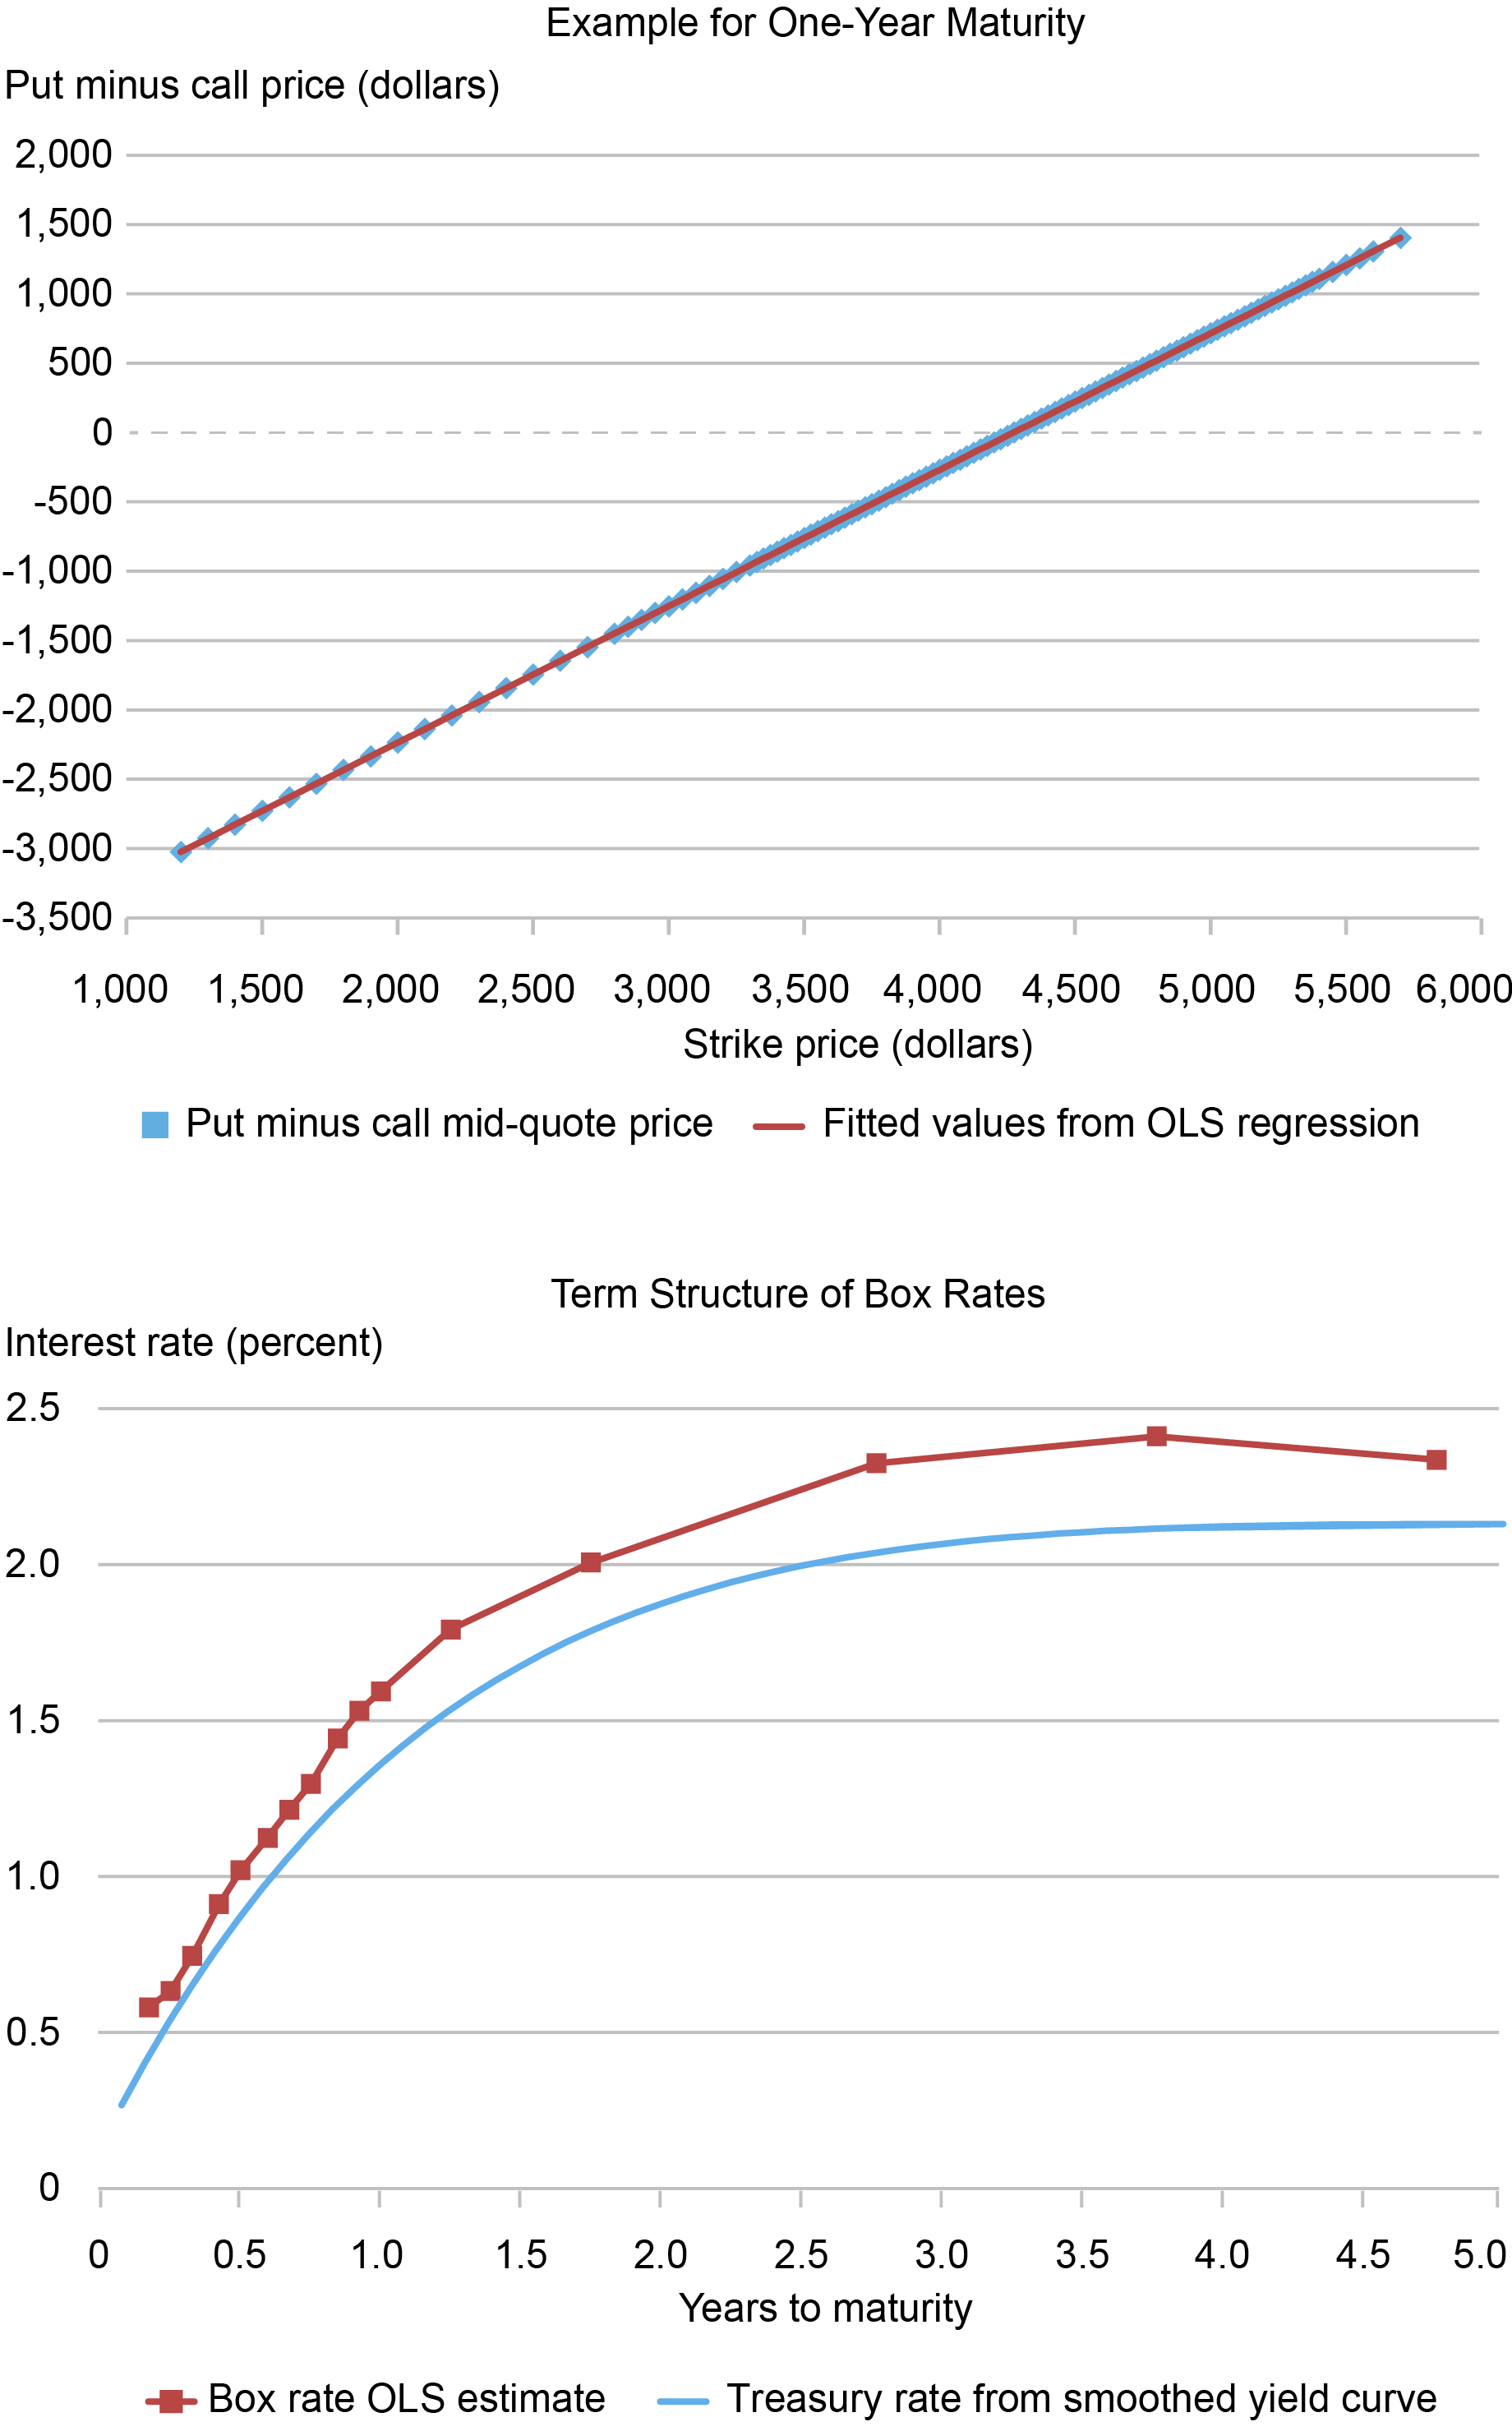
Sources: OptionMetrics; Federal Reserve Board.
Notes: The top panel plots put minus call mid-quote prices for the same strike price and maturity on March 15, 2022, alongside fitted values from an ordinary least squares (OLS) regression. The box rate implied by the slope coefficient from the regression is 1.59 percent for a maturity in 367 calendar days on March 17, 2023. The bottom panel plots the term structure of box rates from index options of different maturities alongside estimates of Treasury rates from a smoothed yield curve found here. All rates are zero-coupon discount rates with continuous compounding. Years-to-maturity is actual calendar days divided by 365. The option data is from OptionMetrics for S&P 500 index options with maturities between one month and five years whose bid quotes are greater than zero.
Box Rates and Treasury Convenience Yields over Time
Analyzing box rates and Treasury yields over time, we find three main results. First, from January 1996 to April 2023, the box rate is 35 basis points above the Treasury rate on average, implying a 35 basis point convenience yield. Second, convenience yields grow dramatically during the financial crisis of 2007-09, reaching a peak of roughly 130 basis points in October 2008 as a one-month moving average. Third, the average term structure of convenience yields is almost flat across maturities out to three years.
The chart below illustrates the first two results. The top panel plots the time series of the one-year box rate and Treasury rate over time. The bottom panel plots the convenience yield, which equals the difference between the two rates. Box rates and Treasury rates closely comove, with the Treasury rate consistently below the box rate throughout the sample. In addition to being consistently positive, the convenience yield also exhibits some time-series variation, spiking most significantly during the 2007-09 financial crisis, while staying at more stable levels between 20 and 40 basis points in recent years.
Box Rate Closely Tracks the Treasury Rate and Implies a Positive Convenience Yield
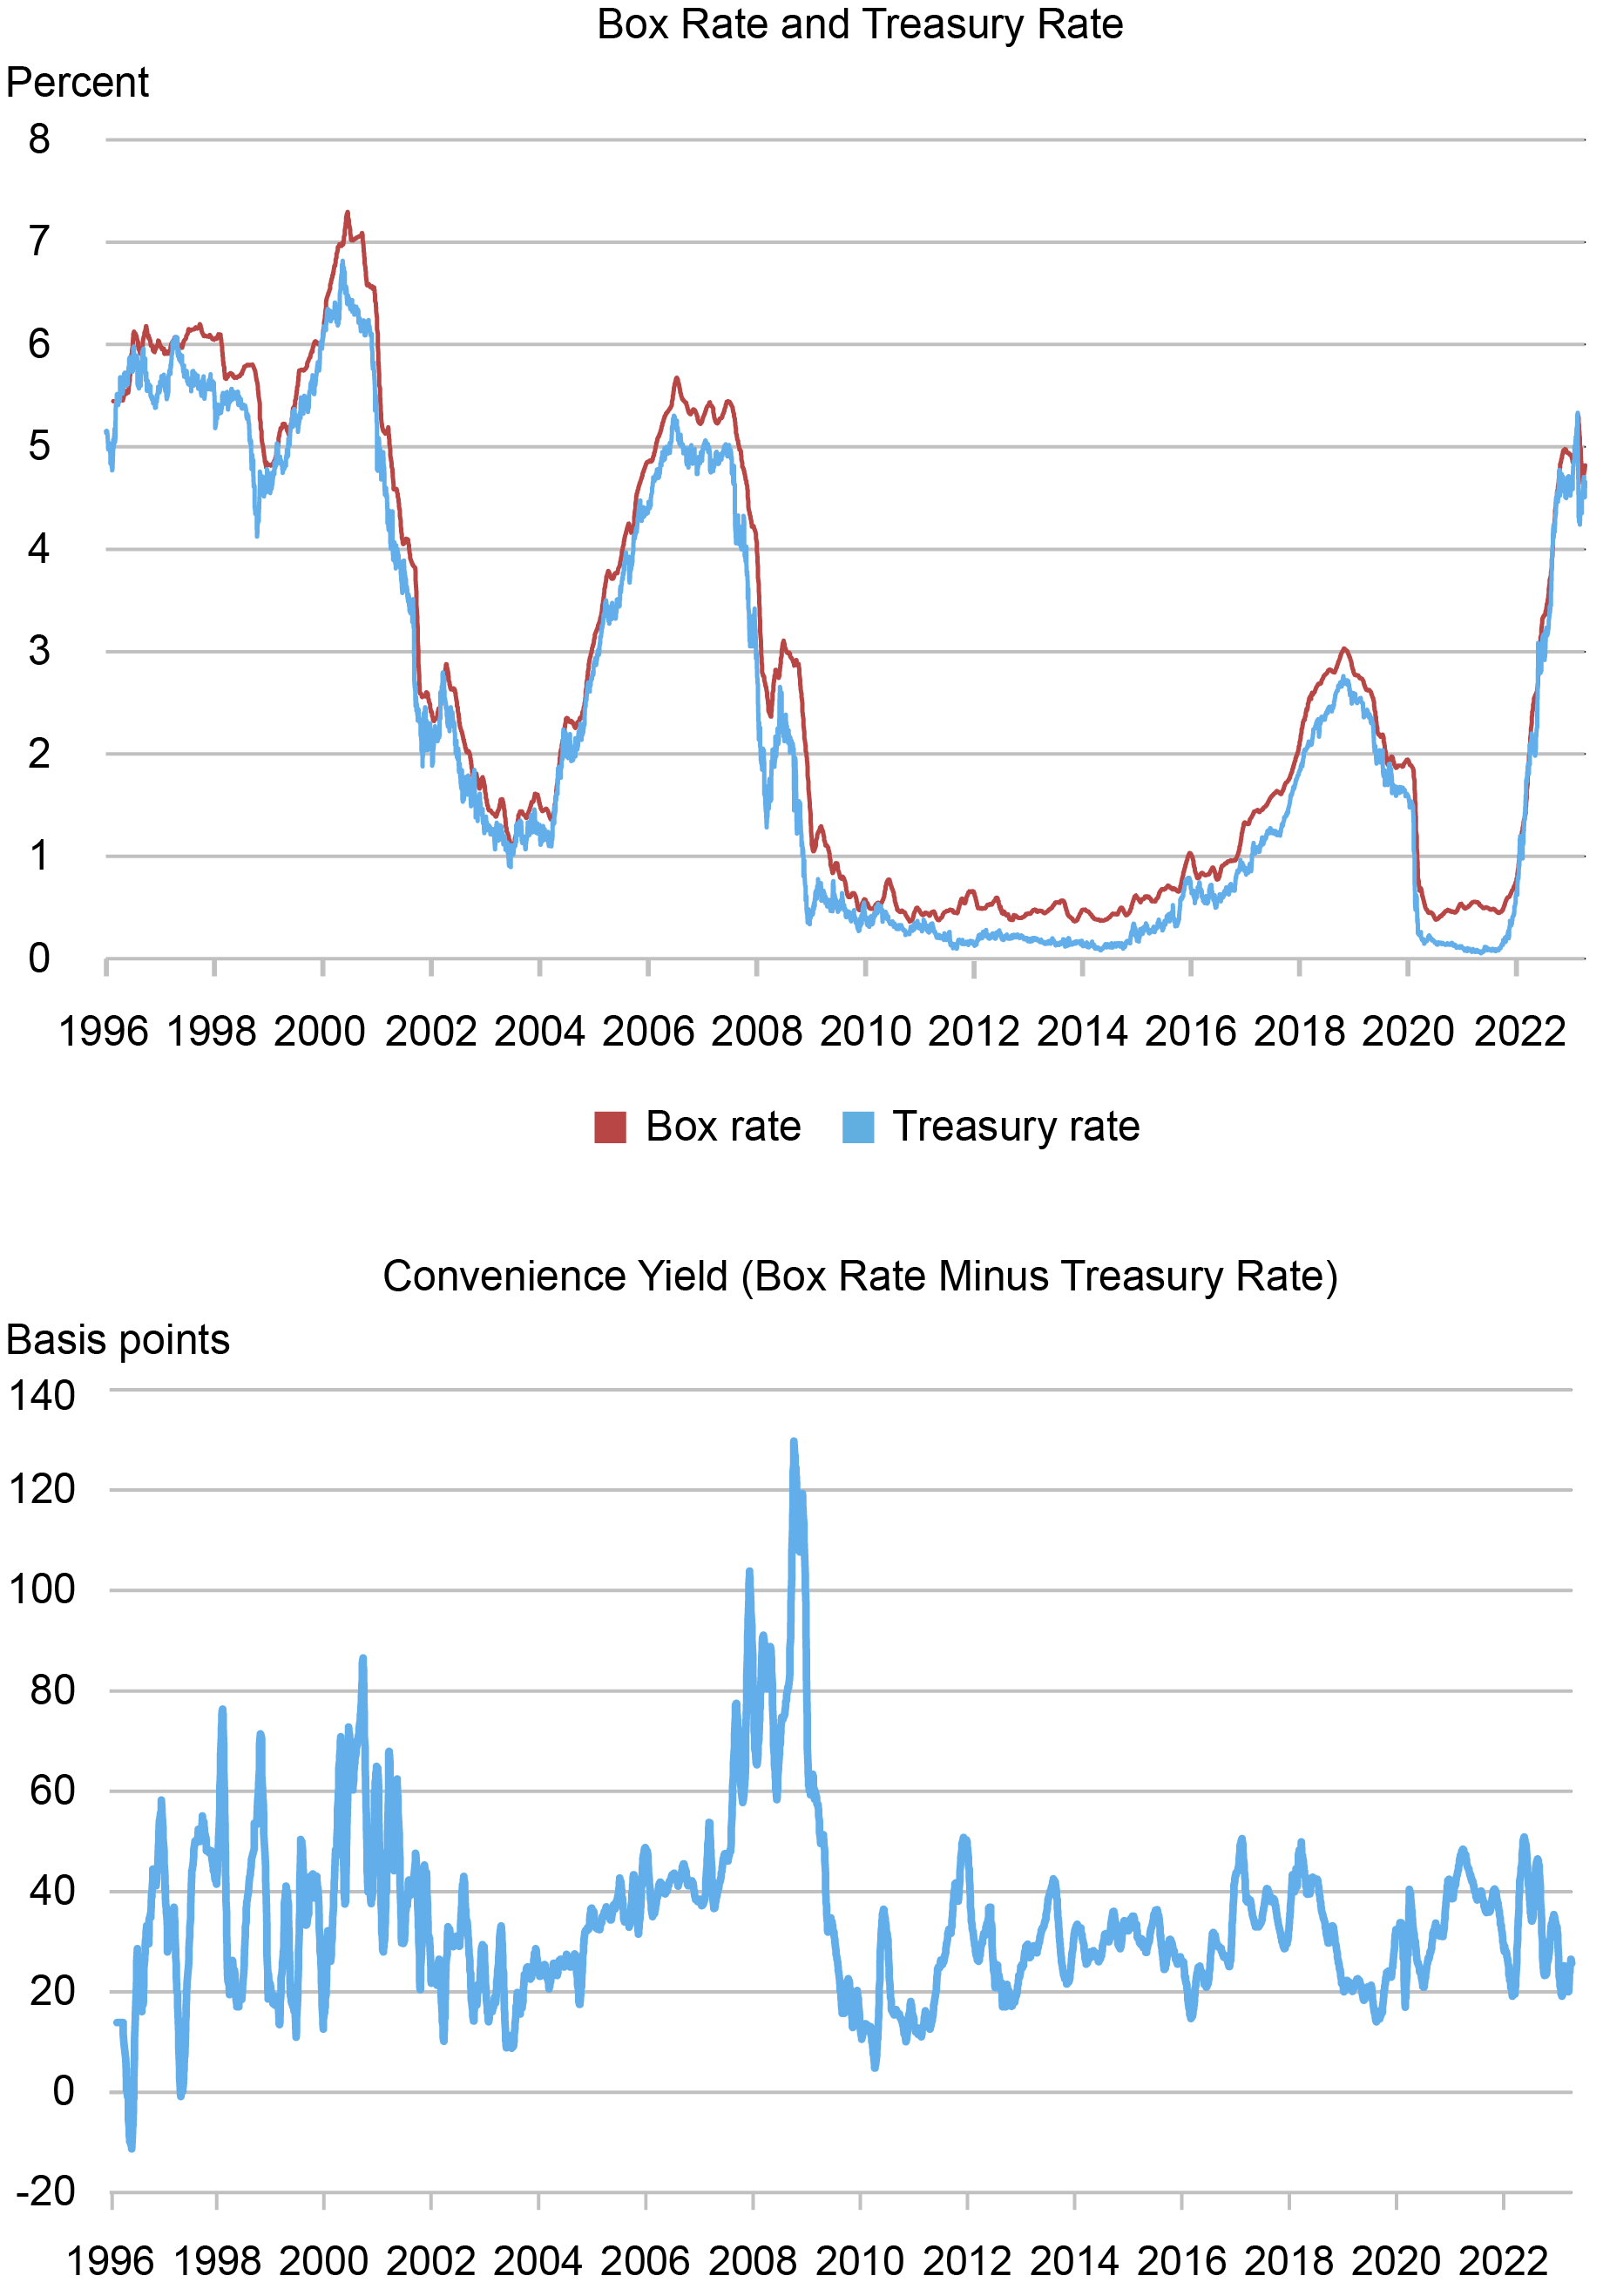
Sources: OptionMetrics; Federal Reserve Board.
Notes: The chart plots the one-year box rate, Treasury rate, and convenience yield estimate from January 1996 through April 2023 as a twenty-one-day moving average across trading days. The box rate is estimated by ordinary least squares (OLS) from put-call parity. To obtain a constant one-year maturity, we linearly interpolate the nearest S&P 500 index option maturities whose put-call parity regressions have an R-squared of at least .99999 out to five nines. Treasury rates are from a smoothed yield curve to obtain a one-year, constant maturity, zero-coupon rate. Both rates are zero-coupon discount rates with continuous compounding. Results are similar using the Theil-Sen estimate of the box rate from the box spread trade.
The chart below illustrates our third result by plotting the average term structure of convenience yields. As we saw in the example above, box rates can be estimated for different index option maturities. We find that the average level of convenience yields is relatively stable and close to 35 basis points across maturities. This means that when the Treasury issues debt at any maturity out to three years, it tends to save around 35 basis points relative to the risk-free rates implicit in the option market.
Convenience Yield Term Structure Relatively Flat out to Three Years, 35 Basis Points on Average
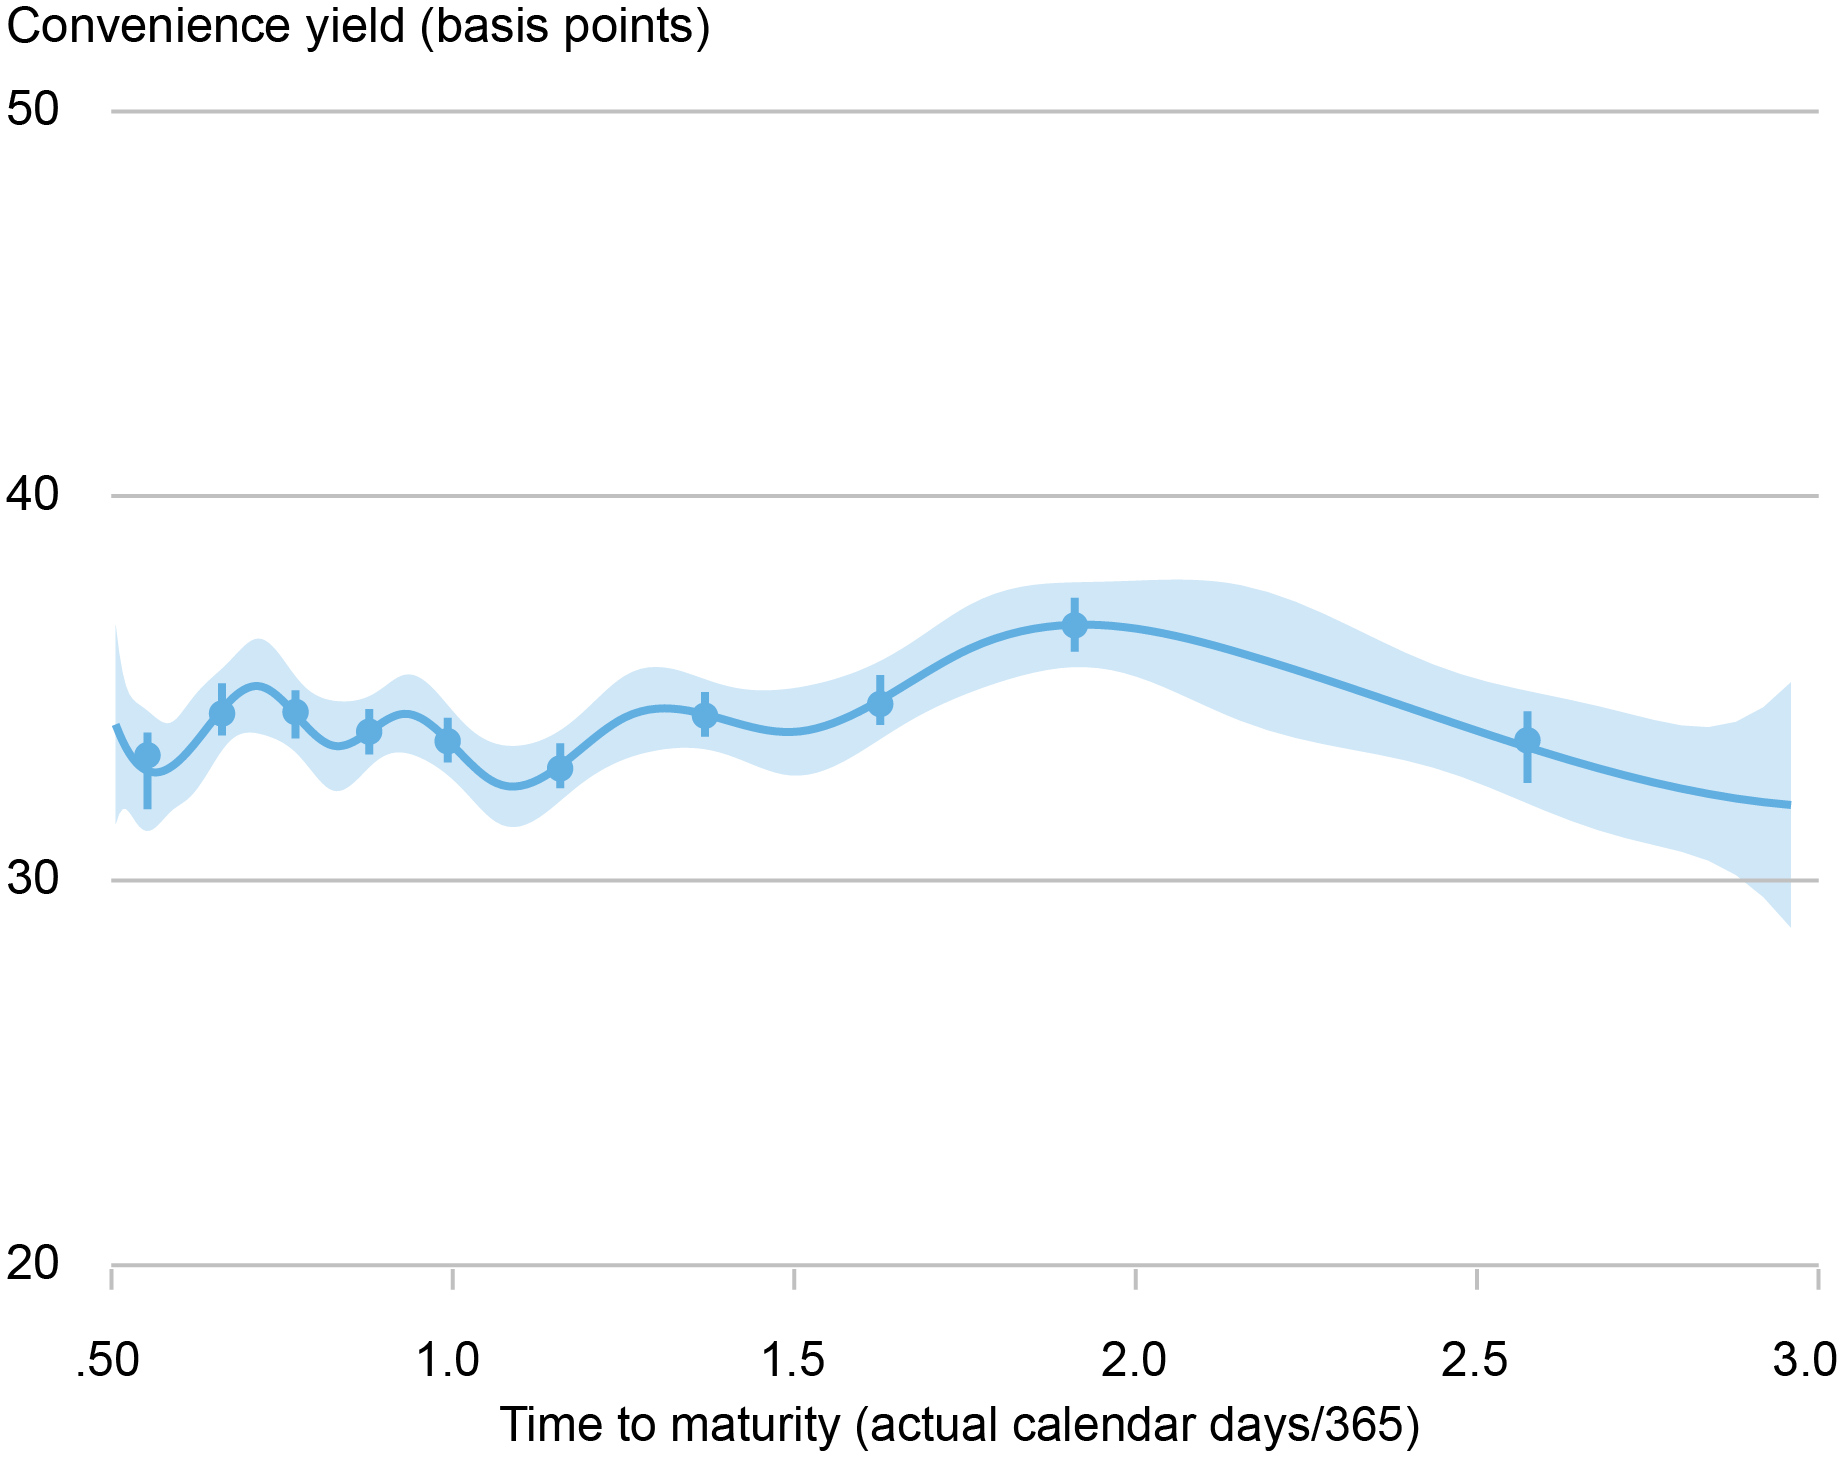
Sources: OptionMetrics; Federal Reserve Board.
Notes: The chart plots the nonparametric binned regression of convenience yield onto time-to-maturity using the binsreg package. It reports a 95 percent uniform confidence band and pointwise confidence bands after partitioning time-to-maturity into ten bins. We use a binned regression approach to account for the fact that option maturities are fixed in calendar time and are not constant maturity. The regression includes maturities from six months to three years. The sample period is January 1996 to April 2023.
Interpretation and Applications
Treasuries are generally considered to be one of the most liquid securities in the world, as they can be traded quickly, in large scale, and at low cost. Treasuries are also a common form of collateral that play a unique role in regulatory capital and liquidity constraints. Because options are risky financial derivatives, the box rate is an alternative risk-free rate benchmark that is based on option prices that do not embed a safe asset premium. Note that the recent effort to replace LIBOR with a new benchmark interest rate shows the importance of finding risk-free rate alternatives. The box rate, which is based on market prices, is one candidate that may be considered alongside other robust reference rates such as SOFR (Secured Overnight Financing Rate) to support financial stability.
The convenience yield estimated with the box rate is also a potentially useful barometer for stress in the financial system. It measures how much investors are willing to pay to hold Treasury securities instead of less money-like assets with identical cashflows. In historical data, the convenience yield was largest during the financial crisis of 2007-09. Investors and policymakers who want a real-time measure of the scarcity of safe assets may therefore find convenience yields based on box rates useful.
Economic Magnitude of Treasury Convenience Yield
As a back-of-the-envelope approximation, if we apply the one-year convenience yield estimated with the box rate to the amount of Treasury marketable debt outstanding each year, the Treasury convenience yield has saved taxpayers around $35 billion per year over the past twenty years. Given the increase in debt following the COVID-19 crisis, this amount has increased to $70 billion per year since 2020. These significant taxpayer savings bring into focus the importance of suggested reforms and recent research on the Treasury market, where improving the resiliency and functioning of the Treasury market may help to maintain Treasuries’ convenience yield.
Jules H. van Binsbergen is the Nippon Life Professor in Finance at the Wharton School of the University of Pennsylvania.
William Diamond is an assistant professor of finance at the Wharton School of the University of Pennsylvania.

Peter Van Tassel is a financial research economist in Capital Markets Studies in the Federal Reserve Bank of New York’s Research and Statistics Group.
How to cite this post:
Jules van Binsbergen, William Diamond, and Peter Van Tassel, “Options for Calculating Risk‑Free Rates,” Federal Reserve Bank of New York Liberty Street Economics, October 2, 2023, https://libertystreeteconomics.newyorkfed.org/2023/10/options-for-calculating-risk-free-rates/
BibTeX: View |


Disclaimer
The views expressed in this post are those of the author(s) and do not necessarily reflect the position of the Federal Reserve Bank of New York or the Federal Reserve System. Any errors or omissions are the responsibility of the author(s).
 RSS Feed
 Follow Liberty Street Economics
As a next step in this research, it would be interesting to compare your estimates of the box rates with the SOFR and Fed Funds curves built from interest rates swaps.