


This post estimates “convenience yields” for government debt in ten of the G11 currencies based on analysis from a recent paper. As in our companion post, we measure convenience yields with option-implied box rate data that is estimated from options traded on the main stock market index in each country. We find that a country’s average convenience yield is closely related to its level of interest rates. In addition, we find that average covered interest parity (CIP) deviations are roughly the same across countries when they are measured with box rates. We rationalize these findings with a model in which convenience yields depend on domestic financial intermediaries, but CIP deviations depend on international arbitrageurs funded with dollar debt.
Estimating International Convenience Yields
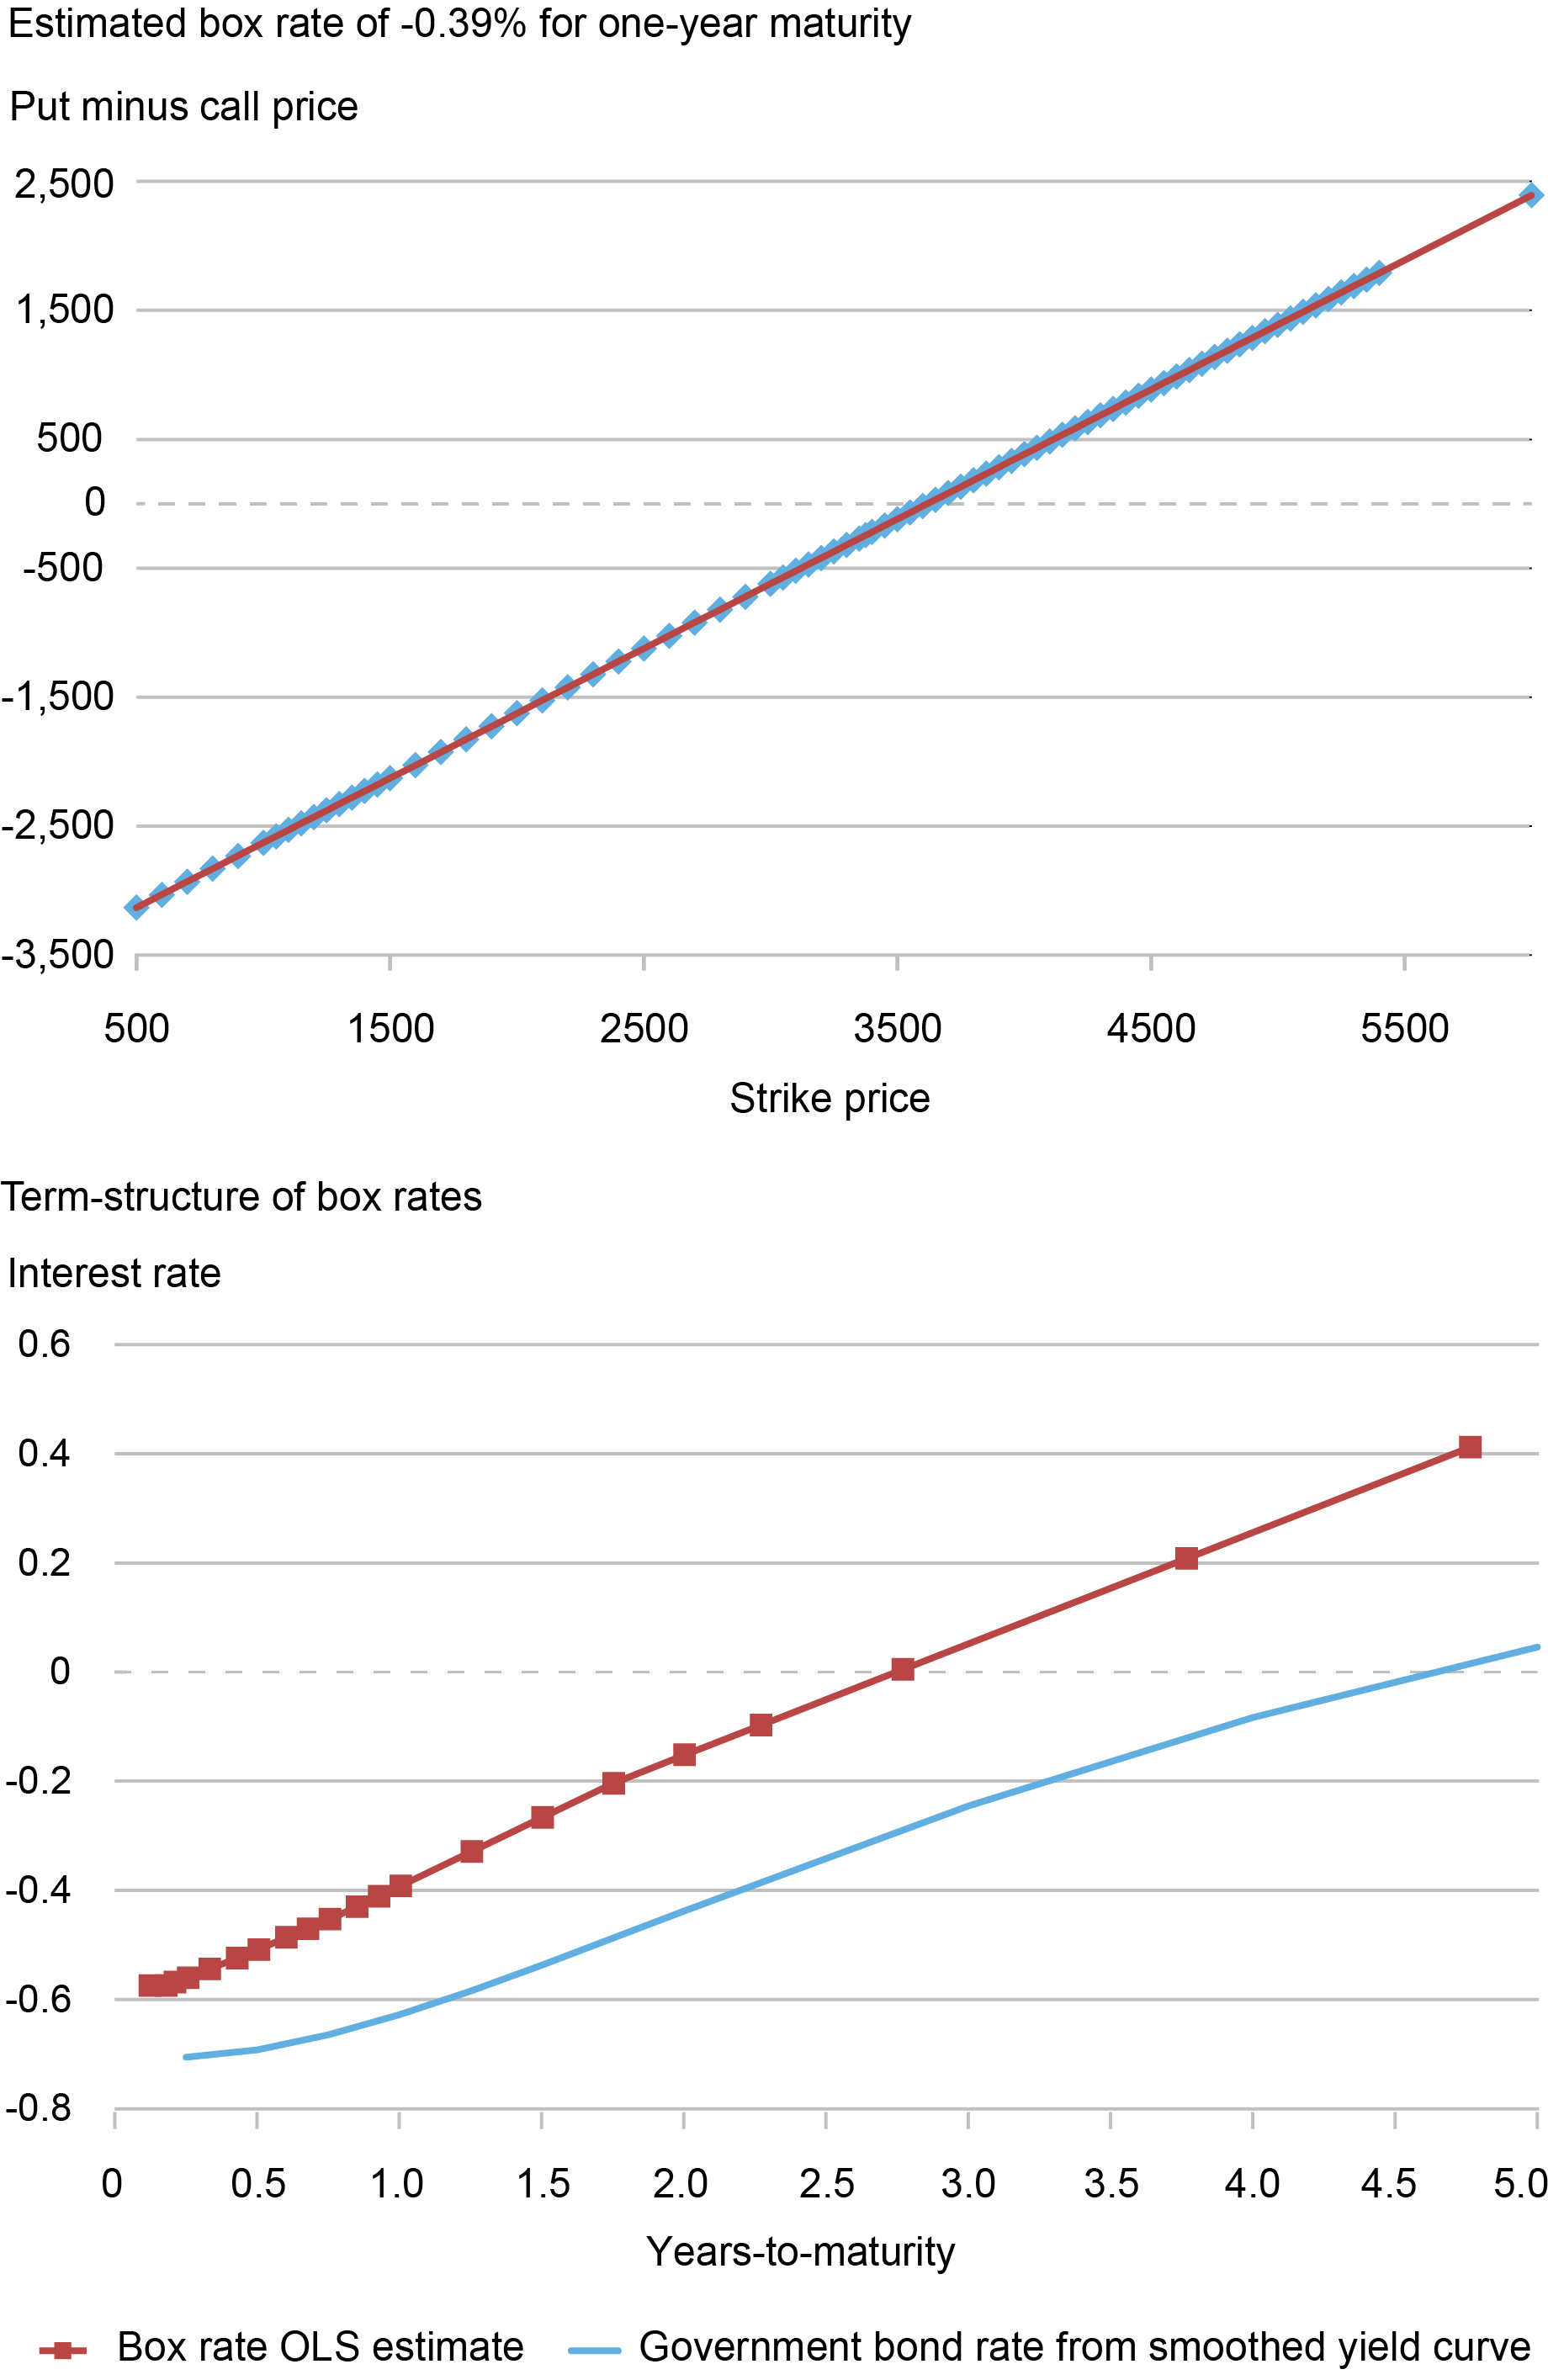
We illustrate our approach for estimating foreign box rates using option quotes for the Euro Stoxx 50 index, which are denominated in euros. The international estimates build upon a recent paper which estimates box rate data for the United States, which are denominated in dollars. The chart below presents an example of estimating the term-structure of box rates on March 15, 2022. The top plot shows a regression of put minus call prices onto strike prices for options expiring one-year later on March 17, 2023. The box rate implied by the slope coefficient is -.39 percent. As in our companion post on SPX options denominated in dollars, put-call parity holds almost exactly for Stoxx options with a standard error of the box rate estimate that is less than .01 percent or one basis point in this example. Expanding the analysis to other maturities, the bottom plot reports the yield curve for box rates compared to government bond rates. There is a positive spread between box rates and the government bond yield curve across maturities, with a spread of around 25 basis points at a 1-year maturity.
Estimating Box Rates for the Euro
Source: OptionMetrics and European Central Bank.
Note: The top panel plots put minus call settlement prices for the same strike price and maturity on March 15, 2022 alongside fitted values from an ordinary least squares (OLS) regression. The box rate implied by the slope coefficient from the regression is -0.39 percent for a maturity in 367 calendar days on March 17, 2023. The bottom panel plots the term-structure of box rates alongside estimates of government bond rates from a smoothed AAA-rated yield curve from the European Central Bank. All rates are zero-coupon discount rates with continuous compounding. Years-to-maturity is actual calendar days divided by 365. The option data is from OptionMetrics for Euro Stoxx 50 index options with maturities between 1 month and 5 years.
Euro Convenience Yields Over Time
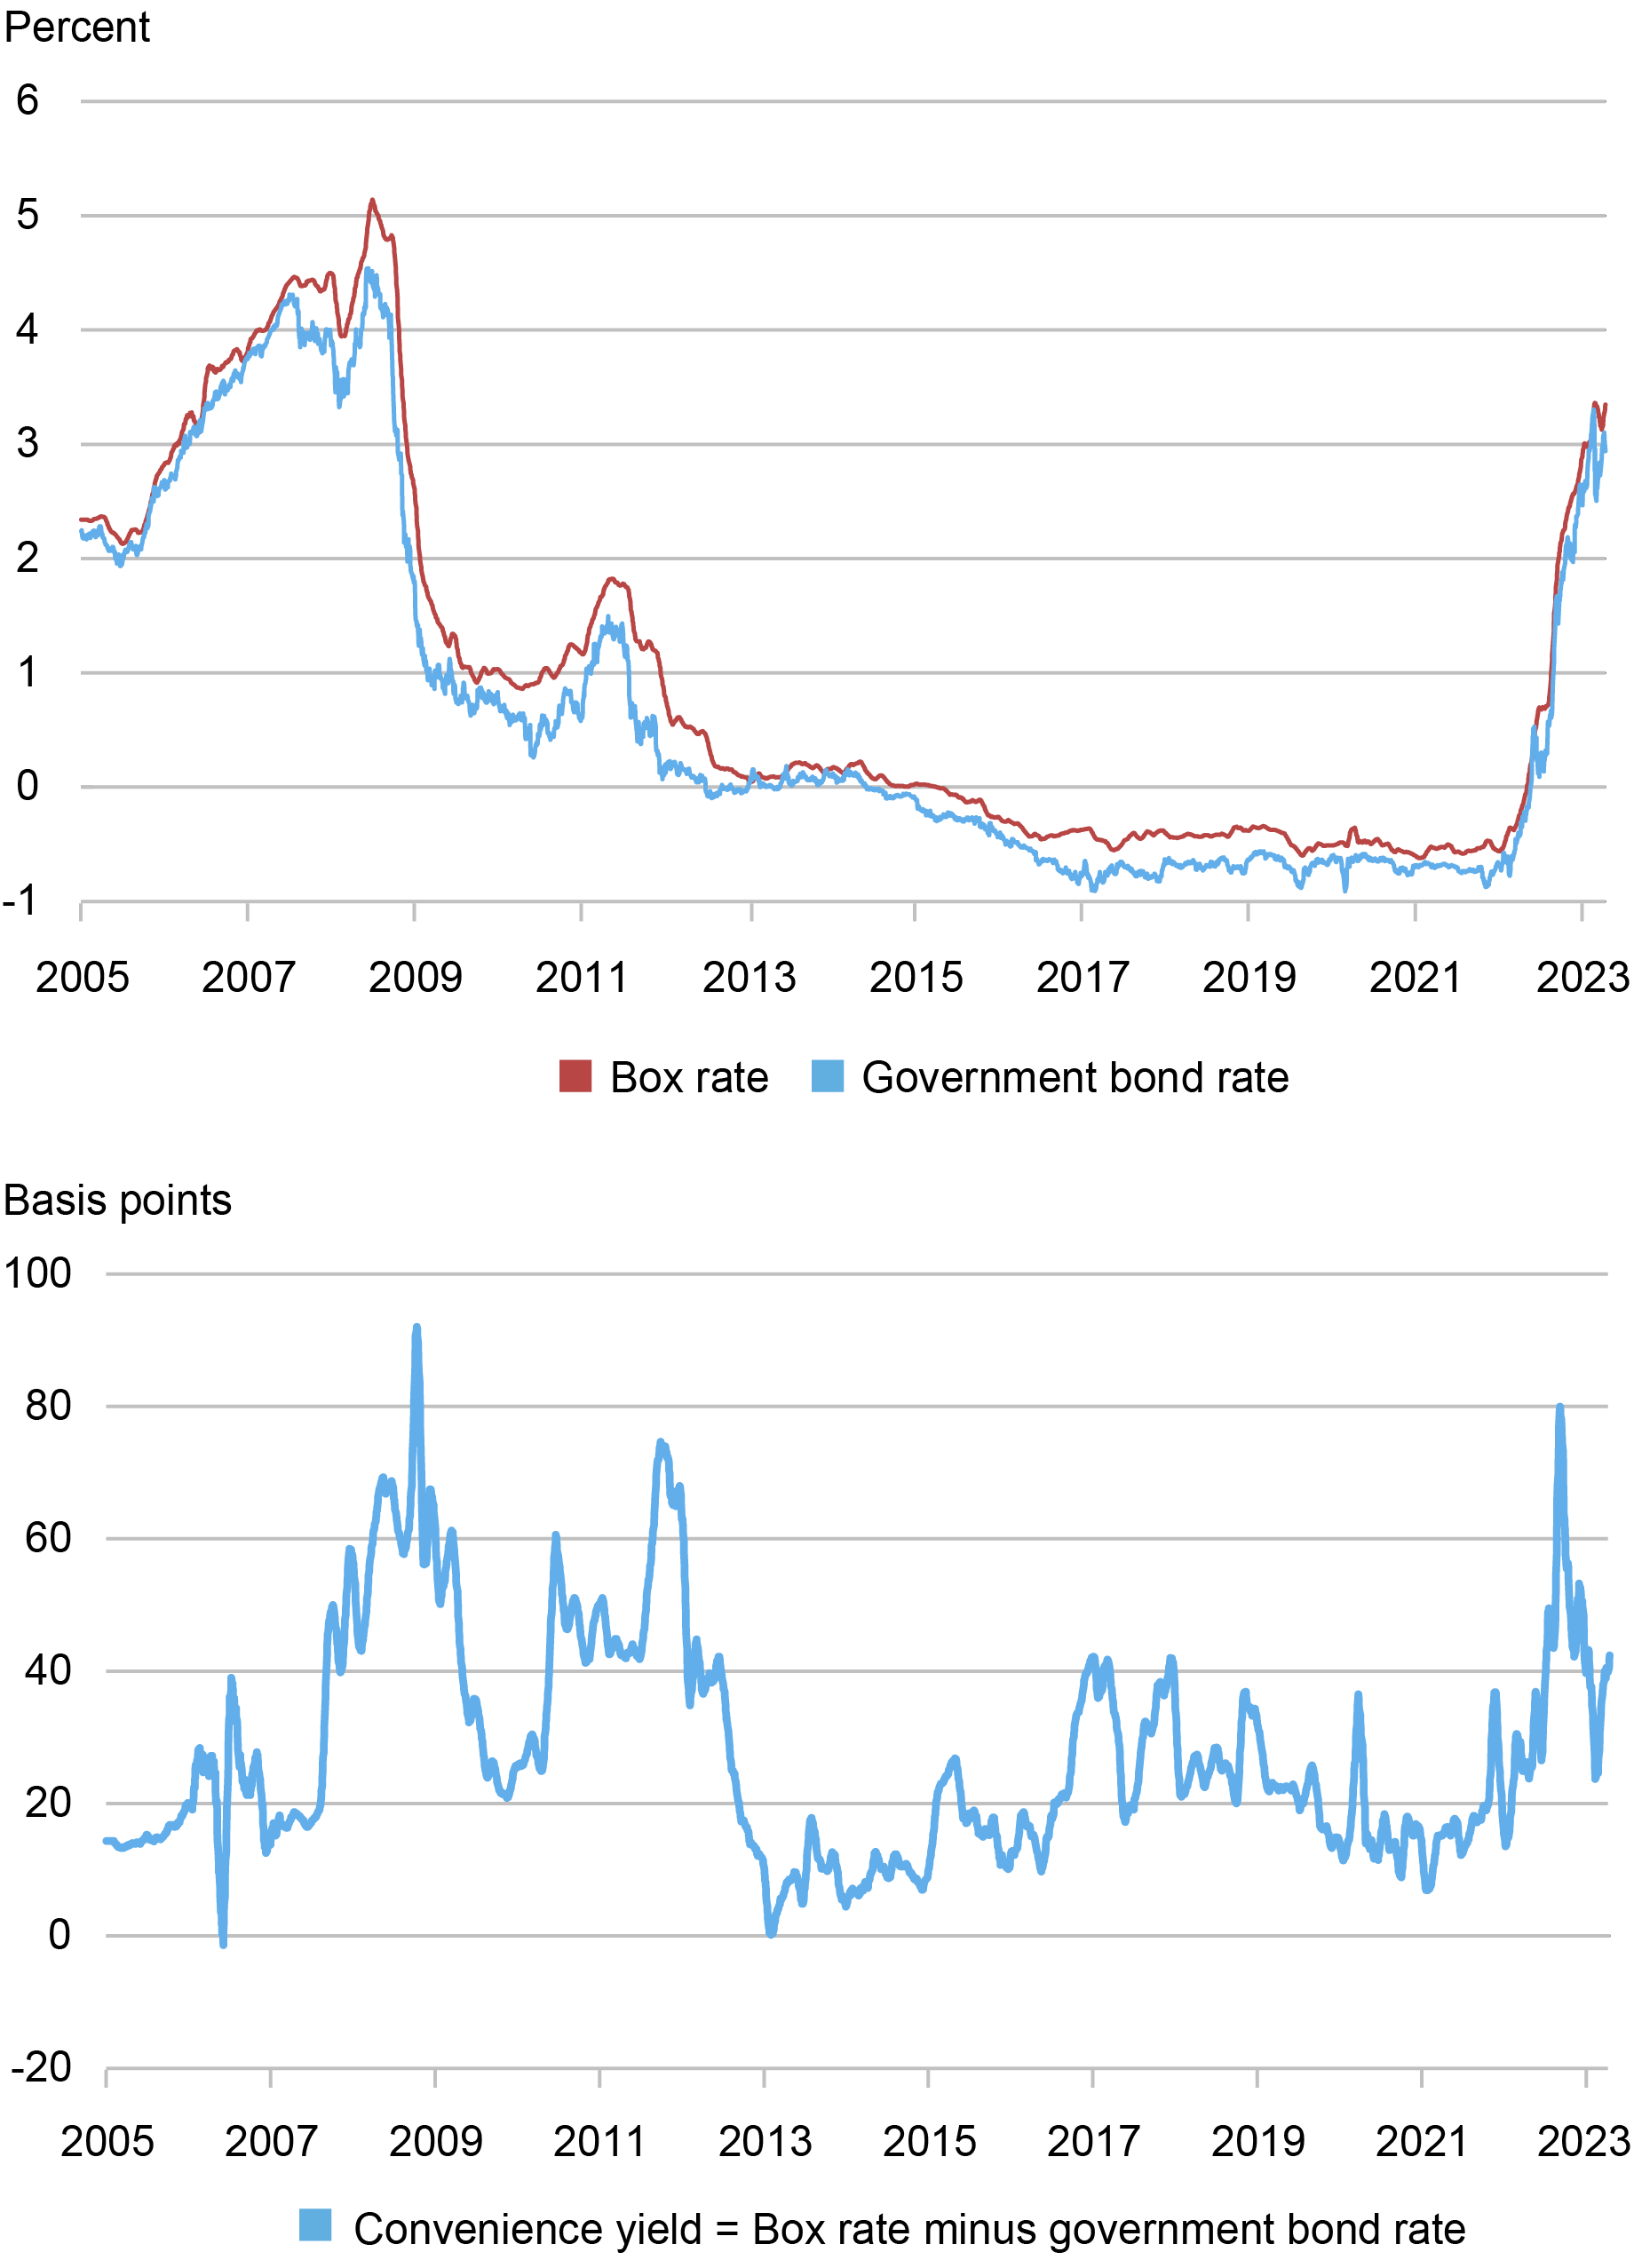
We plot the time series of Euro box rates, government bond yields, and implied convenience yields in the chart below. The convenience yield is the difference between the box and government bond rates, showing the rate of return investors forgo to hold government debt compared to a less money-like asset with identical cashflows. The two rates track each other closely, although their difference tends to grow during crises such as the 2007-09 financial crisis and the 2011-12 European debt crisis, and during the monetary tightening cycle that started in 2022.
Time-Series of 1-Year Box Rate and Convenience Yield for the Euro
Source: OptionMetrics and European Central Bank.
Note: The chart plots the 1-year box rate, government bond rate, and convenience yield estimate from January 2005 through April 2023 as a 21-day moving average across trading days. The box rate is estimated by ordinary least squares from put-call parity. To obtain a constant 1-year maturity, we linearly interpolate the nearest STOXX 50 index option maturities whose put-call parity regressions have an R-squared of a least 0.99999 out to five nines. Government bond rates are from a smoothed yield curve to obtain a 1-year constant maturity zero-coupon rate. Both rates are zero-coupon discount rates with continuous compounding. Results are similar using the Theil-Sen estimate of the box rate from the box spread trade.
Convenience Yields Versus Interest Rates
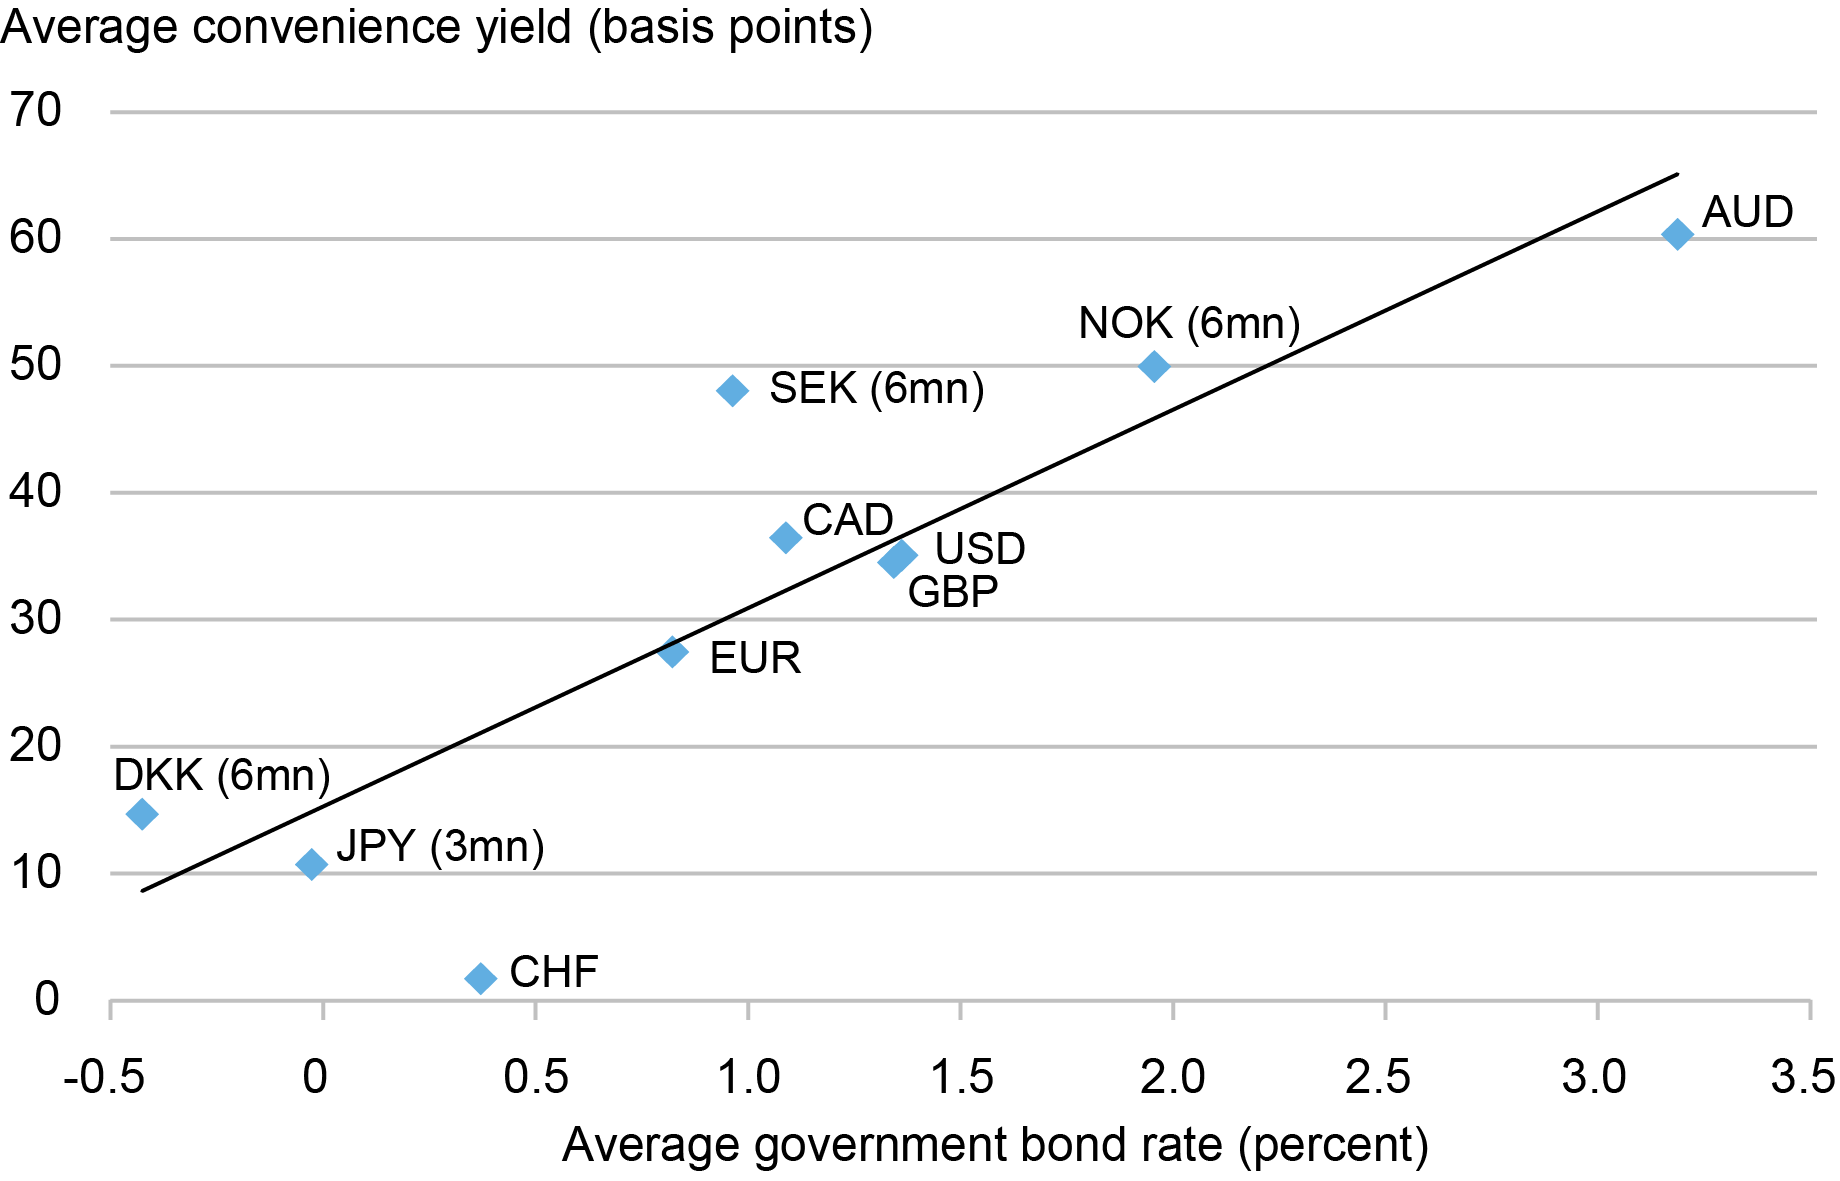
The cross-section of convenience yields in different countries is well-explained by the level of countries’ interest rates. The chart below reports a scatter plot of sample average convenience yields measured with the box rate versus sample average government bond rates for different currencies. There is a strong association between convenience yields and interest rates, with a 1 percent higher interest rate corresponding to a 15 basis point larger convenience yield on average. In our paper we find that convenience yields across countries are not well explained by other factors, such as government debt-to-GDP ratios or sovereign credit default swap spreads. Our results are related to a recent study that also finds a relationship between convenience yields and interest rates in U.S. time-series data. We complement the time-series approach with our result in the cross-section of countries.
The strong relationship between the level of interest rates and convenience yields can be explained by investors choosing to substitute between cash and other sources of liquidity. The liquidity premium/convenience yield of cash is equal to the nominal interest rate. For example, if interest rates are 4 percent, holding cash for one year will cost you 4 cents of income per dollar. Safe assets such as government debt that are highly liquid and money-like serve as close substitutes for cash. This suggests that convenience yields for safe assets will be closely related to the opportunity cost of cash and hence the level of interest rates.
Countries with Higher Interest Rates Have Higher Convenience Yields
Source: Intercontinental Exchange (ICE), Thomson Reuters Tick History Data, and OptionMetrics.
Note: The chart plots average convenience yield against average government bond rate from January 2004 to July 2020 for the available sample period for each currency that is reported in the paper. The convenience yield is the 1-year box rate minus the 1-year government bond rate in all countries except Norway, Sweden, and Denmark where we use 6-month rates and Japan where we use 3-month rates for a larger sample of observations of precisely estimated box rates to measure convenience yields. Box rates are estimated from intraday time-stamped option quotes from the Intercontinental Exchange (ICE) that are supplemented with intraday Thomson Reuters Tick History data and then with OptionMetrics daily data as needed. For each currency and maturity, we run the put-call parity regressions minute-by-minute and compute the median box rate for each day and maturity. To minimize the impact of outliers, we only use regressions with an R-squared of at least 0.99999 out to five 9s. To obtain constant maturity rates, we linearly interpolate between the nearest maturities.
Convenience Yields and Covered Interest Parity
The strong relationship between convenience yields and interest rates can potentially explain well-known facts about CIP deviations. CIP is a no-arbitrage relationship that states that a dollar safe asset should have the same yield as an otherwise identical synthetic asset constructed from a foreign safe asset with a currency swap. An important anomaly in the post-financial-crisis era has been the rise of CIP deviations. This may reflect new frictions induced by post-2008 financial regulations that raise costs of doing arbitrage trades.
Previous research has shown that there is a strong correlation between CIP deviations and the level of nominal interest rates. In our paper, we show that the CIP deviation for a safe asset such as government debt can be written as the sum of two terms. The first term is the difference between countries’ safe asset convenience yields. The second term is a CIP deviation constructed from our box rates, which we interpret as reflecting frictions in international arbitrage, since this term only depends on the market prices of financial derivatives and is thus free from the convenience yield of safe assets.
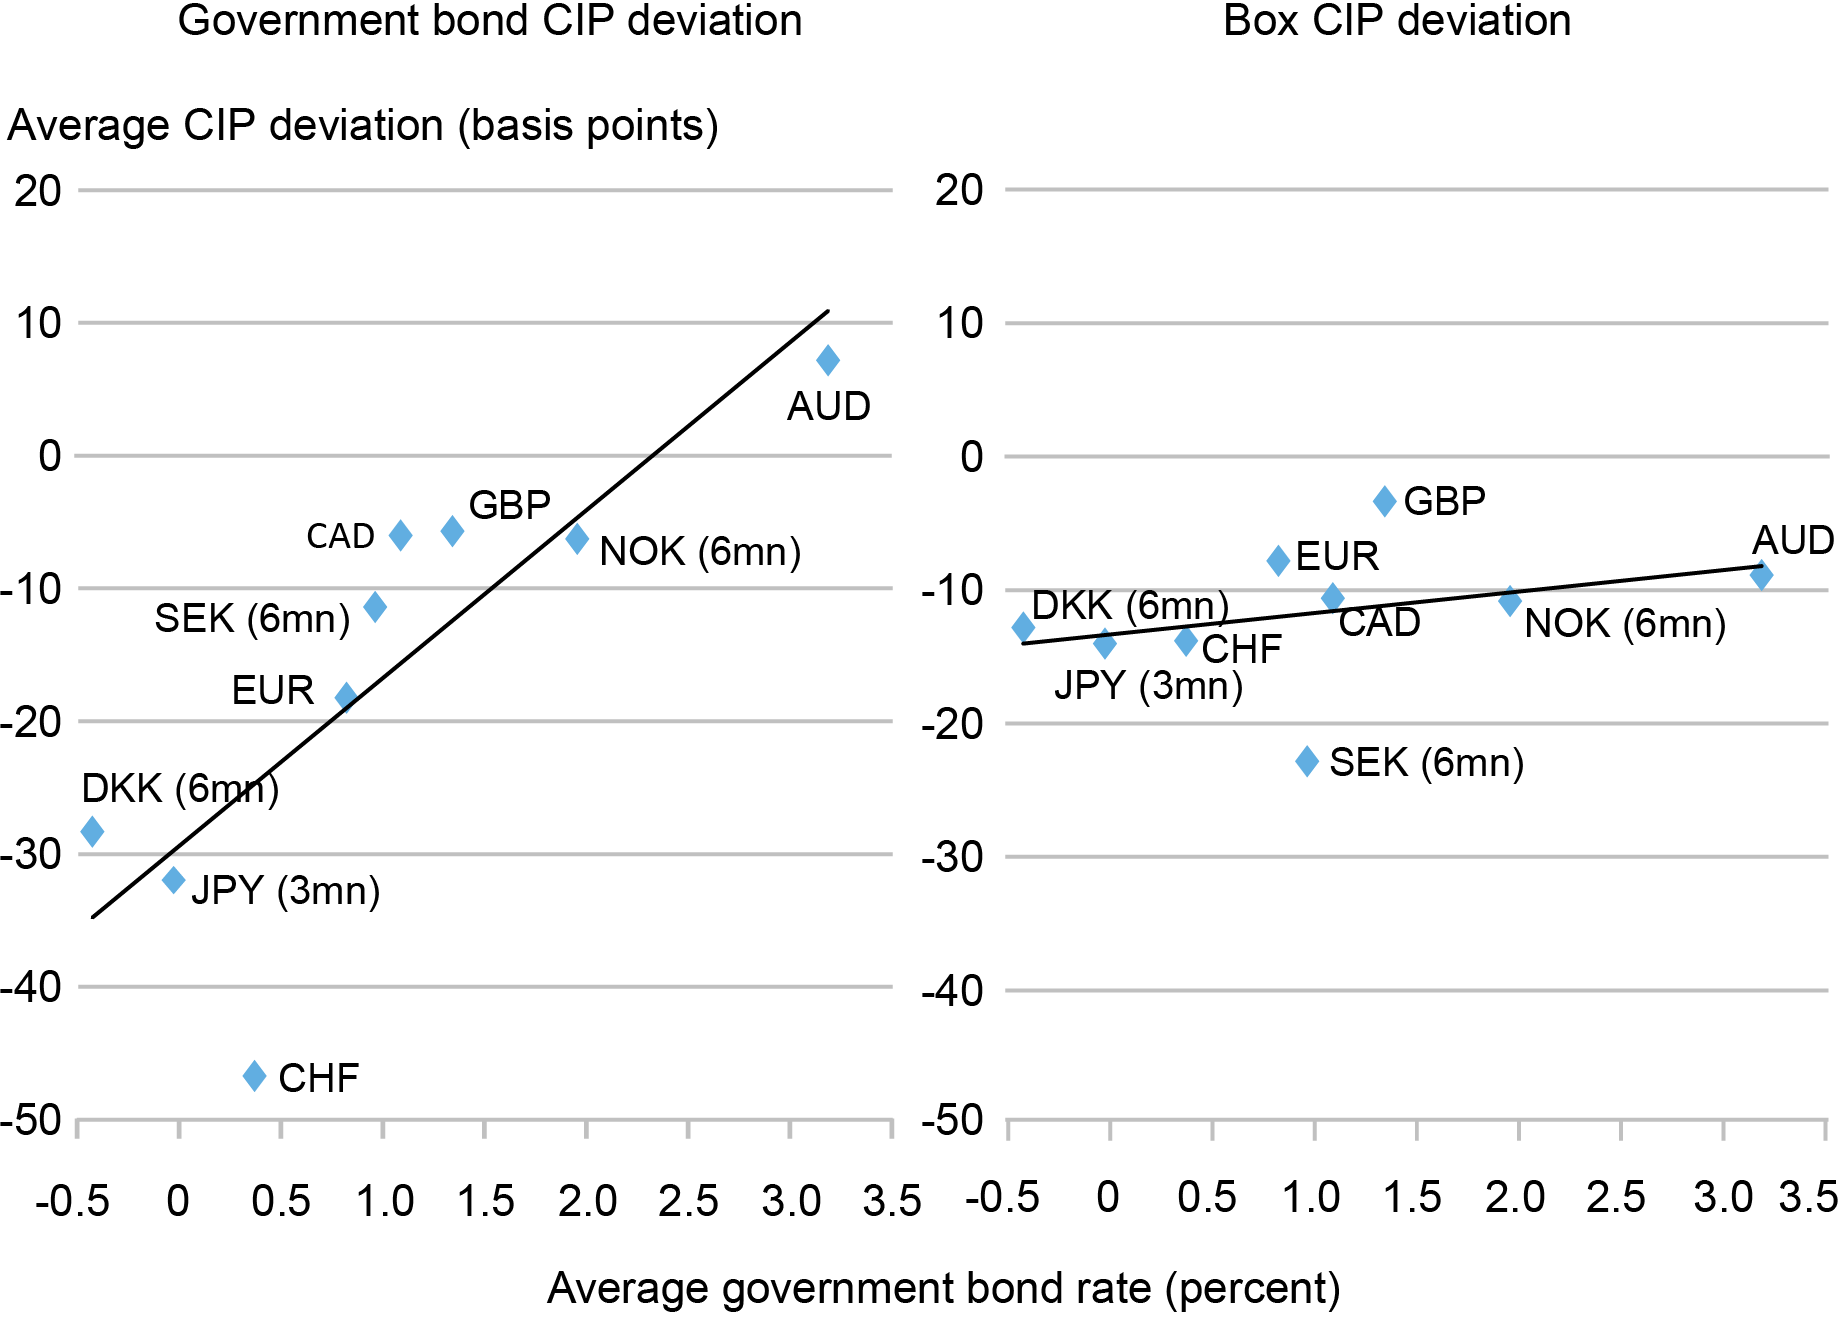
In the chart below, we show the relationship between CIP deviations and the level of interest rates. As in prior studies, we find a strong correlation between government bond CIP deviations and the level of interest rates. However, we find almost no relationship between box rate CIP deviations and the level of interest rates. For the box rate, the dollar rate is around 10 basis points lower than a synthetic dollar interest rate implied by a currency-hedged foreign box rate. This spread is very similar across countries, suggesting that there is a roughly constant cost of international arbitrage between the U.S. and each other country in our data on average.
CIP Deviations Less Correlated with Interest Rates When Measured with Box as Opposed to Government Bond Rates
Source: Intercontinental Exchange (ICE), Thomson Reuters Tick History Data, and OptionMetrics.
Note: The chart plots the average CIP deviation for government bond rates (left panel) and for box rates (right panel) against average government bond rates from January 2004 to July 2020 when data is available. The sample period for each currency is reported in the paper. The CIP deviation is computed for a 1-year maturity in all countries except Norway, Sweden, and Denmark where we use 6-month rates and Japan where we use 3-month rates for a larger sample of observations from which we estimate the average convenience yield.
Interpreting the International Role of the Dollar
Two of our results above relate to the special role of the dollar in international finance. First, we find that the U.S. convenience yield is the fifth largest of ten countries. After controlling for the level of interest rates, U.S. convenience yields are neither unusually large nor small. Second, the U.S. box rate lies roughly 10 basis points below the dollar rate implied by a currency-hedged version of any foreign country’s box rate. In our paper, we explain these facts with a theoretical model where the crucial difference between the dollar and other currencies is that international financial arbitrageurs are funded with dollar-denominated debt.
During financial crises, dollar convenience yields and CIP deviations both dramatically spike. A common interpretation of these facts is that dollar-denominated debt has a particularly large convenience yield that is especially sensitive to stress in financial markets. In contrast to previous work, we directly measure foreign convenience yields and find that they are also sensitive to crises. In addition, we find that box CIP deviations (which do not reflect a convenience yield) also increase in magnitude during crises. Our theoretical model explains these facts by having the dollar serve as the unique funding currency of international arbitrage, rather than having dollar safe assets with unusually large convenience yields.
William Diamond is an assistant professor of finance at The Wharton School, University of Pennsylvania.

Peter Van Tassel is a financial research economist in Capital Markets Studies in the Federal Reserve Bank of New York’s Research and Statistics Group.
How to cite this post:
William Diamond and Peter Van Tassel, “A Look at Convenience Yields around the World,” Federal Reserve Bank of New York Liberty Street Economics, October 3, 2023, https://libertystreeteconomics.newyorkfed.org/2023/10/a-look-at-convenience-yields-around-the-world/
BibTeX: View |


Disclaimer
The views expressed in this post are those of the author(s) and do not necessarily reflect the position of the Federal Reserve Bank of New York or the Federal Reserve System. Any errors or omissions are the responsibility of the author(s).
 RSS Feed
 Follow Liberty Street Economics