Gauti Eggertsson
In 1937, on the eve of a major policy mistake, U.S. economic conditions were surprisingly similar to those in the nation today. Consider, for example, the following summary of economic conditions: (1) Signs indicate that the recession is finally over. (2) Short-term interest rates have been close to zero for years but are now expected to rise. (3) Some are concerned about excessive inflation. (4) Inflation concerns are partly driven by a large expansion in the monetary base in recent years and by banks’ massive holding of excess reserves. (5) Furthermore, some are worried that the recent rally in commodity prices threatens to ignite an inflation spiral.
While this summary arguably describes current trends, it is taken from an account of conditions in 1937 that appears in “The Mistake of 1937: A General Equilibrium Analysis,” an article I coauthored with Benjamin Pugsley. What we call “the Mistake of 1937” was, in broad terms, a decision by the Fed and the administration to implement a series of contractionary policies that choked off the recovery of 1933-37 and brought on the recession of 1937-38, one of the worst on record. What is particularly noteworthy is that the inflation fears that triggered the Mistake of 1937 were largely driven by a rally in commodity prices. These circumstances invite direct comparison with our own time, when a substantial recent rise in commodity prices (which now seems to be abating somewhat) stoked inflation fears and led some commentators to call for an increase in the federal funds rate.
The question for the contemporary reader is this: If we could transport a modern-day economist back to 1937, would he or she have made the same mistake? My suggested answer—admittedly somewhat hopeful—is no. I base this view on the fact that most economists today distinguish between the temporary movements in the consumer price index that stem from volatility in commodity prices and the movements that reflect fundamental inflation pressures. Hence a modern economist most likely would have identified the price rise in 1936 and 1937 as a temporary upswing in commodity prices that did not signal a significant increase in overall inflation.
The Mistake and Its Consequences
The Mistake of 1937 was a preemptive policy tightening in a fragile economic environment. Specifically, it was a decision to abandon the policy of “reflation” introduced in 1933. After prices tumbled during the 1929-33 depression, the administration of Franklin Delano Roosevelt (FDR) and the Federal Reserve made a commitment to increase the price level to pre-depression levels. (For more on this key initiative of the 1933-37 recovery period, see my article in the American Economic Review, “Great Expectations and the End of the Depression.”) The reflation policy was backed by an aggressive increase in government spending, the maintenance of large deficits, the abandonment of the gold standard, and monetary easing. If we accept the account of modern macroeconomic models, this reflationary policy mix can be very expansionary once the short-term interest rate is constrained at zero (as it was at the time). Why? Because at zero interest rates, if people start expecting that prices will rise instead of continuing to fall, the real rate of interest—a critical determinant of aggregate spending—turns from positive to negative. Thus, it becomes economical to spend money rather than save it. A further benefit of reflation is that it can repair balance sheets of overleveraged households and firms, a point explained in more detail in my recent paper with Paul Krugman, “Debt, Deleveraging, and the Liquidity Trap.”
The Mistake of 1937 was to relinquish the benefits of reflation and to set all policy levers in reverse. The Fed and key administration officials hinted at interest rate hikes and endorsed austerity in fiscal policy; the key concern now was containing inflation rather than sustaining recovery.
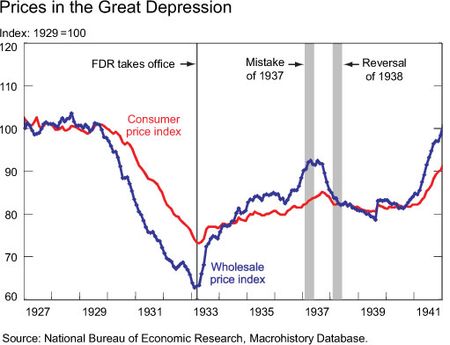
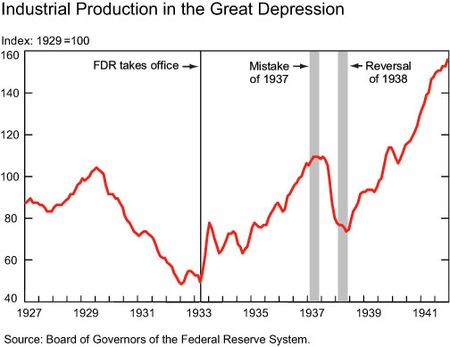
The effects of this policy reversal on prices and production are evident in the charts below. The top chart tracks the consumer price index (CPI) and the wholesale price index (WPI) over the period 1927-41, while the bottom chart plots the movements in industrial production over the same period. In both charts, the first vertical line marks the point at which FDR became president and announced a policy of reflation, while the second vertical line marks the Mistake of 1937. What we see in the top chart is that at the time in 1937 when the administration started warning that inflation was too high, the price level had not yet reached the pre-depression levels that had previously been the administration’s goal. Following this policy reversal, both prices and industrial production tumbled. The line indicating the “reversal of 1938” marks the point when the administration recommitted to inflating the price level to pre-depression levels. Significantly, this renewed commitment was followed by robust growth, as the bottom chart makes clear.
The Role of Commodity Prices
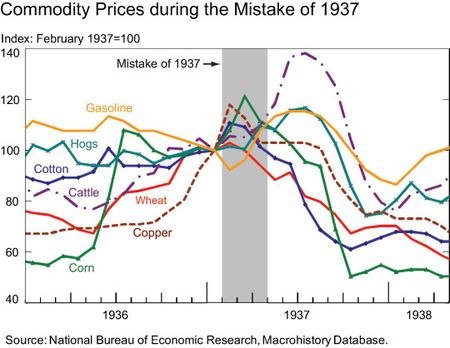
What prompted the inflation fears that led to the tightening of policy in 1937? A rally in commodity prices was largely responsible for triggering the concerns about inflation. As the chart below shows, prices of several commodities more than doubled in the span of only one year. These price increases led many policymakers to express concern about excessive inflation, as my paper with Pugsley documents.
It is unlikely, however, that a modern economist put in the same position would respond to the commodity price rise in the same way. Economists today generally do not focus on commodity prices without regard to the behavior of the aggregate price index. The rally in the commodity markets in 1936 and 1937 seems to have been driven largely by temporary supply factors, rather than by upward pressures in the overall price level. This finding is borne out by the fact that while the price of some commodities (such as corn) more than doubled between 1936 and the Mistake of 1937, the CPI rose at a slower pace (see the first chart in this post), peaking at a 4.8 percent year-on-year rate in May 1937. What this reflects, I believe, is that while some components of the CPI were very volatile, the aggregate index was not moving much at all.
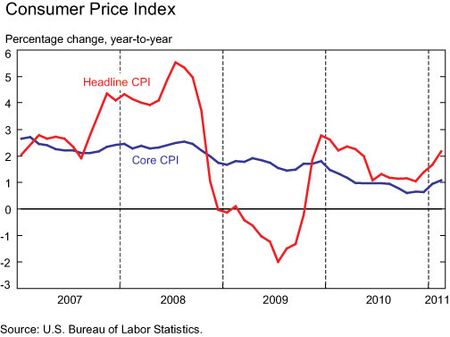
Fed economists today typically monitor various components of the CPI that are not influenced strongly by temporary supply disruptions. For example, one common measure tracked is “core CPI,” which excludes volatile food and energy prices from the overall CPI bask
et (see chart below). In early 2008, the economy started a downward spiral that culminated in a crisis. As the economy’s direction became increasingly clear, economists became more concerned about downward price pressures than about inflationary pressures. This shift paved the way for aggressive interest rate cuts that year, with rates ultimately declining to zero.
At the same time, however, there was a temporary rally in commodity prices, driven by a rise in oil prices in early 2008, as can be seen in the figure above. This development prompted some commentators to warn against “excessive inflation.” But Fed economists and many others judged that the rise in prices was specific to commodities and did not signal an increase in overall price pressures. Largely ignoring the temporary rally in commodity prices, the Fed focused instead on core inflation and some alternative price measures that did not move much even as the CPI peaked in July 2008 at a year-on-year rate of 5.5 percent. This judgment proved to be correct: the larger trend in the aggregate price level during the crisis turned out to be downward, despite relatively volatile commodity markets during this period.
The bottom line, then, is that it is unlikely that a modern economist transported back in time to 1937 would have preemptively tightened policy on the scale that policymakers did at the time. Today’s economists, guided by economic research on general equilibrium models over the past several decades (see, for example, Eusepi, Hobjin, and Tambalotti), are a bit better at distinguishing movements in relative prices driven by temporary disruptions—such as the rally in commodity markets in 1937—from movements in core inflation, which may reflect broader inflation pressures.
Disclaimer
The views expressed in this post are those of the author(s) and do not necessarily reflect the position of the Federal Reserve Bank of New York or the Federal Reserve System. Any errors or omissions are the responsibility of the author(s).


 RSS Feed
 Follow Liberty Street Economics
That is a good question and is addressed a bit in the paper linked here: http://www.ny.frb.org/research/economists/eggertsson/Eggertsson_1108.pdf The key aspect of this period in US economic history is that the short-term nominal interest rate at this time was – as now – close to zero. One implication of this is that then money and short-term government bonds become close to perfect substitutes. At that point the short-run relationship between money and inflation breaks down and hence keeping track of the evolution of the money supply becomes much less informative than at positive interest rates.
This is an interesting article, but isn’t there something missing? What were the money supply changes during this period? For example, without knowing what the money supply – and in particular what the total of bank deposits was as a component of that – was doing, it’s impossible to say whether the rise in commodity prices was due to increases in the money supply, or to increased demand for commodities. The Great Depression period in particular was marked by extreme fluctuations in the bank deposit component of the money supply, due both to debt default and bank failure, and debt repayment. Similarly today – the evidence around the world supports an out of control banking system with rapid expansion of of money as represented in bank deposits as the cause for the apparent rise in commodity prices, rather than supply/demand issues. India’s money supply(M3) appears to have expanded by 15% over the last year, China’s M2 measure by 15.7%.