


Jason Appleson, Eric Parsons, and Andrew F. Haughwout
In our recent post on the state and local sector, we argued that structural problems in state and local budgets were exacerbated by the recession and would likely restrain the sector’s growth for years to come. The last couple of years have witnessed threatened or actual defaults in a diversity of places, ranging from Jefferson County, Alabama, to Harrisburg, Pennsylvania, to Stockton, California.
But do these events point to a wave of future defaults by municipal borrowers? History—at least the history that most of us know—would seem to say no. But the municipal bond market is complex and defaults happen much more frequently than most casual observers are aware. This post describes the market and its risks.
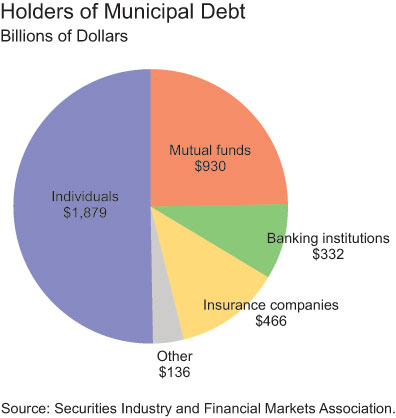
The $3.7 trillion U.S. municipal bond market is perhaps best known for its federal tax exemption on individuals and its low default rate relative to other fixed-income securities. These two features have resulted in household investors dominating the ranks of municipal bond holders. As shown below, individuals directly hold more than half, or $1.879 billion, of U.S. municipal debt; when $930 billion in mutual fund holdings is included, the household share rises to three-quarters. Although the low default history of municipal bonds has played a key role in luring investors to the market, frequently cited default rates published by the rating agencies do not tell the whole story about municipal bond defaults.

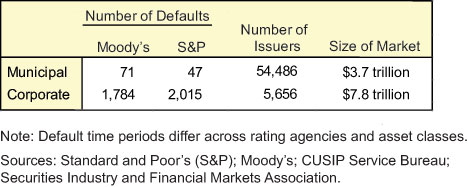
Two large bond rating agencies, Moody’s Investors Service (Moody’s) and Standard and Poor’s (S&P) provide annual default statistics for the municipal bonds that they rate. S&P reports that its rated municipal bonds defaulted only 47 times from 1986 to 2011. Similarly, Moody’s indicates that its rated municipal bonds defaulted only 71 times from 1970 to 2011. As shown in the table below, this record of defaults compares very favorably with the corporate bond market, especially given the larger number of issuers in the municipal bond market.

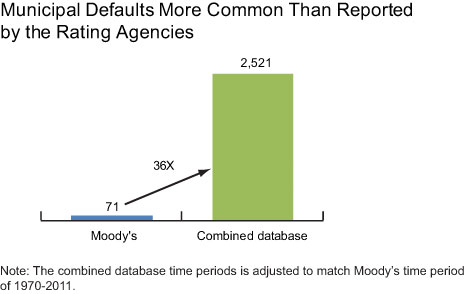
However, not all municipal bonds are rated and the market’s rated universe only tells part of the story. We have developed a more comprehensive municipal default database by merging the default listings of three rating agencies (S&P, Moody’s, and Fitch) with unrated default listings as tracked by Mergent and S&P Capital IQ. Rather than confirming Moody’s 71 listed defaults from 1970 to 2011, our database shows 2,521 defaults during this same period. Similarly, our database indicates 2,366 defaults from 1986 to 2011 versus S&P’s 47 defaults during this same period. In total, we find 2,527 defaults from the period beginning in the late 1950s through 2011. (We don’t have complete information on the number of issues, so we can’t compare default rates.)

Our findings raise the question, What causes such markedly different default frequencies between rated and unrated municipal bonds? Our answer: Not all municipal bonds are created equal. Different types of municipal bonds are secured by very different revenue sources with varying levels of predictability and stability. Furthermore, we believe that rated municipal bonds tend to be self-selected: issuers are less likely to seek ratings if their municipal bonds are not likely to achieve investment grade ratings.

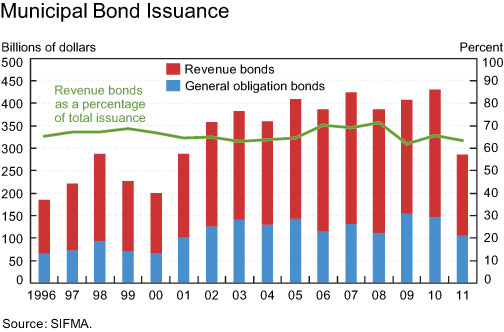
To provide some background, we note that the municipal market is bifurcated into general obligation (GO) bonds and revenue bonds. GO bonds carry the broad full faith and credit pledge of a state or local government.; GO pledges are considered among the strongest type of security because municipalities have the authority to levy taxes; GO defaults like those in Jefferson County and Harrisburg are relatively rare. Revenue bonds, on the other hand, are backed only by a pledge of revenues raised from a specific enterprise, such as an airport, toll road, hospital, or school. GO bonds are therefore stronger than revenue bonds, because the revenue base for general obligations is much broader (for example, the ability to levy taxes on property or citizens within a specific geographic area) than the typical revenue bond
revenue base (for example, a specified stream of revenue or enterprise).
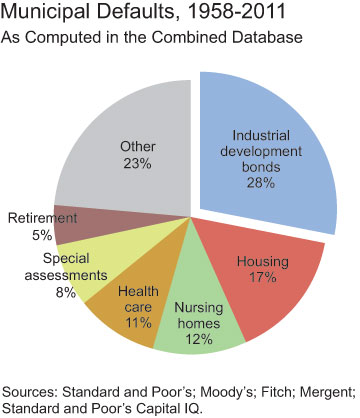
The default risk of a revenue bond varies with the essentiality of the service provided by the enterprise. For example, water and sewer utilities provide essential services and thus have a strong ability to generate revenue. By contrast, the services offered by an alternative energy plant, pollution control facility, or other corporate-like entity may not be considered essential, because of the availability of other energy sources. Thus, these enterprises may have less potential to generate revenue. Alternative energy plants, pollution control facilities, and other corporate-like enterprises are all examples of industrial development bonds (IDBs). IDB financing projects using new technologies or projects with no historical track record tend to make up a majority of unrated IDB defaults.
It is also not surprising that revenue bond sectors, such as IDBs, experienced more defaults than GO bonds because they have made up almost two-thirds of municipal new issuance since the mid-1990s. While total municipal issuance has bounced around over the past sixteen years, revenue bonds have remained between 60 percent and 70 percent of new issuance.

To clarify how the number and behavior of municipal bond defaults compare with those of corporate bond defaults, the graphs below plot each series against the Philadelphia Fed’s national coincident index, a proxy for GDP. In the case of corporate bonds, defaults occur at a higher frequency during recessionary periods. In contrast, the pattern of municipal bond defaults appears less tied to recessionary periods. The absence of a clear pattern leads us to believe that municipal bond defaults may be more a function of idiosyncratic factors associated with individual sectors or issues than the result of broad macroeconomic developments.


The second graph also illustrates one of the main points of our post: the untold story of municipal bonds is that default frequencies are far greater than reported by the major rating agencies. Again, this is partly because the rating agencies’ default numbers only cover bonds that they rate, and the unrated portion of the market can be home to municipal bonds of lower credit quality, exhibiting a higher frequency of defaults. Until recently, investors could take some comfort from the fact that many municipal bonds—both rated and unrated—carried insurance that paid investors in the event of a default. But now that bond insurers have lost their AAA ratings, they no longer play a significant role in the municipal bond market, increasing the risks associated with certain classes and certain issuers of municipal debt.
In a coming post, we will explore a municipal bond sector—industrial development bonds—where defaults have been relatively common, highlighting specific examples of defaults.
Disclaimer
The views expressed in this post are those of the authors and do not necessarily reflect the position of the Federal Reserve Bank of New York or the Federal Reserve System. Any errors or omissions are the responsibility of the authors.

Jason Appleson is a financial/economic analyst in the Risk Analysis and Reporting section of the Credit and Payments Risk Group.

Eric Parsons is an assistant vice president in the Risk Analysis and Reporting section of the Credit and Payments Risk Group.

Andrew F. Haughwout is a vice president in the Office of the Directors Function of the New York Fed’s Research and Statistics Group.
 RSS Feed
 Follow Liberty Street Economics
Thanks to readers for their comments. A couple of commenters indicated that the information in our post is well-known to experts in the muni bond industry. Of course, our LSE post is intended for a much broader audience, which tends to get much or all of its information about municipal bond defaults from the widely cited ratings agency reports. We suspected that some of this information would be of use to those who don’t work directly in the muni bond market. All of the data we provided are factual and were gathered from third-party vendors. A second commonality is that readers would like to see more data on the muni sector. We would as well. As we pointed out in the original post, with the data currently available to us, it is impossible to construct such crucial statistics as default rates by sectors. Additionally, the dollar amount of defaults and recovery rate data were unavailable for the municipal universe that we were analyzing (similarly we don’t have information on unrated corporate bond defaults). Finally, we’d like to remind our readers that our post had two primary goals: to point out (1) the fact that the rating agency statistics, while widely quoted by market professionals and the press, don’t tell the whole story of municipal bond defaults, and (2) that the defaults that have occurred are concentrated in certain sectors, are more idiosyncratic in nature, and do not seem to have a strong tie to the macro economy. We believe that the post and the comments indicate that both points are correct. We thank the readers again for their interest and look forward to hearing feedback on our posts to follow.
This is not complete without a word on recovery from defaulted bonds. Implying that unrated bonds are risky without allowing that investor experience depends on the price paid for a security could be misleading. Buying a bond at the right price, which could be a material discount, can produce repeatable success.
Pretty thin gruel. The “Municipal Defaults, 1958-2011” should be re-done bifurcating each slice of the pie into rated and unrated defaults and then the same pie chart should be presented in dollar terms. “Other” should be broken down into GO, Essental Revenue and then other. Of course, ultimate loss rates expressed as percentages of issuance would also be nice to know. For defaults of rated bonds it would be nice to know the metrics by rating source and grade.
The data imply that the market has a large number of small issues, at least compared to the corporate market. If the small size of issues for muni bonds — revenue or otherwise — makes rating less likely and other forms of distribution, such as private placements, more likely, perhaps this accounts for the larger number of defaults in the unrated sector. Also, could you give the dollar volume of defaults also, instead of just the number. If most muni defaults are very small, the larger number when the unrated issues are included may still not be economically meaningful compared to corporate defaults, for example, or compared to total defaults, including rated issuance
Of course the default rate for rated issues is lower than that for unrated issues. It’s like pointing out that the injury rate for Nascar is lower than that for Isle of Man.
Good work by the authors. It’s important to realize the different default rates for the different sectors of the muni market. Most muni defaults are in “dirt bonds”(community development),multi-family housing and the Industrial Development Bonds mentioned. Stay away from those sectors in your investing and you are relatively safe. Fitch did a similar study around 1985 but it is a good time to bring the subject up again. Jefferson County is a poor example for GOs. The county didn’t have the ability to raise taxes- only the state did.
It’s a relief to finally read an article focused on the Municipal sector that isn’t centered around the deficit issues in California. While this is important to monitor, I believe the media consistently misses where the most credit risk lies in municipal securities. Also, while the city of Harrisburg, PA (along with numerous others) have been on an epic borrowing binge, it should be noted that the spark that lite the fire for this city actually revolves around the incinerator facility. This facility, originally built in 1969, has accumulated $310 million in debt since its construction. This ties in well with the main theme of the article.
Beyond the different risks associated with many corporate-backed or enterprise-style revenue bonds, it is also important to recognize that all “GO’s” are not the same. General Obligation bonds have different security features in different states, which can make a material difference in credit quality, especially during periods of stress. Among others that have commented on this, see Robert Doty’s comment on the difference between General Obligation and General Fund Securities in today’s (8-16-12) Bond Buyer.
You actually read this post right? Not sure where you got “Bonds default more during times of economic stress.” “In contrast, the pattern of municipal bond defaults appears less tied to recessionary periods. The absence of a clear pattern leads us to believe that municipal bond defaults may be more a function of idiosyncratic factors associated with individual sectors or issues than the result of broad macroeconomic developments.”
To the Authors, I found the information fasinating but not complete. When you compared the muni defaults, including non-rated, to corporates, it was unclear if you also included those corporate bonds that defaulted but were not rated to make an apple-to-apple comparison. The information on Industrial Development Bonds is also confusing. By dollar volume but not number,Investor-owned utilites back approximately half of IDBs for various pollution financing. However, their number of transactions is far lower and usually rated since their IDB deals are typically large. Did the sub-sector of utility-backed IDBs also incurr 28% of the defaults or was it far lower
Thanks to the authors and the fed for this fine study. The painful truth is that as debt increases, so do the risks it will be politically, economically and financially worthwhile for borrowers to walk away from paying back their loans to bondholders. To see a real time list of the largest defaulted municipal bonds. http://www.bondview.com/defaultedbonds/largestdefaults Regarding comments by David Merkel, looking at the current marketplace, rated bonds (Sacramento, San Bernadino, Stockton) seem to be defaulting more than unrated bonds. Jim Walker Bondview.com
Can you define default more concisely to make sure that we are comparing apples and apples? The low number of defaults is consistent with the very low number of chapter 9 cases. Are there “technical” defaults in the revenue bond market when expected revenues do not materialize and there is an adjustment in bond servicing terms?
More interestingly, how many of these were insured and how is that reflected in recovery rates?
“GO pledges are considered among the strongest type of security because municipalities have the authority to levy taxes; GO defaults like those in Jefferson County and Harrisburg are relatively rare. Revenue bonds, on the other hand, are backed only by a pledge of revenues raised from a specific enterprise, such as an airport, toll road, hospital, or school. GO bonds are therefore stronger than revenue bonds” this statement is so full of mis-information and omission that it borders on irresponsible. further, the focus on number of issuers as opposed to par amount — which is the basis of the entire ‘shock value’ — is equally irresponsible. lastly, I’ll echo Mr Merkel: duh
The number of defaults you report is lower than that reflected in the Income Securities Advisor municipal bond default database, so it would be worthwhile to cross reference that data source as well. See http://www.distresseddebtsecurities.com/. To put this in perspective, the market is estimated to encompass some 60,000 issuers, so the annual default rate for all municipals is extremely low even if you include the unrated issuers. This is the conclusion reached in Kroll Bond Rating Agency’s Municipal Default Study published last year.
Unrated bonds default more. Bonds funding projects that are not economic necessities to municipalities default more. Bonds default more during times of economic stress. These are trivial insights that anyone with the least connection to the muni market already knows. Tell us something we didn’t already know in your next piece.