Thomas M. Eisenbach, David O. Lucca, and Karen Shen
Stocks are usually offered in initial public offerings (IPOs) at a discount,
leading to large first-day IPO returns. When there is a risk of a negative initial return, underwriters are known to actively support the aftermarket price of a stock through buying activities. In this post, we look at the trading book for Facebook stock on May 18, 2012, the day of its highly anticipated IPO. Using what we call a “large integer–price bid” identification assumption to indirectly infer which investors are bidding, we find evidence of significant trading by underwriters seeking to stabilize the stock’s price. This evidence suggests that underwriters incurred significant costs as a result of these activities.
In an IPO, a company sells its shares to the public on a securities exchange for the first time. IPOs are generally conducted with the assistance of one or more investment banks acting as underwriters. The underwriters play three roles in the IPO process: They provide the company with procedural and financial advice, they buy the issue from the company, and they resell it to the public. A major task of the underwriters is setting the IPO price. The finance literature finds that IPOs are generally underpriced in the short run and overpriced in the long run. To date, there is no consensus on the drivers of these patterns (Ritter and Welch 2002).
The underwriters in an IPO try to get the price of its shares “right” by gauging demand in roadshows and conducting their own analysis. In addition, however, the issuing firm may offer underwriters a way of reducing initial market price volatility that is known as the over-allotment or “greenshoe” option. Under this option, which is sanctioned by the Securities and Exchange Commission, the underwriters sell to
the public a certain number of extra shares, usually 15 percent of the
issuance, in addition to the original offering that they purchased from the
issuing firm. If demand for the stock is unexpectedly high, the extra shares
reduce upward price pressure and are issued to the underwriters retroactively at the IPO price. However, if demand for the stock is unexpectedly low, the underwriters buy back the extra shares in the marketplace, thus helping to stabilize the price. In economic terms, the “greenshoe” option lends some elasticity to the supply of shares so that the price impact of demand fluctuations is dampened. As explained by Aggarwal (2000) and Lewellen (2006), this over-allotment option is the main mechanism used by underwriters to stabilize the price. In the case of Facebook, the underwriters were given the right to sell slightly more than 63 million additional shares, 15 percent of the issuance of about 421 million shares.
Writing about the Facebook IPO in a post on the blog Dealbreaker, Matt
Levine found evidence of stabilizing trades by dealers in the fact that about 43 million Facebook shares were exchanged exactly at the IPO price of $38 on the IPO day. Is there any additional support for this interpretation or evidence of other such trades during the day?
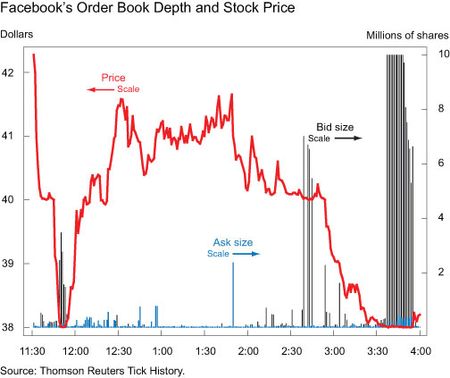
Price fluctuations on the IPO day were significant, as shown in the chart below. After being issued at a price of $38 per share, the stock traded at $42.05, quickly dropped to $38, and then shot back up to around $41.50, all in the first hour of trading. Later in the day, after trading at around $41 for a while, the stock gradually returned to $38 before closing the day at $38.23.
To find potential stabilizing activities, we look at the depth of the order book and plot the number of stocks that sellers were willing to sell at the best ask price (the “ask size”) and the number of stocks that buyers were willing to buy at the best bid price (the “bid size”) during each minute.
The chart shows an interesting pattern in the willingness to buy, which spikes suddenly at several points during the day. The initial spike in bid size occurs at around 11:50 a.m., when the price first drops to $38, and disappears once the price increases again. The second spike occurs around 2:40 p.m., when the price hovers at $40, and disappears once the price falls below $40. Finally, the third and largest spike appears in the half hour before the market closes, when the price is again around $38, disappearing when the price starts climbing in the final few minutes
of trading.
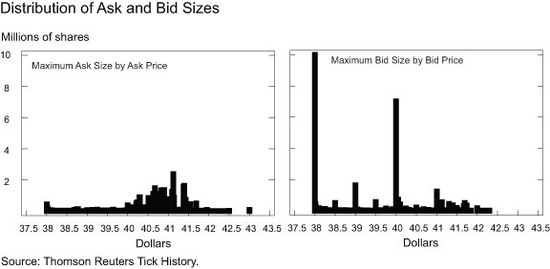
This pattern suggests that there may be something special about the prices of $38 and $40. The two charts below show the distribution of ask sizes and bid sizes across prices by plotting for every price the maximum willingness to sell and maximum willingness to buy observed at
that price during the day. The plots show that the depth of the buy book at $38 and at $40 is indeed significantly greater than at any other price (followed by additional spikes at the other integer prices of $39 and
$41). By contrast, the distribution of the willingness to sell appears to be
relatively evenly distributed across prices; there seems to be no difference
between integer and non-integer prices, consistent with the idea that selling behavior was driven by small individual investors. We suggest that the large bids at the integer prices of $38 and $40 are likely stabilizing trades by the underwriters as they attempted to support the falling stock price at these points during the day. (Note that since our data do not identify individual investors, this identification is based only on indirect inference.)
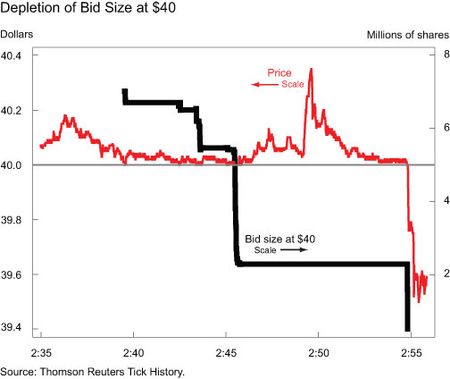
The two attempts at $38 appear to have been successful, as the price never dips below this point. By contrast, the support at $40 appears to have been unsuccessful, lasting for just over fifteen minutes. To study this episode in more detail, we zoom in on the time period between 2:35 p.m. and 3:00 p.m. and track the depth of the order book at $40.
We first observe the willingness to buy at $40 at 2:39 p.m., when a depth of 7,015,600 shares is observed once the price falls to $40. As the price hovers at or slightly above $40, we see the buy orders being depleted. Shortly before 2:55 p.m. the willingness to buy at $40 appears to be fully depleted and we see that the price immediately breaks the barrier of $40 and drops significantly.
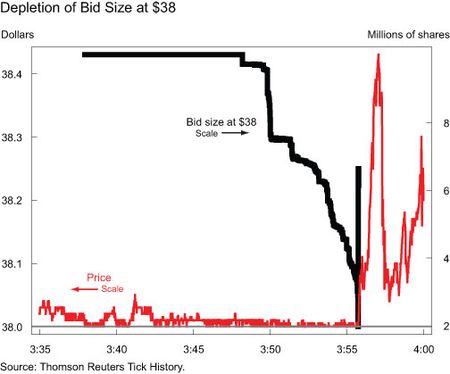
We compare this chart with the same chart for the period between 3:35 p.m. and 4:00 p.m. below. Around 3:38 p.m., the price falls to $38, and we observe a willingness to buy of 9,999,900 shares. (Note that 9,999,900 shares is the maximum number the Nasdaq feed is able to display even if actual orders are higher.) The price stays around $38, never falling below $38, for the next twenty minutes, and we again see the willingness to buy being slowly depleted. However, in contrast with the $40 case described above, the buy orders in this case are never fully depleted. In fact, at about 3:55 p.m., more orders at $38 seem to be added to the order book. Shortly after this addition, the price begins to rise and doesn’t fall back to $38 that day. We conclude that the underwriters’ attempt to support the price at $38 was successful.
What are the underwriters’ incentives to stabilize prices? Underwriters have conflicting objectives on the day of the IPO when the stock price appears at risk of falling below the issuing price. Their obligation to the firm—and their reputation—pushes them to support the stock, especially around the IPO price. However, this does not serve their short-run profit interests. Indeed, notice that because of the greenshoe option, which is equivalent to a short position on the stock and a call option at $38, the underwriters are effectively long a put option with a strike price of $38. (For simplicity, we ignore the fact that underwriters receive all shares, including the over-allotment, at a small discount to the issuing price.) Such an option would become valuable were the price to drop below $38
and should therefore never be exercised above the strike price. In particular, in order to cover the short position created by the over-allotment, underwriters should never buy at a price above $38 in the open market because they could instead exercise the greenshoe option. Contrary to this reasoning, we find that the greenshoe option was never exercised (based on the free-float level following the IPO of 421 million shares), but that there was significant buying activity at and above the strike price (specifically, at $38 and $40), which we interpret as being driven by underwriters’ stabilization attempts.
Based on our identification assumption, the evidence we produced suggests that not only did the underwriters forfeit the profits they could have made by covering their short position with shares bought in the marketplace below the offering price had they let the price fall, they also incurred costs through the stabilization attempt at $40. Assuming that they purchased all shares traded at the $40 price (about 34 million shares), we calculate that underwriters spent about $66 million supporting the stock, or almost 40 percent of their underwriting fees. If this estimate is correct, underwriters’ reputational concerns and obligations to the firm may have outweighed their short-run profit motive.
Disclaimer
The views expressed in this post are those of the authors and do not necessarily reflect the position of the Federal Reserve Bank of New York or the Federal Reserve System. Any errors or omissions are the responsibility of the authors.
Thomas M. Eisenbach is an economist in the Money and Payments Studies Function of the New York Fed’s Research and
Statistics Group.

David O. Lucca is an economist in the Capital Markets Function of the Group.

Karen Shen is an undergraduate intern in the Capital Markets Function of the Group.


 RSS Feed
 Follow Liberty Street Economics