Fernando M. Duarte and Carlo Rosa
We surveyed banks, we combed the academic literature, we asked economists at central banks. It turns out that most of their models predict that we will enjoy historically high excess returns for the S&P 500 for the next five years. But how do they reach this conclusion? Why is it that the equity premium is so high? And more importantly: Can we trust their models?
The equity risk premium is the expected future return of stocks minus the risk-free rate over some investment horizon. Because we don’t directly observe market expectations of future returns, we need a way to figure them out indirectly. That’s where the models come in. In this post, we analyze twenty-nine of the most popular and widely used models to compute the equity risk premium over the last fifty years. They include surveys, dividend-discount models, cross-sectional regressions, and time-series regressions, which together use more than thirty different variables as predictors, ranging from price-dividend ratios to inflation. Our calculations rely on real-time information to avoid any look-ahead bias. So, to compute the equity risk premium in, say, January 1970, we only use data that was available in December 1969.
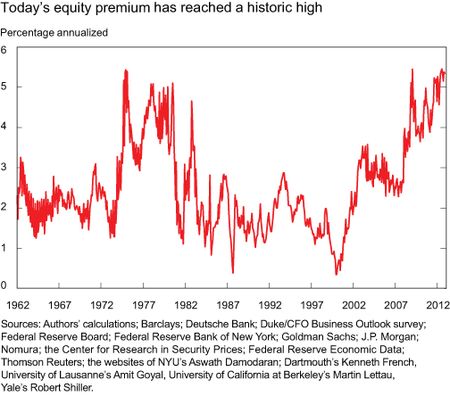
Let’s now take a look at the facts. The chart below shows the weighted average of the twenty-nine models for the one-month-ahead equity risk premium, with the weights selected so that this single measure explains as much of the variability across models as possible (for the geeks: it is the first principal component). The value of 5.4 percent for December 2012 is about as high as it’s ever been. The previous two peaks correspond to November 1974 and January 2009. Those were dicey times. By the end of 1974, we had just experienced the collapse of the Bretton Woods system and had a terrible case of stagflation. January 2009 is fresher in our memory. Following the collapse of Lehman Brothers and the upheaval in financial markets, the economy had just shed almost 600,000 jobs in one month and was in its deepest recession since the 1930s. It is difficult to argue that we’re living in rosy times, but we are surely in better shape now than then.
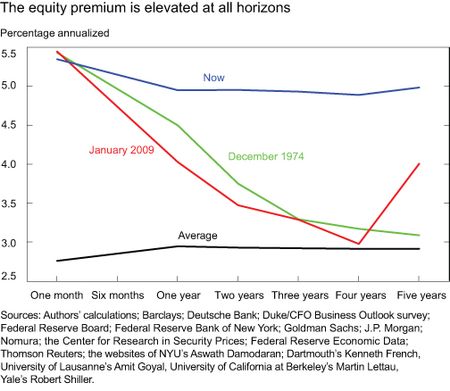
The next chart shows a comparison between those two episodes and today. For 1974 and 2009, the green and red lines show that the equity risk premium was high at the one-month horizon, but was decreasing at longer and longer horizons. Market expectations were that at a four-year horizon the equity risk premium would return to its usual level (the black line displays the average levels over the last fifty years). In contrast, the blue line shows that the equity risk premium today is high irrespective of investment horizon.
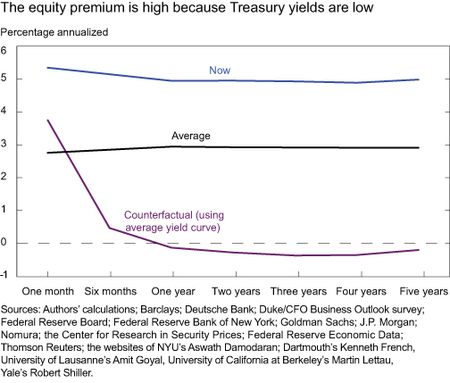
Why is the equity premium so high right now? And why is it high at all horizons? There are two possible reasons: low discount rates (that is, low Treasury yields) and/or high current or future expected dividends. We can figure out which factor is more important by comparing the twenty-nine models with one another. This strategy works because some models emphasize changes in dividends, while others emphasize changes in risk-free rates. We find that the equity risk premium is high mainly due to exceptionally low Treasury yields at all foreseeable horizons. In contrast, the current level of dividends is roughly at its historical average and future dividends are expected to grow only modestly above average in the coming years.
In the next chart we show, in an admittedly crude way, the impact that low Treasury yields have on the equity risk premium. The blue and black lines reproduce the lines from the previous chart: the blue is today’s equity risk premium at different horizons and the black is the average over the last fifty years. The new purple line is a counterfactual: it shows what the equity premium would be today if nominal Treasury yields were at their average historical levels instead of their current low levels. The figure makes clear that exceptionally low yields are more than enough to justify a risk premium that is highly elevated by historical standards.
But none of this analysis matters if excess returns are unpredictable because the equity risk premium is all about expected returns. So…are returns predictable? The jury is still out on this one, and the debate among academics and practitioners is alive and well. The simplest predictive method is to assume that future returns will be equal to the average of all past returns. It turns out that it is remarkably tricky to improve upon this simple method. However, with so many models at hand, we couldn’t help but ask if any of them can, in fact, do better.
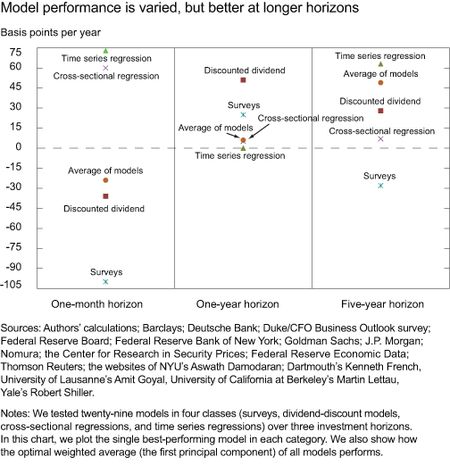
The table below gives the extra returns that investors could have earned by using the models instead of the historical mean to predict future returns. For investment horizons of one month, one year, and five years, we pick the best model in each of the four classes we consider together with the weighted average of all twenty-nine models. We compute these numbers by assuming that investors can allocate their wealth in stocks or bonds, and that they are not too risk-averse (for the geeks again, we solved a Merton portfolio problem in real time assuming that the coefficient of relative risk aversion is equal to one). The table shows positive extra returns for most of the models, especially at long horizons.
At face value, this result means that the models are actually helpful in forecasting returns. However, we should keep in mind some of the limitations of our analysis. First, we have not shown confidence intervals or error bars. In practice, those are quite large, so even if we could have earned extra returns by using the models, it may have been solely due to luck. Second, we have selected models that have performed well in the past, so there is some selection bias. And of course, past performance is no guarantee of future performance.
Disclaimer
The views expressed in this post are those of the authors and do not necessarily reflect the position of the Federal Reserve Bank of New York or the Federal Reserve System. Any errors or omissions are the responsibility of the authors.

Fernando M. Duarte is an economist in the Research and Statistics Group of the Federal Reserve Bank of New York.

Carlo Rosa is an economist in the Markets Group of the Federal Reserve Bank of New York.


 RSS Feed
 Follow Liberty Street Economics
In reply to David: Great quote!
In reply to James: The fact that the time-series regression beats the average of models at a five-year horizon can mean a few different things. We do not show standard errors, so even though the time-series performs better than the average, this effect may not be statistically significant. Another reason why the time-series could perform better than the average is that some models that are included in the average have poor performance at the five-year horizon (in this case, surveys). In terms of models being less good at forecasting than simply relying on what happened in the past, we would not agree with that conclusion. Our study is conducted in “real time,” meaning that all models only use past information to try to predict future returns. So while it is true that time-series rely on what happened in the past, so do other models. A subtle distinction is perhaps that some models are more “forward looking” than others. For example, some models use analyst forecasts of future earnings, but those forecasts are still made by using past information only (unless analysts have perfect foresight).
In reply to AWB: A few reactions to your very good comments. First, there is a one-to-one correspondence between the returns numbers in our last figure and the goodness-of-fit (R2) in a predictive regression. So you can interpret higher returns in that graph as smaller “variance from unknown,” as you call it. Having said that, we do not statistically test for what variables should or should not be included, as you suggest. We take the models we consider as given, where part of each model is to select what variables to use. It would be very interesting to do a variable selection exercise. Inflation (one of the variables you mentioned) is used in one of the time-series regression models, so that one at least is taken care of.
In reply to Alice Lee: Our results are compatible with the idea that low treasury yields are a main factor behind a high equity premium. However, keep in mind that there may be other reasons behind it. The counterfactual exercise we consider of seeing what the ERP would be if yields were equal to their historic means is crude, because it keeps expected stock returns fixed. Expected stock returns may also change when bond yields change. In terms of companies doing better in the future in a weak macroeconomic environment, and whether this can lead to too much speculation, we don’t have much to say in this particular study. A lot more research would be needed to address that question properly.
In reply to Tom: If expected stock returns were fixed, an increase in bond yields would (by definition) lead to a higher equity risk premium. However, in practice, stock returns are not fixed and depend on bond yields. The relation between bond yields and stock prices is not straightforward. But there is some support for your intuition in one of our papers: “Words That Shake Traders,” by Carlo Rosa, published in the Journal of Empirical Finance in 2011.
In reply to Henri: The models we consider are silent about debt, so it is difficult to say whether they are consistent with a sustainable debt or not. Answering that question in a serious manner would require a lot of further research.
In reply to D: In the blog, we say that the jury is still out on whether predictability of returns is really there. You mention one of the studies that finds evidence against predictability. This study falls into the “time-series regressions” category that we mention above, and there are a few other categories to consider. An example of research that argues for the existence of predictability is “Predicting excess stock returns out of sample: Can anything beat the historical average?” by Campbell and Thompson, published in 2008 in the Review of Financial Studies. There is a large literature on this issue; our reading of it is that the debate is not yet settled.
Too Bombastic a Claim from newbie at Fed – Amit Goyal’s reference above in the chart, led me to his site http://www.hec.unil.ch/agoyal/docs/Predictability_RFS.pdf -“We find that by and large, these models{Equity Risk Premium” have predicted poorly both in-sample (IS) and out-of-sample (OOS) for 30 years now; these models seem unstable, as diagnosed by their out-of-sample predictions and other statistics; and these models would not have helped an investor with access only to available information to profitably time the market. (JELG12, G14)”
“We find that the equity risk premium is high mainly due to exceptionally low Treasury yields at all foreseeable horizons.” This is equivalent to admit that the Fed is openly manipulating the value of stocks by pushing interest rates down, which is in effect what has been happening. To say that stocks are cheap at this juncture completely ignores the reality of an economy on Government fueled steroids. Just look at things like student loans and car loans … it is no wonder that the auto industry is doing so well. The Fed clearly still thinks that the health of the stock market is tantamount to the health of the real economy. As an aside, note that much of the high corporate margins have come from cutting wages and all kinds of other costs, which has actually removed resources from the real economy. It is easy to manufacture something that looks like a recovery by exploding the Government balance sheet. The question is what happens next. The time for equilibrium macroeconomic models is over.
Corporate profits at this %GDP level require unsustainable deficits in consumer and/or public sectors. At some point we will have exhausted both and time-series regressions will fail. Which of the 29 models are consistent with a sustainable aggregate debt on a 5-year horizon?
Relative space lacking an absolute valuation perspective. This type of limited analysis is scary and one of the reasons central banks completely missed the build up of structural imbalances.
If equity risk premia are higher because of the low risk free rate, what happens when the risk free rate starts to rise? Point being, if yields rise will it cause the market to decline? We can’t stay at zero forever.
Don Farrar, May 14, 2013 It appears to me that the Fed is creating a new stock “bubble” by keeping fixed income yields artificially low. Thus, the Equity Risk Premium appears to be unusually high and stocks are the only place to go. This can continue until inflation reappears and the Fed is forced to remember its “accord” with the Treasury in 1951 and permits rates to rise again. At this point the stock bubble will be deflated — slowly, if the Fed lets rates rise slowly or with a bang if rates are suddenly permitted to seek market levels. Good luck in attempting to ride the bubble and bail at an optimal moment.
A more interesting question is why corporate profits remain strong in a deflationary zero bound environment.
During my tenure at Harvard (1943-47) majoring in economics in a mostly liberal economics department (I received one of only two magnas by telling the professors what they wanted to hear–a suggestion I would offer all current undergraduates (think Princeton). However the simple logic that no one questioned was that, generally speaking, stock PEs should be higher the lower the return on bonds. Nowadays even Shiller seems to ignore this.
Really interesting findings. That is more scary to me than anything else. Does this show that the current expected trend of treasury yields is what is making the equity premium so high? This is only assuming that companies will do better in the future but the entire economy wouldn’t… can this lead to too much speculation in the stock market?
Any model worth its salt should be able to minimize the variance from unknown, or unused variables via probability testing or inclusion of those factors into the model. Otherwise, the variables used in the model will be less statistically reliable. For example, if inflation forecasts are not incorporated into the equity risk premium model, then the accuracy of the return on equity will only be nominal, and not properly reflect the future value of equity.
Could you publish the 29 equity risk premium models that you used?
Nice post. But your final chart shows that at the five-year horizon the time-series regression still beats the average of the models. In other words, the models are still less good at forecasting than simply relying on what happened in the past (using a time-series regression). This doesn’t seem to be reflected in your conclusion – would you disagree?
The only function of economic forecasting is to make astrology look respectable. John Kenneth Galbraith
Great post. Any chance of a brief bibliography?