Carlos Carvalho, Stefano Eusepi, and Christian Grisse
The 2008-09 global recession produced a significant loss of output and a deflationary scare in many countries. The depth, scale, and duration of the crisis triggered monetary and fiscal policy actions that were “unconventional” in terms of their size and scope, leading to an ongoing debate over the role that these policy responses played in the stabilization process. How and to what extent were these policies effective? In this post, we examine cross-country experiences and find evidence consistent with the idea that the policies contributed to the stabilization process through their effect on expectations of output and inflation.
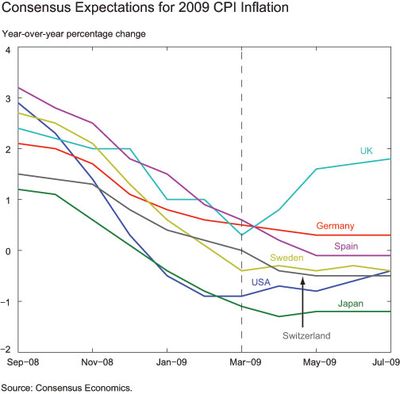
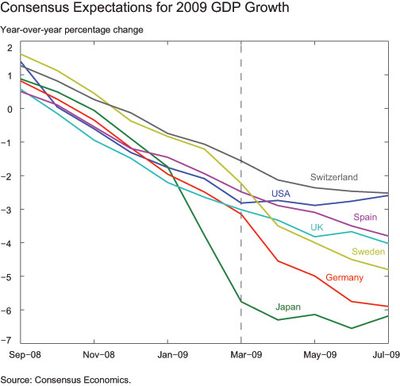
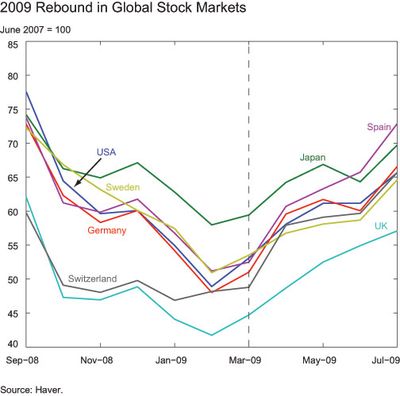
Why look at expectations? The three charts (below) show that although inflation expectations and output growth expectations deteriorated sharply in the aftermath of the Lehman collapse in September 2008, they did show signs of stabilization around March 2009. Furthermore, stocks and other risky assets experienced a rebound around that same time.
There are two other reasons to look at expectations. First, some of the policies put in place were aimed directly at preventing inflation from falling to an uncomfortably low level, such as the asset-purchase program implemented by the Bank of England, and should have had a clear impact on near-term inflation expectations. Second, economic theory assigns a key role to expectations in the policy transmission mechanism; therefore, we should expect these interventions to have significant effects on the economy to the extent that they also affect the expectations of the public.
We examine the relationship between measures of “unconventional” monetary and fiscal policies and changes in survey expectations of output and inflation for the period March–July 2009. The choice of July 2009 for the end of the time period allows us to capture the changes in expectations that we are trying to account for, while at the same time keeping the period narrow. The results using time periods ending in adjacent months are broadly consistent with the findings we report below. We examine survey data collected by Consensus Economics and use the mean forecast for CPI inflation and real GDP growth to measure inflation and growth expectations for 2009 and 2010.
We base our measure of unconventional monetary policies on changes in the size of central banks’ balance sheets during the crisis relative to “normal” times. While such policies took a variety of forms, it is notable that most of them were associated with unusually large balance-sheet expansions. We consider expansions in central banks’ balance sheets for the period February–December 2009. We chose the start of this time period for two reasons. As previously shown, March 2009 roughly coincides with the stabilization in inflation and growth expectations and the rebound in stock markets. In addition, many important unconventional central bank decisions were clustered around March 2009. We include balance-sheet expansions up to December 2009 to account for increases in asset-purchase programs that occurred over the course of 2009, but were already announced or possibly anticipated by the public. The unconventional monetary policy measure is then constructed as the deviation in the balance-sheet expansion during the period February–December 2009 from its trend (average) growth rate during the pre-crisis period January 2005–June 2007.
Our measure of fiscal stimulus is based on the size of fiscal expansions (as a percentage of GDP), collected from announcements made by national authorities. Fiscal stimulus is likely to have both a direct effect on expectations upon announcement and an indirect effect on expectations once it is seen as affecting the real economy. Fiscal policy expansions typically take some time to actually be implemented, so we include announcements made in 2008 and up to April 2009.
Our sample includes the G-20 (Group of Twenty) economies with the exception of Indonesia (for which data on the central bank’s balance sheet were not available) and all euro-area countries except Cyprus, Luxembourg, Malta, Slovenia, and Slovakia. In addition, we include Denmark, Hungary, Israel, New Zealand, Norway, Sweden, Switzerland, and Thailand. For euro-area countries, we use the balance-sheet change of the Eurosystem.
The regression analysis relates changes in inflation and output growth expectations for 2009 and 2010 across countries to our measures of unconventional monetary and fiscal policy for the period March–July 2009. The results indicate that countries that adopted more aggressive monetary and fiscal expansions also experienced larger increases in consensus expectations of inflation and growth for 2009 and 2010. The results suggest that a balance-sheet expansion of 10 percent above trend growth is associated with an 18-basis-point increase in expectations of 2009 inflation and an 8-basis-point increase in expectations of 2010 inflation. Fiscal stimulus does not have a statistically significant link with inflation expectations. In contrast, fiscal expansions were associated with increases in growth expectations for 2009, although the coefficient is not statistically significant for expectations of 2010 growth. Our results for 2009 suggest that a fiscal stimulus of 1 percent of GDP is associated with a 12-basis-point increase in expected growth.
Focusing only on the post-March 2009 changes in survey forecasts might understate the strength of the relationship between policies and expectations. In late 2008, expectations of inflation and growth deteriorated in some countries more rapidly than in others. In these countries, unconventional policies may not have led to an increase in expectations in spring 2009, but may have still succeeded in slowing or halting the decline in expectations.
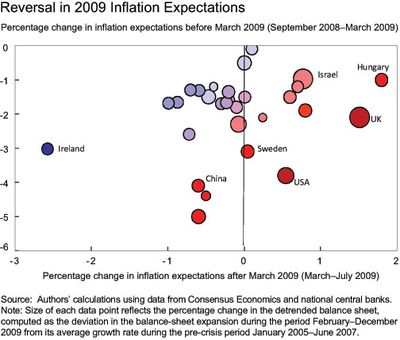
The chart below helps explore this idea visually by plotting the change in expected 2009 inflation that occurred during the period September 2008–March 2009 on the vertical axis, and the change that occurred during the period March–July 2009 on the horizontal axis. Each data point represents a country, with the size of the data points reflecting our previously described measure of unconventional monetary policy for the period February–December 2009. Movements from the “northwest” to “southeast” regions of the chart are associated with countries experiencing larger expectations reversals—that is, larger declines before March 2009 and/or larger increases after March 2009, with larger r
eversals depicted by “warmer” colors (from dark to light blue, light red, and dark red). For example, while Ireland and Sweden experienced a similar 3-percentage-point decline in inflation expectations leading up to March 2009, in spring 2009 expectations stabilized in Sweden, but they continued to deteriorate in Ireland. From this chart, we see that countries that implemented larger central bank balance-sheet expansions during the period February–December 2009 tended to experience larger expectations reversals as well. That is, larger circles tend to be associated with the warmer colors.
To conclude, our results show a positive link between expansionary monetary and fiscal policies and measures of expectations of inflation and real GDP growth. However, one should be cautious in interpreting the findings as evidence of a causal relationship between those policies and expectations. A more detailed analysis of the questions addressed in this post can be found in our working paper.
Disclaimer
The views expressed in this post are those of the author(s) and do not necessarily reflect the position of the Federal Reserve Bank of New York or the Federal Reserve System. Any errors or omissions are the responsibility of the author(s).


 RSS Feed
 Follow Liberty Street Economics