James Vickery
The fraction of mortgage borrowers who choose an adjustable-rate loan has fallen significantly over the past five years or so. Although the fraction edged up slightly in 2010, it remains close to historic lows, with less than 10 percent of mortgage originations since 2009 featuring an adjustable interest rate. What explains the striking decline? And what are its implications for borrowers and policymakers?
U.S. mortgage borrowers face a host of important but difficult financial decisions, including not only how much to borrow and which lender to use, but also what type of mortgage best suits their needs. In the United States, most loans take the form of a thirty-year level-payment fixed-rate mortgage (FRM). Some loans, however, are amortizing adjustable-rate mortgages (ARMs), whose interest rates move with a market rate like the London interbank offered rate (Libor), generally after an initial fixed-rate period of two to seven years.
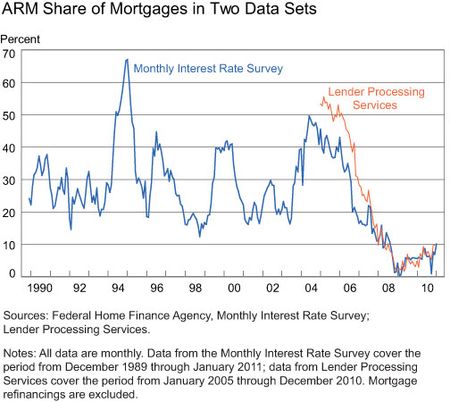
The low current share of adjustable-rate mortgages is documented in the chart below, which plots the ARM share using information from two large mortgage datasets. For data reasons, the chart focuses on purchase-only mortgages (those used to finance a new home purchase), although the trends are similar for refinancings as well.
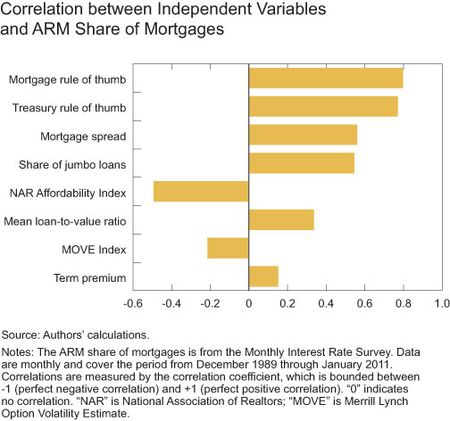
In a recent article in the Federal Reserve Bank of New York series Current Issues in Economics and Finance, Emanuel Moench, Diego Aragon, and I analyze which demand-side and supply-side factors explain this recent decline in the adjustable-rate mortgage share. Perhaps unsurprisingly, we find that relative interest rates on the two types of loans are a key determinant of household decisions. More interestingly, however, we also find that households’ choice between ARMs and FRMs depends in part on past interest rates, not just current ones. Consistent with evidence first presented by researchers at New York University, our study shows that, as a “rule of thumb,” the difference between the current FRM interest rate and the average adjustable rate over the past three years can quite successfully account for households’ choices between fixed-rate and adjustable-rate mortgages. The power of this rule of thumb is highlighted in the chart below, taken from our paper, which shows the correlation between a number of macroeconomic variables and the share of ARMs. The mortgage rule-of-thumb variable (top bar) can account for about 80 percent of the variation in the ARM share over the past twenty years. A similar rule-of-thumb variable—in this case, defined in terms of Treasury interest rates, rather than mortgage rates—does nearly as well. Both these variables explain a larger share of fluctuations in the ARM share than the current difference between fixed and adjustable interest rates (“mortgage spread” in the chart).
One interpretation of this finding is that household mortgage choice doesn’t react strongly to temporary dips in the ARM interest rate. If ARM rates have fallen only recently, households may expect higher rates in the future, making an ARM a riskier choice. In contrast, if the adjustable rate has been low for a longer period, households may be more confident that the shift is permanent, making an ARM seem safer.
Supply-side factors relating to the financial crisis also help account for the composition of recent mortgage originations. One key factor is the role of Fannie Mae and Freddie Mac. These two institutions are central to the current U.S. mortgage finance system; they purchase mortgages from lenders, securitize them, and provide a credit guarantee on the resulting mortgage-backed securities. Significantly, the two institutions are prohibited from purchasing “jumbo” loans—mortgages whose value exceeds a set of dollar limits known as the “conforming loan limits.” (The national limit for a single-family home is currently $417,000.)
How do the activities of Fannie and Freddie affect the market share of adjustable-rate mortgages? For various reasons, the ARM share is much higher in the jumbo market, as my previous research shows. This is important because in recent years the share of jumbo loans has fallen sharply. One reason is that falling home prices have reduced the size of an average mortgage. In addition, from 2008 onward, the single-family conforming loan limit was raised to as high as $729,750 in areas with high housing costs. The combination of falling home prices and rising conforming loan limits implies fewer jumbo loans and hence a smaller ARM share.
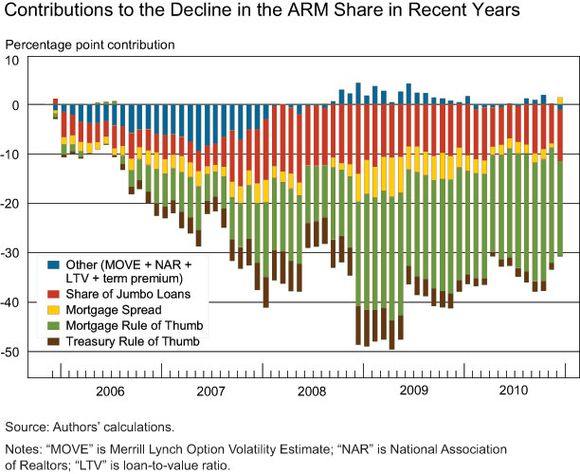
The chart below, drawn from the Current Issues article cited earlier but revised to include the most recent data, presents estimates of how much the rule-of-thumb variables and the decreasing jumbo share contributed to the decline in the ARM share since 2006. The interest rate rule-of-thumb variables (the green and brown portions of the bars) account for the majority of the decline in the ARM share—a reflection of the sharp declines in fixed-rate mortgage interest rates since 2006. The red portions of the bars represent the contribution of the decreasing size of the jumbo market; this supply-side shift explains a smaller but still important component of the declining ARM share.
Significantly, our model also accounts for the recent rise in the ARM share. As the first chart in this post reveals, the ARM share increased slightly over 2010, a trend that was highlighted in a March New York Times article. (The share reached around 10 percent by the start of 2011, according to both of our datasets.) According to the model, the key driver of this rise was an increase in fixed-rate mortgage interest rates and longer-term Treasury yields relative to the low short-term rates and ARM rates experienced in the past three years.
Why should the findings presented in this post interest policymakers? One reason is simply the sheer size of the mortgage market: according to Federal Reserve Flow
of Funds data, U.S. households owe a total of $10.2 trillion in residential mortgage debt, representing 73 percent of all household liabilities. Moreover, the sensitivity of mortgage debt to short-term interest rates shapes how monetary policy influences the broader economy. In countries like the United Kingdom, Canada, and Australia, where most mortgages are tied to short-term interest rates, a change in the central bank’s policy interest rate quickly changes mortgage payments and cash flows for existing borrowers. In the United States, where ARMs are less common, the cost of mortgage finance is tied more closely to long-term interest rates such as the ten-year Treasury rate, over which the central bank has less control. Thus, changes in the Federal Reserve’s federal funds rate target have only an indirect effect on most mortgage interest rates. Said differently, because the ARM share has been near historic lows in the United States for some time, the transmission of changes in the federal funds rate through the mortgage market to the real economy may be weaker than it was just a few years ago.
The bottom line of our research is that the low ARM share observed over the past few years—as well as the slight rise in the share in 2010—is not a mystery. Both can be accounted for by a combination of demand-side factors that also explain earlier fluctuations in the ARM share, as well as supply-side factors related to the recent financial crisis. Given the importance of the mortgage market for households, banks, and the broader economy, future trends in mortgage choice will be closely followed by policymakers, regulators, and lenders alike.
Disclaimer
The views expressed in this blog are those of the author(s) and do not necessarily reflect the position of the Federal Reserve Bank of New York or the Federal Reserve System. Any errors or omissions are the responsibility of the author(s).


 RSS Feed
 Follow Liberty Street Economics