In a previous post, I discussed the impact of changing commodity prices on the discretionary income of households and concluded that these effects generally were relatively modest except in cases of extreme swings in commodity prices. As many people know, there was a large surge in energy prices during the first quarter of 2011, and it appears to have had a significant effect on discretionary income and consumer spending. (See recent speeches by Federal Reserve Chairman Bernanke and New York Fed President Dudley; for views outside the Fed, see FT Alphaville, Tim Duy, and James Hamilton.)
In this post, I show that the budgets of lower income households have likely suffered a pronounced hit from this recent commodity price surge because they typically spend a greater share of their income on food and energy. I conclude that these households may have to cut back on much more of their other spending than the average family does—perhaps by enough to have an aggregate effect.
My analysis of data from the Bureau of Labor Statistics’ Consumer Expenditure Survey (CEX) shows that lower income households spend a higher share of their income on food and energy—around 18.5 percent, compared with the aggregate share of about 13.75 percent. The difference is likely not sufficient to lead to much larger effects on their disposable income than the effects I found using aggregate personal consumption expenditure (PCE) data in my earlier post. However, the difference is more noticeable when a large increase in commodity prices occurs, such as in the first quarter.
Similar to previous analyses of expenditures across households (see the recent piece by the Cleveland Fed), I use the CEX to examine this issue because, unlike the PCE, it provides information on how lower income households spend their money. These data sources are pretty similar, but not exactly comparable, as I discuss in a background question at the end of the post.
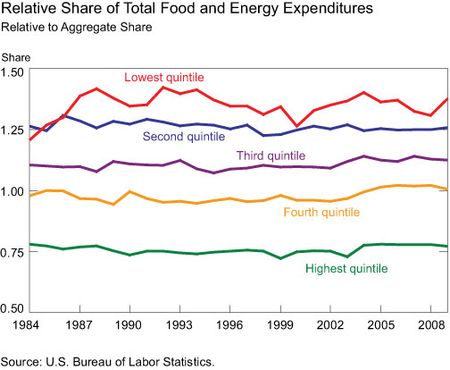
The chart below shows the share of food and energy expenditures for different income quintiles compared with the aggregate food and energy share of spending in the CEX. (An income quintile represents 20 percent of households, according to their reported before-tax income.) A value of 1.0 means that the food and energy expenditure share is equal to the aggregate share (aggregate food and energy expenditures divided by aggregate total expenditures). In fact, the chart shows that it is the fourth quintile (the 60th to 80th percentiles) that has a value near 1.0, indicating that most households have a food and energy expenditure share that is above the aggregate share.
More broadly, these relative shares support the common intuition that poor families spend more of their income on food and energy. The share for the lowest-income quintile is the highest, averaging about 135 percent of the aggregate share, while the share for the highest-income quintile averages about 75 percent of the aggregate share.
Applying these income-based differences in spending patterns to the aggregate PCE data implies (subject to some caveats that I mention below) that the lowest-income households devote about 18.5 percent of their total consumption expenditures to food and energy—not quite double the highest-income households’ 10 percent share.
These differences are notable, but ordinarily they are just not significant enough to support the view that commodity price increases lead to large drops in the disposable income of lower income households. If we multiply the aggregate purchasing power changes to commodity price fluctuations (discussed in the aforementioned post) by the higher relative share for the lowest-income quintile (or even somewhat more than that), we see that the purchasing power changes for that quintile over the last two decades generally would have been less than 0.1 percentage point of the quintile’s total expenditures, which is still a small effect.
However, because of the large rise in consumer energy prices in the first quarter, this aggregate purchasing power measure fell by 0.45 percent of PCE, equivalent to over $45 billion at an annual rate (in contrast, because the rise in consumer food prices was less extreme, its effect on aggregate purchasing power was less than 0.05 percent of PCE). With aggregate effects of this magnitude, there is a larger effect on lower income households: Performing a calculation similar to the one in the previous paragraph, we find that the purchasing power impact on lower income households is about 0.6 percent of their spending. Because many of these households have tight budgets and few assets, such a drop in discretionary income can impose notable constraints on their spending.
Background Question
- How comparable are the CEX and PCE expenditure categories? Because of the two sources’ differences in total expenditures, the relative shares we calculate from the CEX provide only a rough guide to the differences across income groups for the PCE. Still, the CEX data are the most accessible for measuring differences in expenditures across income groups. In the CEX, food at home and energy expenditures are very similar to the corresponding items in the PCE. However, total expenditures in the CEX and PCE differ in significant ways. In particular, the PCE includes owners’ equivalent rent, implicit expenditures on financial services, and third-party expenditures on medical services—all of which are not included in the CEX. However, the CEX includes mortgage payments, which are not part of PCE expenditures.
Disclaimer
The views expressed in this blog are those of the author(s) and do not necessarily reflect the position of the Federal Reserve Bank of New York or the Federal Reserve System. Any errors or omissions are the responsibility of the author(s).


 RSS Feed
 Follow Liberty Street Economics