Rebecca Hellerstein and Pinelopi Goldberg*
Since the 1930s, the conventional wisdom among economists has held that producer prices are more rigid than consumer prices. The roots of this view lie in the 1930s-era “administered price” thesis, which states that large firms set their prices more rigidly than do small firms. In this post, we report that this old “fact” is not true. We instead find that the prices set by large firms are much more flexible than those set by small firms. A key implication of this finding is that policymakers concerned about inflation or deflation should pay particular attention to changes in large firms’ prices.
In a New York Fed staff report, we analyze the data used to construct the U.S. producer price index (PPI), finding that large firms exhibit considerably more price flexibility than do small firms—not less—even within narrowly defined industries. Surprisingly, once large firms are weighted correctly in the data, producer prices appear to be at least as flexible as consumer prices.
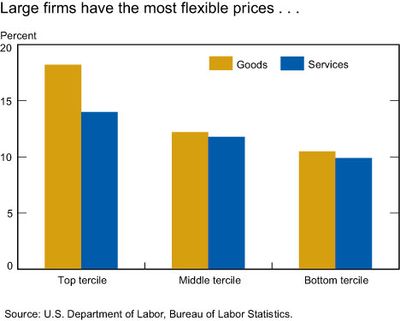
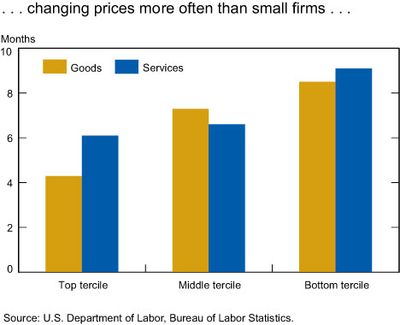
Each month, the Bureau of Labor Statistics (BLS) collects confidential microeconomic price data across a broad set of industries, both goods and services, for its PPI program. Our study uses these data from 1987 to 2008, and shows that across industries large firms change prices much more frequently than do small firms, and by smaller amounts. To illustrate these patterns, the first two charts break up our sample firms into three groups, according to their size. The horizontal axes identify each of these three size groups, or terciles. The vertical axes show the weighted median frequency of price changes (in the first chart) and the weighted median duration of a price change (in the second chart). The charts show that among goods industries, large firms change their prices almost twice as often as do small firms. These frequencies translate into an implied price duration of 4.3 months for large firms and 8.5 months for small firms. Among services industries, one sees a similar pattern across the firm size distribution, though the differences are not as pronounced. Large services firms change their prices every six months, and small firms every nine months.
These results establish a new stylized fact for the United States and raise the question of whether similar patterns exist in other countries. As we describe in more detail in our staff report, while some recent studies have found similar pricing patterns across the firm size distribution in a couple of other countries (Canada and New Zealand), there has been no systematic analysis of the relationship between firms’ size and their pricing behavior across countries.
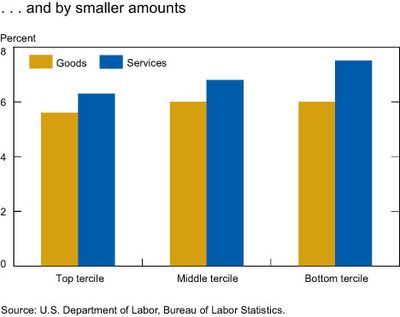
We also find that the absolute size of price changes varies systematically over the firm size distribution. As shown in the chart below, large firms change their prices by smaller absolute amounts than do small firms, though this pattern is more pronounced for services industries than for goods industries.
What are the implications of our findings for aggregate measures of price flexibility in the U.S. economy? Across all goods and services industries, we find that the median frequency of price change is 13.1 percent, with a median implied duration of 6 months. The median frequency is 16.5 percent for goods and 11.9 percent for services, with a median implied duration of 5.1 and 6.4 months, respectively. Klenow and Malin (2010) report that the median duration of a price change in the United States lies between 3 and 5 months in the consumer price index, including sales, and between 7 and 9 months, excluding sales. Our findings suggest that the rigidity of finished goods and services producer prices lies between the rigidity of consumer prices including, and excluding, sales. So once large firms are weighted appropriately in the data, producer prices appear about as flexible as consumer prices.
For central bankers, one of the most important measurement challenges remains characterizing the microeconomic sources of inflation to understand its underlying drivers. In a June 2008 speech, Ben Bernanke noted that a better understanding of the factors that determine the pricing behavior of “price setters themselves, namely businesses” is one of the major unresolved issues for monetary policymakers—while there are surveys available of households and economists as well as from markets of inflation-indexed securities, there is only very limited information about the determinants of firms’ pricing behavior.
Our findings begin to address this gap in our knowledge, suggesting that a firm’s size may affect its willingness to change prices and in turn implying that there may be returns to scale in the technology of price setting. Firms may face a fixed cost to adjusting prices, perhaps due to the need for managerial time and effort to review market conditions and set new prices. This interpretation is consistent with a recent finding for the euro area, that large firms review their prices more frequently than do small firms. Our results suggest that, going forward, policymakers concerned about the possibility of deflation or rising inflation may want to pay particular attention to the pricing behavior of large firms.
Background Questions
- What is the “administered price” view? The thesis was developed in 1934-35 by a prominent economist of that era, Gardiner Means, to explain the cyclical behavior of industrial prices in the early 1930s. Means claimed that large firms were more likely to exercise administrative control over prices, and so keep them constant over multiple transactions, rather than allowing them to vary along with market trends. In his view, the rise of large corporations in the late 19th century contributed to the severity and duration of the Great Depression by their failure to equilibrate demand and supply in markets across the United States, most egregiously when real economic activity declined.
- What is the producer price index? The PPI is a set of indexes produced by the BLS that measure the average change over time in the prices received by domestic producers of goods and services. The BLS surveys the prices of about 100,000 items each month, seeking to measure the entire marketed output of U.S. producers.
*Pinelopi Goldberg is a professor of economics at Yale University.
Disclaimer
The research described in this blog was conducted with restricted access to U.S. Bureau of Labor Statistics (BLS) data. The views expressed in this blog are those of the author(s) and do not necessarily reflect the position of the BLS, the Federal Reserve Bank of New York, or the Federal Reserve System. Any errors or omissions are the responsibility of the author(s).


 RSS Feed
 Follow Liberty Street Economics