Richard K. Crump, Stefano Eusepi, and Emanuel Moench
Since the 1980s, the primary policy tool of the Federal Reserve has been the federal funds rate. Because expectations of the future path of the funds rate play a central role in the term structure of interest rates and thus the monetary transmission mechanism, it is important to know how accurate these expectations are in predicting the funds rate. In this post, we investigate this issue using a well-known survey of private sector forecasters. We find that forecasts tend to over-predict the funds rate in easing cycles and under-predict it in tightening cycles. In addition, while forecasts during tightening cycles have become more accurate over time, forecast accuracy during easing cycles has not improved.
We study information collected in the Blue Chip Financial Forecasts Survey. This survey, conducted monthly since the early 1980s, asks participants ranging from broker-dealers to economic consulting firms to provide forecasts of the quarterly average of a variety of economic and financial variables up to two years in the future. For example, in the most recent survey, one could find forecasts of the quarterly average value of the funds rate for the third quarter of 2011 through the fourth quarter of 2012 from approximately fifty different forecasters. This survey is a rich source of forecast information both across time and across individual forecasters.
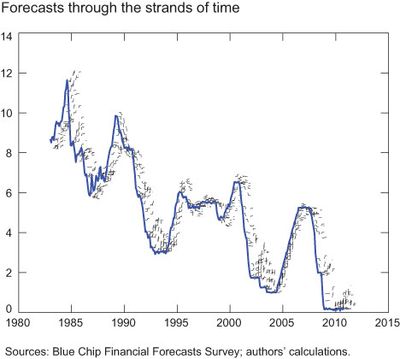
We measure policy expectations by the average forecast of the funds rate in the Financial Forecasts Survey. Our first observation is that forecasts tend to over-predict the funds rate in easing cycles and under-predict it in tightening cycles. For reference, we define an easing cycle as a period of sustained reductions in the target funds rate and a tightening cycle as a period of sustained increases in the target rate. This property is displayed in the “hair” chart below. The hair-like projections extending from the main series are average forecasts of the funds rate from the Financial Forecasts Survey for each of the next four quarters. The strands differ from the actual level of the rate when the average forecast is incorrect. During easing cycles, the strands tend to be above the future level of the funds rate, while during tightening cycles, the strands tend to be below the rate’s future level. Consequently, the strands tend to be to the right of the actual funds rate series over most of our sample period.
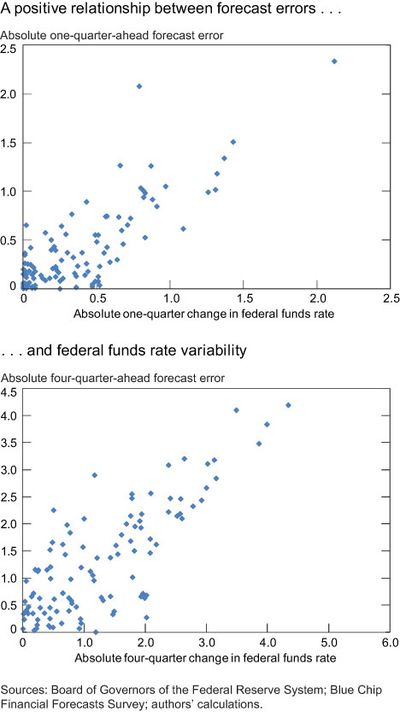
Our second observation is that forecast errors are generally larger when the federal funds rate displays large changes. In other words, the absolute size of forecast errors is positively related to the variability of the funds rate. This result is consistent with the idea that at times of large movements in the funds rate, there is also considerable uncertainty about the policy and/or macroeconomic outlook, which is borne out by generally higher absolute forecast errors. We consider two different forecast horizons: one quarter ahead and four quarters ahead. Specifically, we use the middle month of the quarter as our forecast date. For example, for the measure of the funds rate forecast for the second quarter of 1990, the one-quarter-ahead forecast would have been made by forecasters in February 1990 and the four-quarters-ahead forecast in May 1989. We measure variability by the absolute value of the one-quarter and four-quarter changes in the quarterly average value of the funds rate.
To investigate the relationship between forecast errors and variability, we provide scatter-plots that set absolute forecast errors against our measure of funds rate variability. The data for the one-quarter-ahead and four-quarters-ahead plots begin in first-quarter 1983 and second-quarter 1984, respectively. For reference, points on the scatter-plot that are closer to the horizontal axis represent more accurate forecasts. The scatter-plots are certainly suggestive of a positive relationship between the variables. Furthermore, if we fit a least-squares line to the points in these plots, the slope coefficients are 0.81 (one-quarter horizon) and 0.79 (four-quarter horizon).
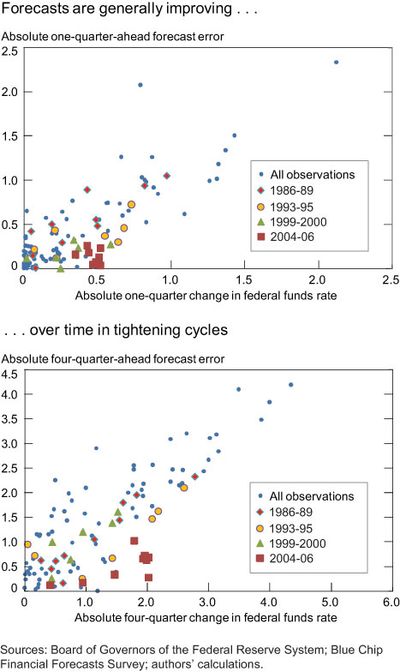
Next, we delve deeper by investigating certain historical episodes. For example, if we focus only on tightening cycles, then the average forecast of the federal funds rate during these cycles appears more accurate over time, especially at the one-quarter horizon. At this horizon, as we progress from the 1987-89 and 1994-95 tightening cycles to the 1999-2000 and 2004-06 tightening cycles, the points generally become more concentrated and shift toward the bottom axis. At the four-quarter horizon, this pattern is not quite as pronounced. The forecast performance is clearly best for the 2004-06 tightening cycle, but there is no obvious ranking among the other three tightening cycles. At both horizons, the most recent tightening cycle, from June 30, 2004, to June 29, 2006, produces a group of points located close to the bottom axis and with limited variability. If we look back to the hair chart, we can see that the strands during this tightening cycle closely follow the future level of the funds rate.
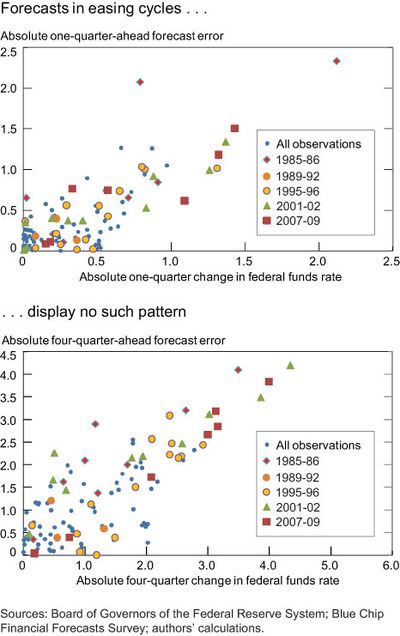
However, when we perform the same exercise for easing cycles, the pattern no longer holds. Indeed, there does not appear to be any evidence that average forecasts have improved over time during easing cycles.
Understanding the accuracy of policy expectations is of great interest to a central bank. In this post, we assess the performance of private sector forecasts of the federal funds rate since the early 1980s. We find that private sector forecasts tend to produce larger errors during times of substantial policy changes; however, during the past four tightening cycles, private sector forecast accuracy has improved at a one-quarter horizon. In our next post we look into possible explanations for these observed patterns.
Disclaimer
The views expressed in this post are those of the author(s) and do not necessarily reflect the position of the Federal Reserve Bank of New York or the Federal Reserve System. Any errors or omissions are the responsibility of the author(s).


 RSS Feed
 Follow Liberty Street Economics